|
|
|
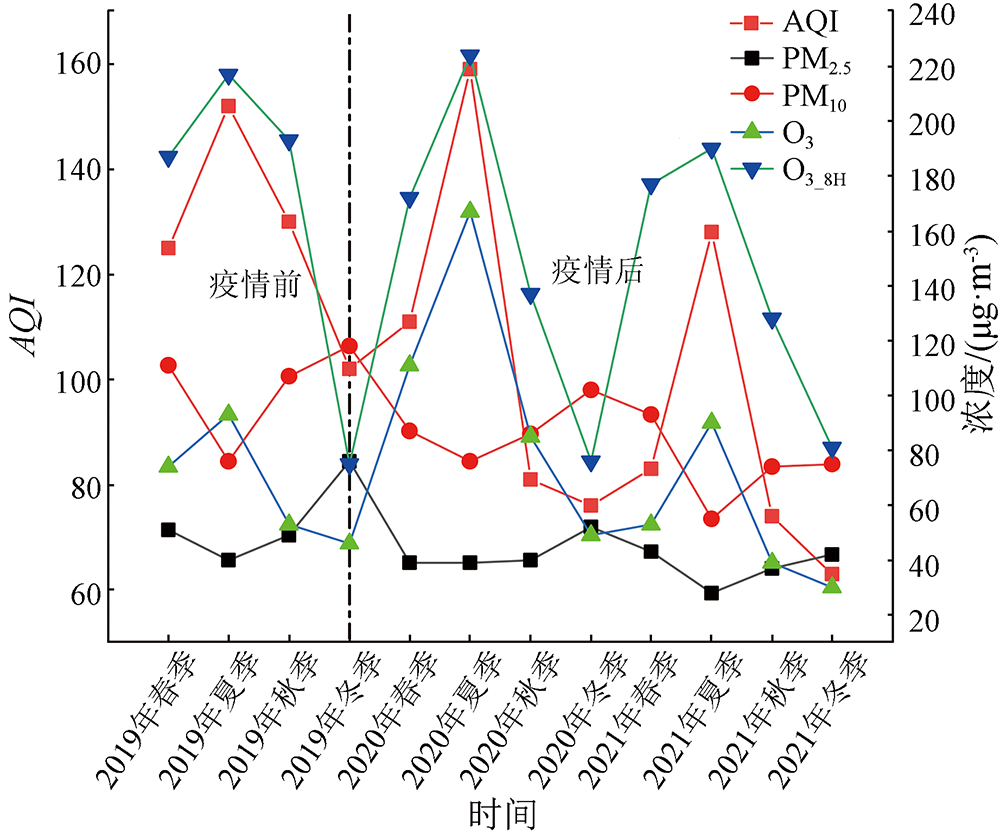
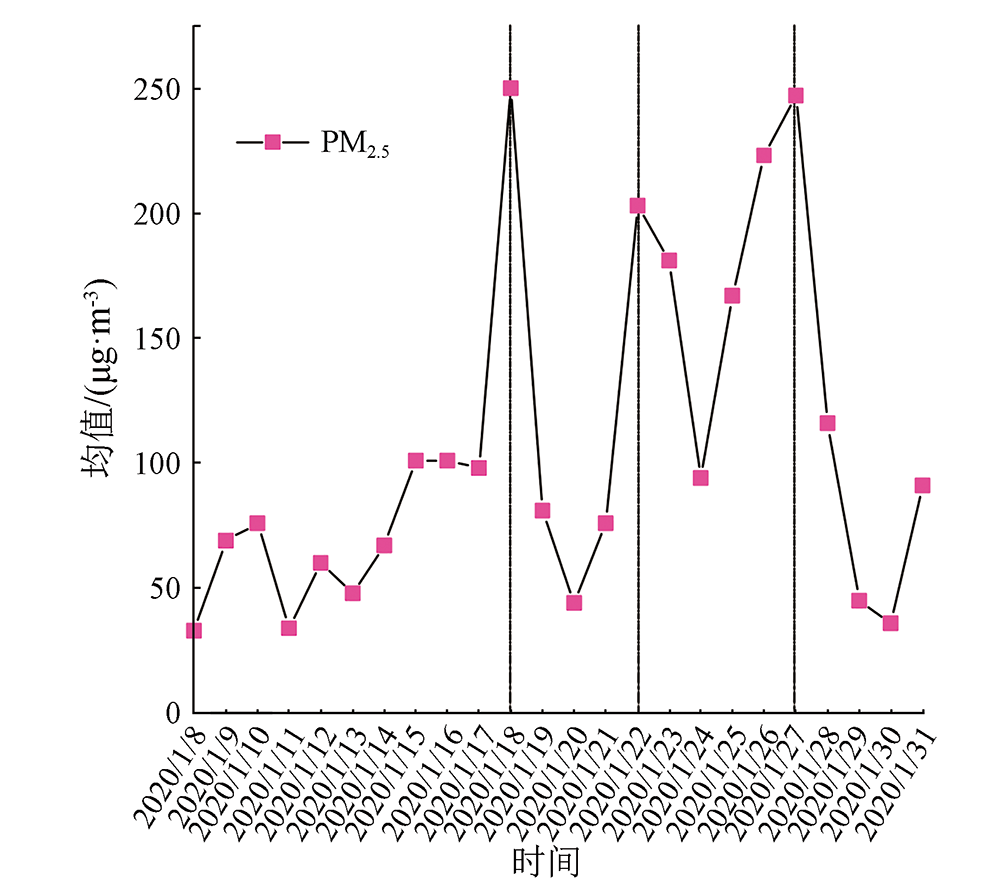
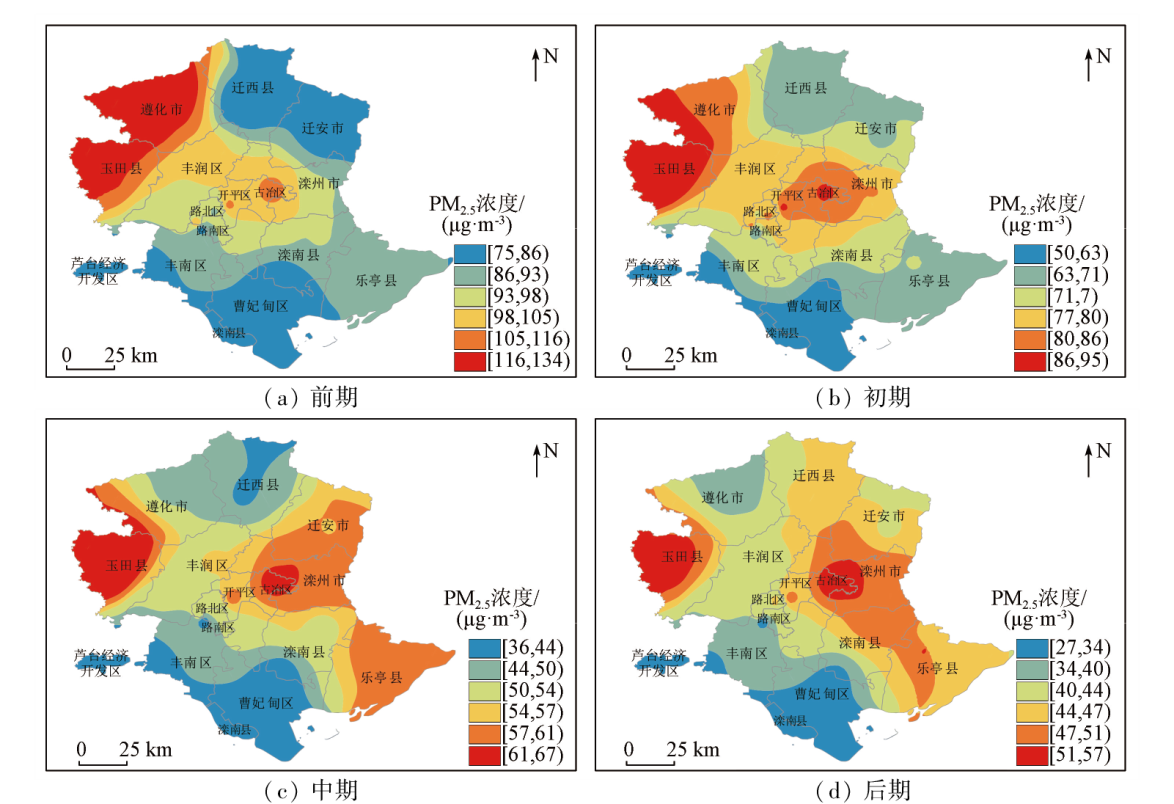
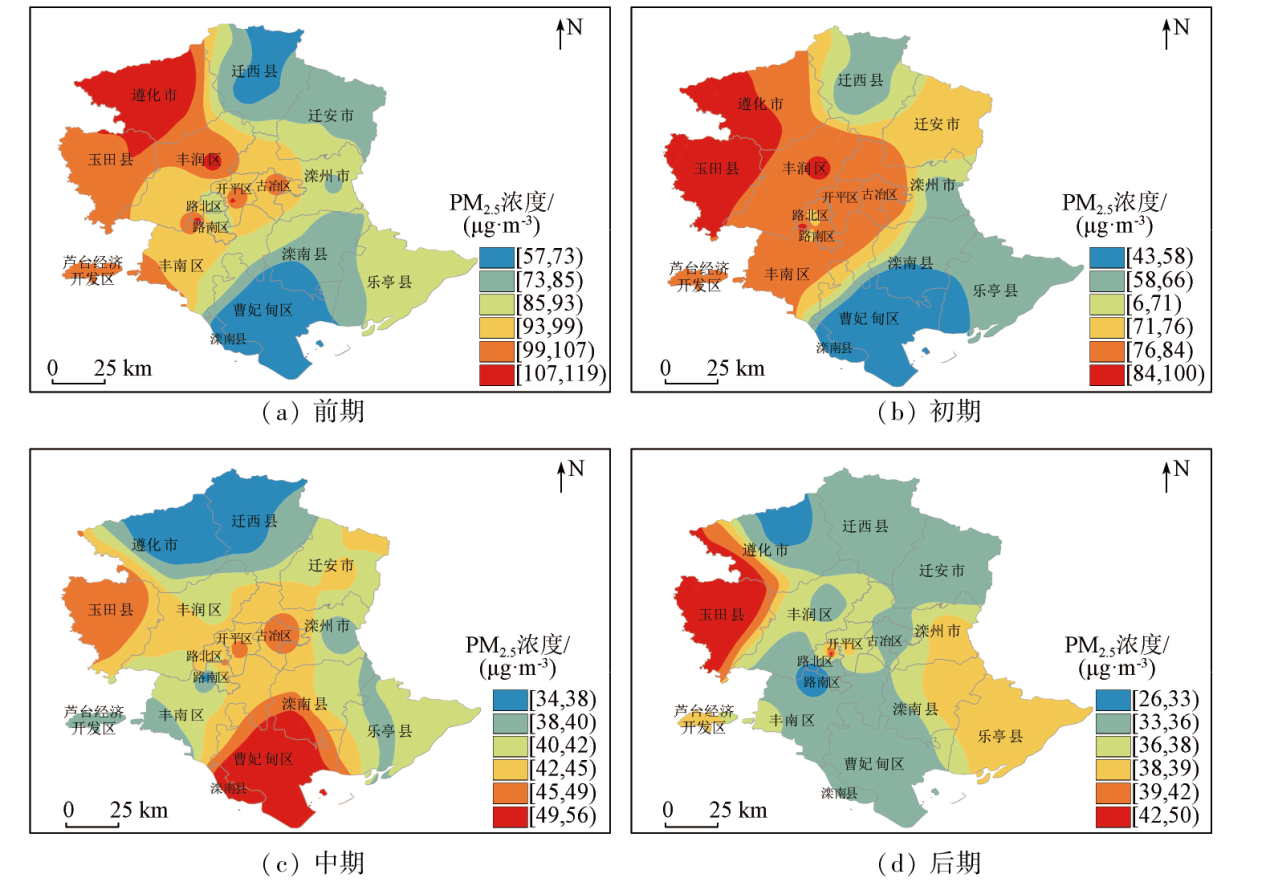
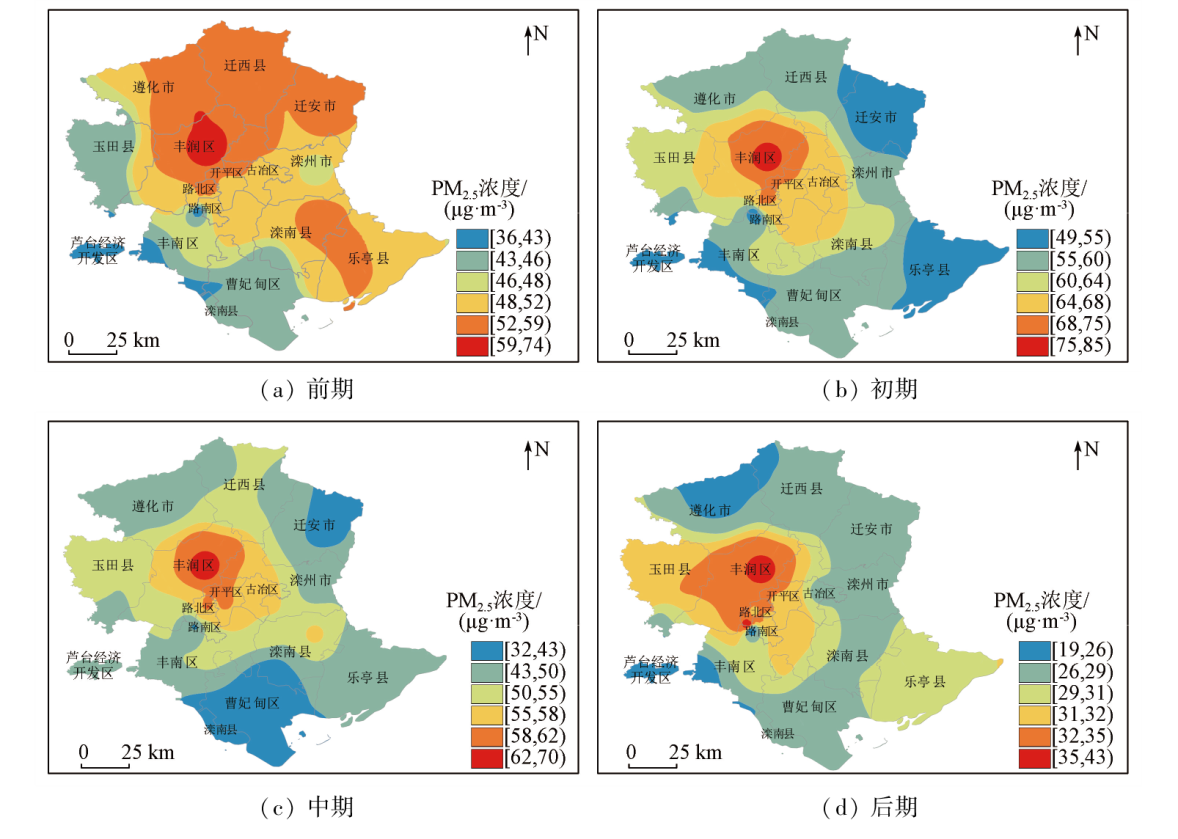
Abstract To investigate the anthropogenic influence on air pollution before and after the COVID-19 pandemic, this study analyzed the variations and causes of air pollutants in Tangshan City from 2019 to 2021. It derived the changes in their concentrations and their influencing factors in each time period using an estimation model for emission reduction effects and an inverse distance interpolation method. Accordingly, this study proposed reasonable suggestions for the atmospheric environment control in Tangshan. The results show that: ① From 2019 to 2021, the proportions of primary pollutants in Tangshan remained relatively stable, with PM2.5 ranking first and photochemical pollution represented by O3 increasing significantly in recent years; ② The results calculated using the formula for anthropogenic emission reduction show that the control over anthropogenic emissions plays a significant role in constraining air pollution; ③ The analysis based on the inverse distance interpolation method indicates that the peak concentration of PM2.5 gradually decreased, with the high-concentration distribution shifting toward the city center.
|
| Keywords
COVID-19
Tangshan City
characteristics of air pollutants
anthropogenic influence
|
|
|
|
Issue Date: 13 March 2024
|
|
|
| [1] |
田晓蕾, 谢志辉, 刘孟雄, 等. 2014—2020年唐山市O3与PM2.5浓度变化及复合污染特征[C]// 中国环境科学学会2021年科学技术年会论文集(一).中国环境科学学会, 2021:580-586.
|
| [1] |
Tian X L, Xie Z H, Liu M X, et al. DOTA:Changes of O3 and PM2.5 concentrations and characteristics of combined pollution in Tangshan City from 2014 to 2020[C]// Chinese Society for Environmental Sciences, 2021:580-586.
|
| [2] |
张壹, 魏扬. 2019—2021年唐山市PM2.5及O3污染特征分析[J]. 绿色科技, 2023, 25(2):81-87.
|
| [2] |
Zhang Y, Wei Y. Characteristics of PM2.5 and O3 pollution in Tangshan City from 2019 to 2021[J]. Journal of Green Science and Technology, 2023, 25(2):81-87.
|
| [3] |
赵雪, 沈楠驰, 李令军, 等. COVID-19疫情期间京津冀大气污染物变化及影响因素分析[J]. 环境科学, 2021, 42(3):1205-1214.
|
| [3] |
Zhao X, Shen N C, Li L J, et al. Analysis of changes and factors influencing air pollutants in the Beijing-Tianjin-Hebei region during the COVID-19 Pandemic[J]. Environmental Science, 2021, 42(3):1205-1214.
|
| [4] |
易嘉慧, 何超, 杨璐, 等. COVID-19疫情期间全球气温和主要大气污染物浓度变化的空间关联[J]. 生态环境学报, 2022, 31(4):740-749.
doi: 10.16258/j.cnki.1674-5906.2022.04.012
|
| [4] |
Yi J H, He C, Yang L, et al. Spatial correlation between changes in global temperature and major air pollutants during the COVID-19 pandemic[J]. Ecology and Environmental Sciences, 2022, 31(4):740-749.
|
| [5] |
Wilder-Smith A, Freedman D O. Isolation,quarantine,social distancing and community containment:Pivotal role for old-style public health measures in the novel coronavirus (2019-nCoV) outbreak[J]. Journal of Travel Medicine,2020, 27(2):taaa020.
doi: 10.1093/jtm/taaa020
url: https://academic.oup.com/jtm/article/doi/10.1093/jtm/taaa020/5735321
|
| [6] |
侯广玺. 唐山以“中国近代工业的摇篮”闻名于世[J]. 中国地名, 2014(1):74-76.
|
| [6] |
Hou G X. Tangshan is famous as “the cradle of China’s modern industry”[J]. China Place Name, 2014(1):74-76.
|
| [7] |
张浩杰. 唐山市PM2.5污染特征与来源解析[D]. 济南: 山东大学, 2019.
|
| [7] |
Zhang H J. Characteristics and source apportionment of PM2.5 pollution in Tangshan[D]. Jinan: Shandong University, 2019.
|
| [8] |
彭思岭. 气象要素空间插值方法优化研究[J]. 地理空间信息, 2017, 15(7):86-89.
|
| [8] |
Peng S L. Optimized study on spatial interpolation methods for meteorological element[J]. Geospatial Information, 2017, 15(7):86-89.
|
| [9] |
曹越, 王宏宇. 城市环境中遥感技术的应用研究[J]. 环境科学与管理, 2015, 40(3):5-8.
|
| [9] |
Cao Y, Wang H Y. Application of remote sensing technology in environmental research[J]. Environmental Science and Management, 2015, 40(3):5-8.
|
| [10] |
李令军, 王占山, 张大伟, 等. 2013—2014年北京大气重污染特征研究[J]. 中国环境科学, 2016, 36(1):27-35.
|
| [10] |
Li L J, Wang Z S, Zhang D W, et al. Analysis of heavy air pollution episodes in Beijing during 2013-2014[J]. China Environmental Science, 2016, 36(1):27-35.
|
| [11] |
张荣芝, 王云霞, 史密伟, 等. 石家庄市大气PM_(2.5)中PAHs污染特征及来源分析[J]. 山东化工, 2021, 50(21):234-237.
|
| [11] |
Zhang R Z, Wang Y X, Shi M W, et al. Pouution characteristics and sources of PAHs in PM2.5 in Shijiazhuang City[J]. Shandong Chemical Industry, 2021, 50(21):234-237.
|
| [12] |
王秀玲, 花家嘉, 李轩, 等. 2015—2017年唐山市PM_(2.5)重污染生消气象条件分析[J]. 气象与环境学报, 2020, 36(4):45-51.
|
| [12] |
Wang X L, Hua J J, Li X, et al. Meteorological conditions for formation and dissipation of PM2.5 heavy pollution in Tangshan from 2015 to 2017[J]. Journal of Meteorology and Environment, 2020, 36(4):45-51.
|
| [13] |
彭玏, 赵媛媛, 赵吉麟, 等. 京津冀大气污染传输通道区大气污染时空格局研究[J]. 中国环境科学, 2019, 39(2):449-458.
|
| [13] |
Peng L, Zhao Y Y, Zhao J L, et al. Spatiotemporal patterns of air pollution in air pollution transmission channel of Beijing-Tianjin-Hebei from 2000 to 2015[J]. China Environmental Science, 2019, 39(2):449-458.
|
| [14] |
周亚端, 朱宽广, 黄凡, 等. 新冠肺炎疫情期间湖北省大气污染物减排效果评估[J]. 环境科学与技术, 2020, 43(3):228-236.
|
| [14] |
Zhou Y D, Zhu K G, Huang F, et al. Emission reductions and air quality improvements during the COVID-19 pandemic in Hubei Province[J]. Environmental Science & Technology, 2020, 43(3):228-236.
|
| [15] |
王晓琦, 郎建垒, 程水源, 等. 京津冀及周边地区 PM2.5传输规律研究[J]. 中国环境科学, 2016, 36(11):3211-3217.
|
| [15] |
Wang X Q, Lang J L, Cheng S Y, et al. Study on transportation of PM2.5 in Beijing-Tianjin-Hebei(BTH) and its surrounding area[J]. China Environmental Science, 2016, 36(11):3211-3217.
|
| [16] |
Huang F F, Li X, Wang C, et al. PM2.5 spatiotemporal variations and the relationship with meteorological factors during 2013-2014 in Beijing,China[J]. PLoS One, 2015, 10(11):E0141642.
doi: 10.1371/journal.pone.0141642
url: https://dx.plos.org/10.1371/journal.pone.0141642
|
|
Viewed |
|
|
|
Full text
|
|
|
|
|
Abstract
|
|
|
|
|
Cited |
|
|
|
|
| |
Shared |
|
|
|
|
| |
Discussed |
|
|
|
|
 2024,
Vol. 36
2024,
Vol. 36
 ), REN Yongqiang1(