|
|
|
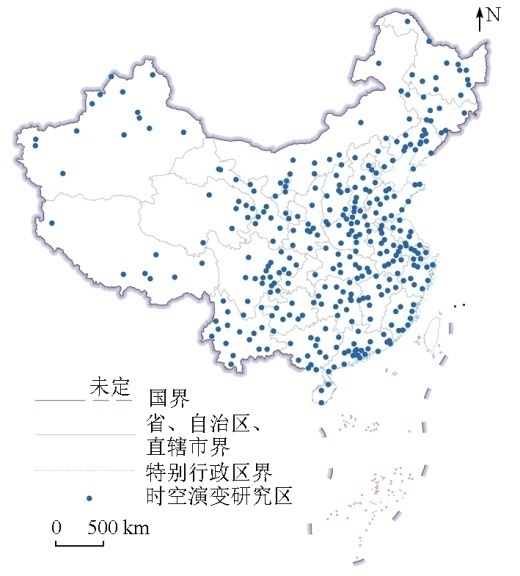
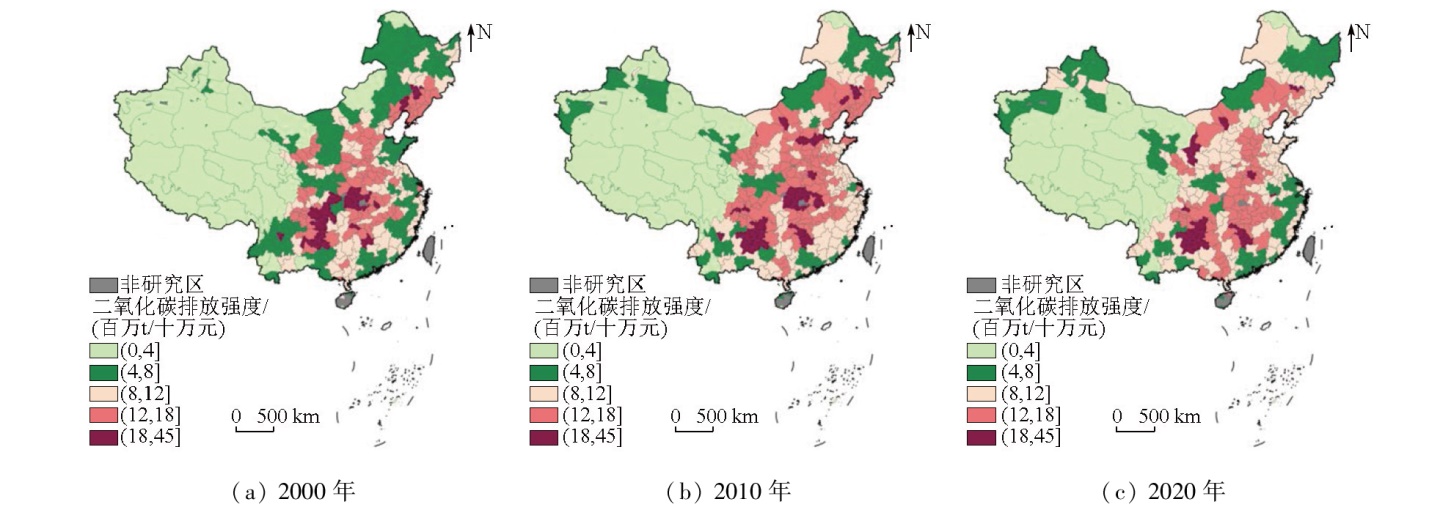
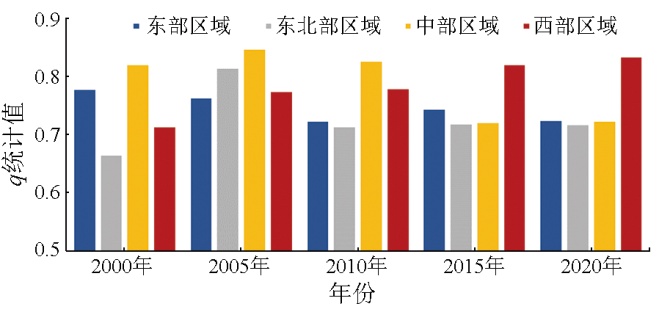
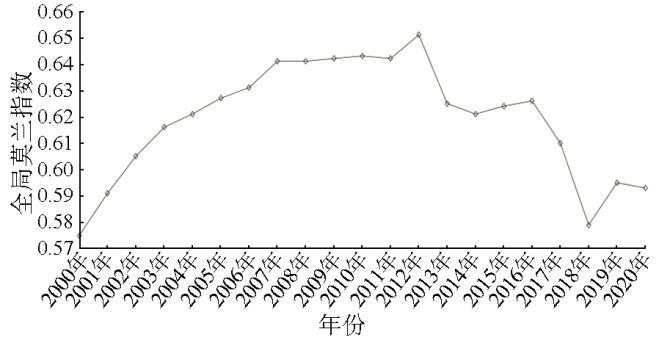
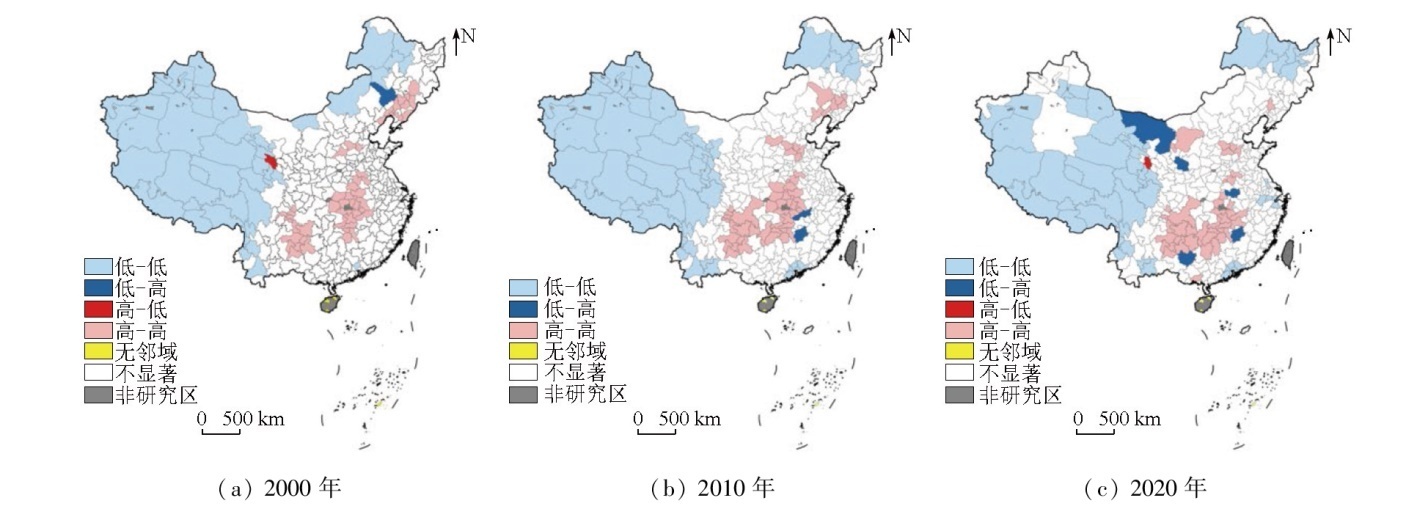
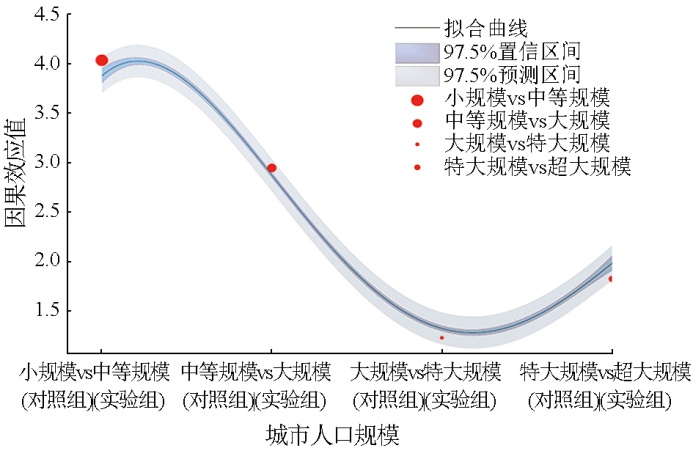
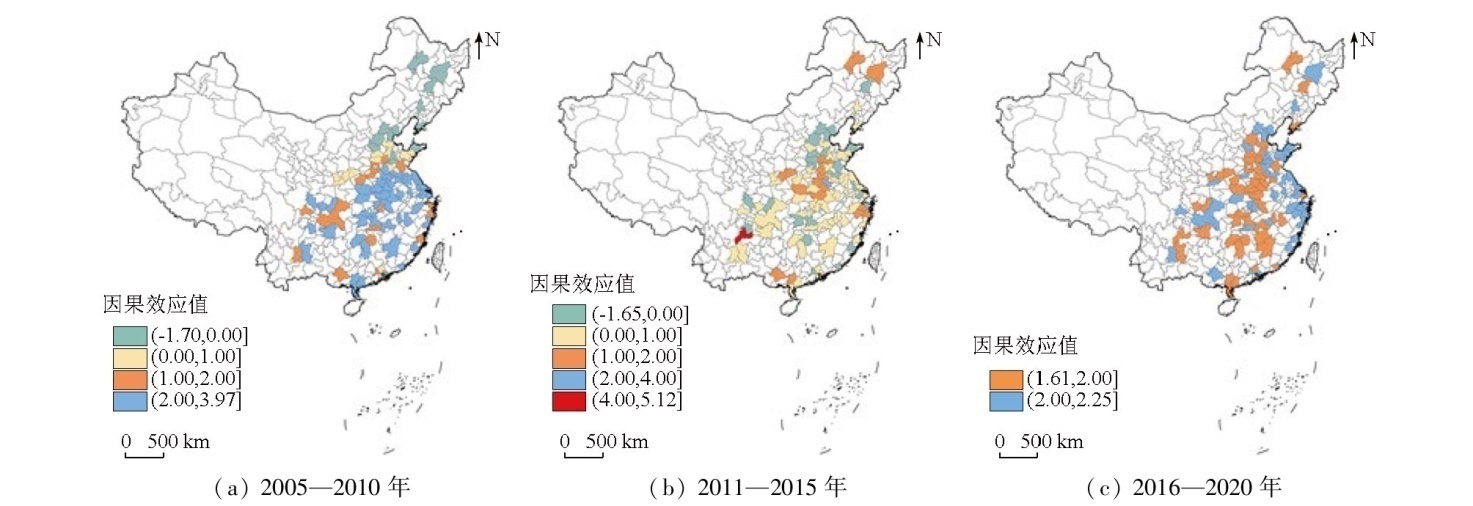
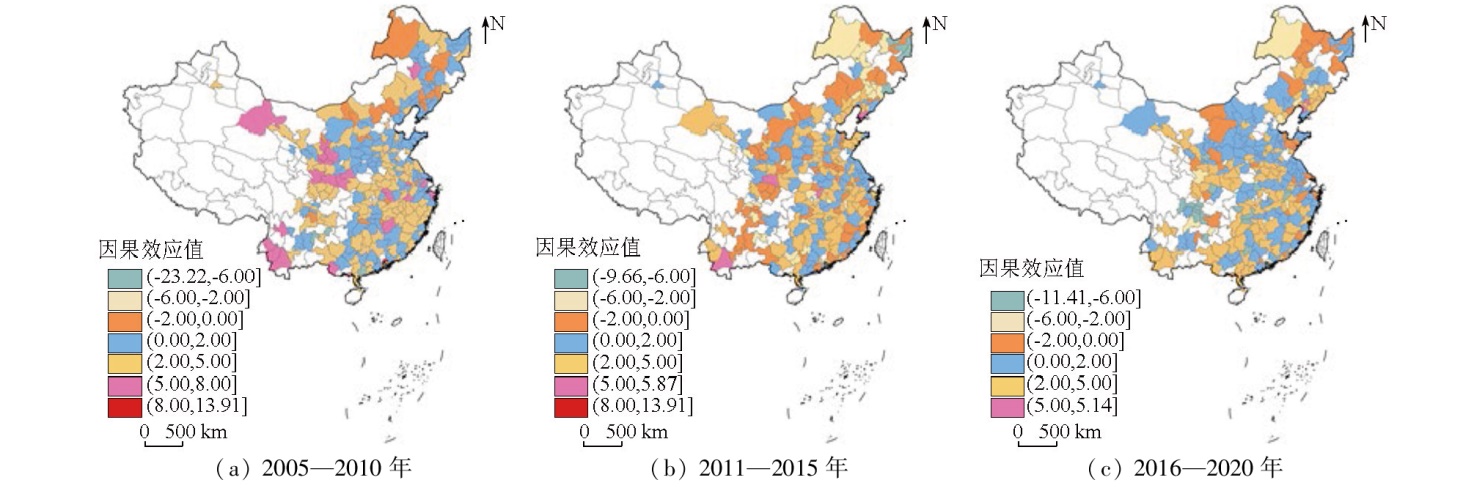
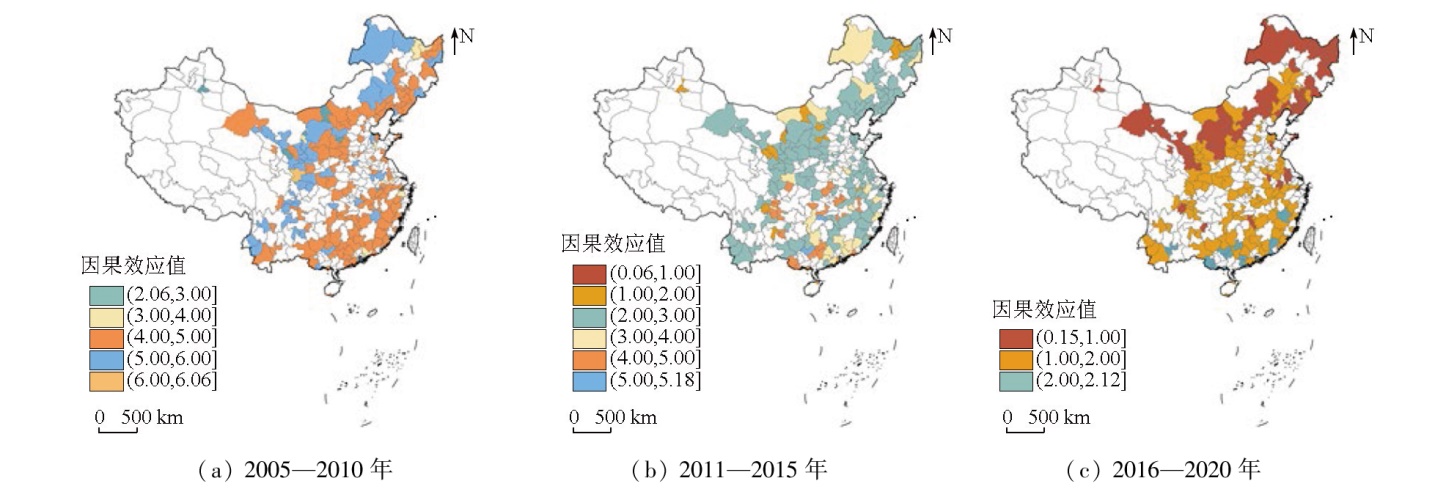
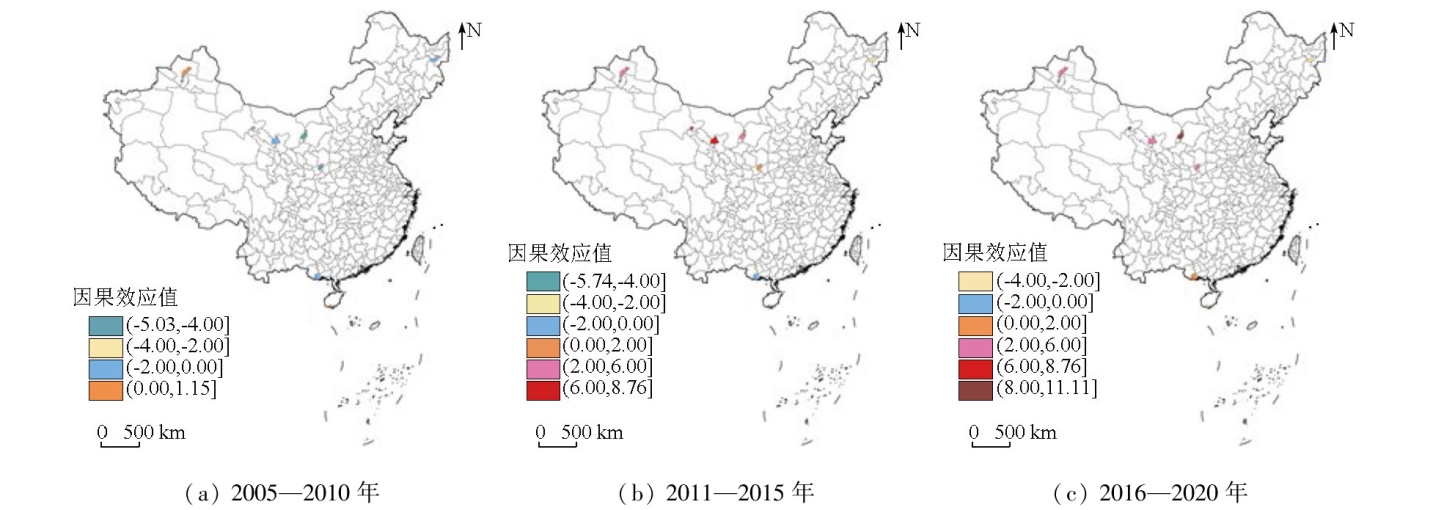
Abstract Under severe global climate change, achieving carbon peak and neutrality goals is of great significance. Exploring the influence of a specific factor on carbon dioxide (CO2) emission intensity while controlling other driver variables remains a challenge. With CO2 emission intensity data at the prefecture-level city scale as a data source, this study analyzed the spatial heterogeneity and spatial correlation of CO2 emission intensity using the geodetector model and the spatial autocorrelation method, respectively. Using the constructed Bayesian causal forest model, and controlling other drivers, this study obtained the causal effects of China’s urban population size on CO2 emission intensity from 2005 to 2020, presenting a U-shaped curve. Accordingly, this study explored the influence mechanism of China’s urban population size on CO2 emission intensity. Based on the above analysis, this study proposed reasonable emission reduction policy recommendations for different regions, serving as a reference to enhance urban sustainable development.
|
| Keywords
carbon dioxide (CO2) emission intensity
spatial heterogeneity
spatial correlation
Bayesian causal forest model
causal effect
urban population size
|
|
|
|
Issue Date: 01 July 2025
|
|
|
| [1] |
Guo L, Cheng W, Liu C, et al. Exploring the spatial heterogeneity and influence factors of daily travel carbon emissions in metropolitan areas:From the perspective of the 15-min city[J]. Land, 2023, 12(2):299.
|
| [2] |
陈思宇, 魏思琪, 都瓦拉. 中国省域碳排放及其影响因素时空特征分析——基于MGWR模型的研究[J]. 内蒙古科技与经济, 2022(5):3-7.
|
| [2] |
Chen S Y, Wei S Q, Du W L. Analysis on the temporal and spatial characteristics of carbon emission ant its impact factors in provinces of China: Research based on MGWR model[J]. Inner Mongolia Science Technology & Economy, 2022(5):3-7.
|
| [3] |
李建豹, 黄贤金, 吴常艳, 等. 中国省域碳排放影响因素的空间异质性分析[J]. 经济地理, 2015, 35(11):21-28.
|
| [3] |
Li J B, Huang X J, Wu C Y, et al. Analysis of spatial heterogeneity impact factors on carbon emissions in China[J]. Economic Geography, 2015, 35(11):21-28.
|
| [4] |
袁长伟, 乔丹, 杨颖芳, 等. 中国省域交通碳排放强度空间分异与聚类分析[J]. 环境工程, 2018, 36(7):185-190.
|
| [4] |
Yuan C W, Qiao D, Yang Y F, et al. Spatial differentiation and clustering of transport carbon intensity in China’s provincial region[J]. Environmental Engineering, 2018, 36(7):185-190.
|
| [5] |
俞雅乖, 沈盼熠, 李瑜婷. 国家级城市群建筑业碳排放量及其分解效应的空间分异[J]. 新疆财经, 2022(4):19-28.
doi: 10.16716/j.cnki.65-1030/f.2022.04.002
|
| [5] |
Yu Y G, Shen P Y, Li Y T. Spatial differentiation of carbon emissions from construction industry and decomposition effects in national-level urban agglomerations[J]. Finance & Economics of Xinjiang, 2022(4):19-28.
|
| [6] |
郭禹辰, 王凯艳, 刘梦月. “碳中和”背景下流通业碳减排成熟度测度及空间异质性[J]. 商业经济研究, 2023(1):175-178.
|
| [6] |
Guo Y C, Wang K Y, Liu M Y. Maturity measurement and spatial heterogeneity of carbon emission reduction in circulation industry under the background of “carbon neutrality”[J]. Journal of Commercial Economics, 2023(1):175-178.
|
| [7] |
张丽琼, 何婷婷. 1997—2018年中国农业碳排放的时空演进与脱钩效应——基于空间和分布动态法的实证研究[J]. 云南农业大学学报(社会科学) 2022, 16(1):78-90.
|
| [7] |
Zhang L Q, He T T. Spatio-temporal of agricultural carbon emission and decoupling in China during 1997—2018:An empirical research based on spatial and distribution dynamics method[J]. Journal of Yunnan Agricultural University (Social Science), 2022, 16(1):78-90.
|
| [8] |
程进. 长三角城市群大气污染格局的时空演变特征[J]. 城市问题, 2016(1):23-27.
|
| [8] |
Cheng J. Spatial- temporal evolution features of air pollution pattern of urban agglomeration in the Yangtze River Delta[J]. Urban Problems, 2016(1):23-27.
|
| [9] |
Pan L, Yu J, Lin L. The temporal and spatial pattern evolution of land-use carbon emissions in China coastal regions and its response to green economic development[J]. Frontiers in Environmental Science, 2022,10:1018372.
|
| [10] |
Baldwin J G, Wing I S. The spatiotemporal evolution of U.S.carbon dioxide emissions:Stylized facts and implications for climate policy[J]. Journal of Regional Science, 2013, 53(4):672-689.
|
| [11] |
Shi K, Liu G, Cui Y,et al. What urban spatial structure is more conducive to reducing carbon emissions? A conditional effect of population size[J]. Applied Geography, 2023,151:102855.
|
| [12] |
孙蒙, 李长云, 邢振方, 等. 碳中和目标下中国碳排放关键影响因素分析及情景预测[J]. 高电压技术, 2023, 49(9):4011-4022.
|
| [12] |
Sun M, Li C Y, Xing Z F.et al. Analysis of key influencing factors and scenario prediction of China’s carbon emission under carbon neutrality[J]. High Voltage Engineering, 2023, 49(9):4011-4022.
|
| [13] |
程钰, 张悦, 王晶晶. 中国省域碳排放绩效时空演变与技术创新驱动研究[J]. 地理科学, 2023, 43(2):313-323.
doi: 10.13249/j.cnki.sgs.2023.02.013
|
| [13] |
Cheng Y, Zhang Y, Wang J J. Spatial-temporal evolution of provincial carbon emission performance and driving force of technological innovation in China[J]. Scientia Geographica Sinica, 2023, 43(2):313-323.
doi: 10.13249/j.cnki.sgs.2023.02.013
|
| [14] |
崔艳芳, 张国兴. 黄河流域资源型城市碳排放影响因素与达峰预测研究[J]. 人民黄河, 2023, 45(2):9-14.
|
| [14] |
Cui Y F, Zhang G X. Research on the influencing factors and peak prediction of carbon emission of resources-based cities in the Yellow River basin[J]. Yellow River, 2023, 45(2):9-14.
|
| [15] |
高庆先, 高文欧, 马占云, 等. 大气污染物与温室气体减排协同效应评估方法及应用[J]. 气候变化研究进展, 2021, 17(3):268-278.
|
| [15] |
Gao Q X, Gao W O, Ma Z Y,et al. The synergy effect assessment method and its application for air pollutants and greenhouse gases reduction[J]. Climate Change Research, 2021, 17(3):268-278.
|
| [16] |
蒋金荷. 中国碳排放关键驱动因子的分析和政策反思——基于LMDI:1995—2010[J]. 资源与生态学报, 2013, 4(4):304-310.
|
| [16] |
Jiang J H. Analysis of key drivers on China’s carbon emissions and policy rethinking based on LMDI:1995—2010[J]. Journal of Resources and Ecology, 2013, 4(4):304-310.
|
| [17] |
李健, 景美婷, 苑清敏. 绿色发展下区域交通碳排放测算及驱动因子研究——以京津冀为例[J]. 干旱区资源与环境, 2018, 32(7):36-42.
|
| [17] |
Li J, Jing M T, Yuan Q M. Estimation of carbon emission and driving factors in Beijing-Tianjin-Hebei traffic under green development[J]. Journal of Arid Land Resources and Environment, 2018, 32(7):36-42.
|
| [18] |
潘植强, 梁保尔. 旅游业碳排放强度分布及其驱动因子的时空异质研究——基于30个省(市、区)2005—2014年的面板数据分析[J].人文地理, 2016, 31(6):152-158.
|
| [18] |
Pan Z Q, Liang B E. Research on space-time heterogeneity of tourism industry carbon emission intensity distribution and influencing factors:Analysis of panel data from 30 provinces(cities and districts) from 2005 to 2014[J]. Human Geography, 2016, 31(6):152-158.
|
| [19] |
石建屏, 李新, 罗珊, 等. 中国低碳经济发展的时空特征及驱动因子研究[J]. 环境科学与技术, 2021, 44(1):228-236.
|
| [19] |
Shi J P, Li X, Luo S,et al. Research on the spatiotemporal characteristics and driving factors of China’s low carbon economic development[J]. Environmental Science & Technology, 2021, 44(1):228-236.
|
| [20] |
王小辉. 陕西省人为源碳排放时空演变动力机制与减排潜力研究[D]. 西安: 陕西师范大学, 2018.
|
| [20] |
Wang X H. Study on the dynamic mechanism of temporal and spatial evolution of man-made carbon emissions in Shaanxi Province and the potential of emission reduction[D]. Xi’an: Shaanxi Normal University, 2018.
|
| [21] |
王兴民, 吴静, 白冰, 等. 中国CO2排放的空间分异与驱动因素——基于198个地级及以上城市数据的分析[J]. 经济地理, 2020, 40(11):29-38.
doi: 10.15957/j.cnki.jjdl.2020.11.004
|
| [21] |
Wang X M, Wu J, Bai B,et al. Spatial differentiation and driving factors of CO2emissions:Analysis based on 198 cities at prefecture level and above in China[J]. Economic Geography, 2020, 40(11):29-38.
|
| [22] |
魏振香, 吴晓娟. 山东省农业低碳发展及驱动因素分析[J]. 河南科学, 2021, 39(11):1878-1886.
|
| [22] |
Wei Z X, Wu X J. Low-carbon agricultural development and dri-ving factors in Shandong Province[J]. Henan Science, 2021, 39(11):1878-1886.
|
| [23] |
张京玉. 影响中国能源消耗碳排放因素分析——基于LMDI分解模型[J]. 煤炭经济研究, 2019, 39(11):23-28.
|
| [23] |
Zhang J Y. Analysis of factors affecting China’s energy consumption carbon emissions: Based on LMDI decomposition model[J]. Coal Economic Research, 2019, 39(11):23-28.
|
| [24] |
Chen J, Gao M, Cheng S, et al. Global 1 km×1 km gridded revised real gross domestic product and electricity consumption during 1992—2019 based on calibrated nighttime light data[J]. Scientific Data, 2022,9:202.
|
| [25] |
辛龙, 孙慧, 王慧, 等. 基于地理探测器的绿色经济效率时空分异及驱动力研究[J]. 中国人口·资源与环境, 2020, 30(9):128-138.
|
| [25] |
Xin L, Sun H, Wang H, et al. Research on the spatial-temporal differentiation and driving force of green economic efficiency based on the geographic detector model[J]. China Population,Resources and Environment, 2020, 30(9):128-138.
|
| [26] |
国务院. 国务院关于调整城市规模划分标准的通知[EB/OL].(2014-11-20)[2023-06-20]. https://www.gov.cn/zhengce/content/2014-11/20/content_9225.htm.
url: https://www.gov.cn/zhengce/content/2014-11/20/content_9225.htm
|
| [26] |
State Council. Circular of the State Council on the adjustment of the criteria for classifying the size of cities[EB/OL].(2014-11-20)[2023-06-20]. https://www.gov.cn/zhengce/content/2014-11/20/content_9225.htm.
url: https://www.gov.cn/zhengce/content/2014-11/20/content_9225.htm
|
| [27] |
Hahn P R, Murray J S, Carvalho C M. Bayesian regression tree models for causal inference:Regularization,confounding,and heterogeneous effects (with discussion)[J]. Bayesian Analysis, 2020, 15(3):965-1056.
|
| [28] |
邹磊, 刘慧媛, 王飞宇, 等. 长江中游城市群绿色发展水平的地区差异及其影响因素[J]. 中国科学:地球科学, 2022, 52(8):1462-1475.
|
| [28] |
Zou L, Liu H Y, Wang F Y, et al. Regional difference and influencing factors of the green development level in the urban agglomeration in the middle reaches of the Yangtze River[J]. Scientia Sinica(Terrae), 2022, 52(8):1462-1475.
|
|
Viewed |
|
|
|
Full text
|
|
|
|
|
Abstract
|
|
|
|
|
Cited |
|
|
|
|
| |
Shared |
|
|
|
|
| |
Discussed |
|
|
|
|
 2025,
Vol. 37
2025,
Vol. 37
 ), CHAO Hui1(