|
|
 |
|

|
|
|
Analysis of changes in the economic development characteristics of the Chengdu-Chongqing urban agglomeration using remote sensing data on nighttime light |
NIU Zhensheng1,2,3( ), YANG Xin1,2(), CHEN Chao3, LIAO Xiang1, ZHANG Xiaoxuan1 ), YANG Xin1,2(), CHEN Chao3, LIAO Xiang1, ZHANG Xiaoxuan1 |
1. College of Earth Sciences, Chengdu University of Technology, Chengdu 610059, China
2. Key Lab of Earth Exploration and Information Techniques of Ministry of Education, Chengdu University of Technology, Chengdu 610059, China
3. School of Civil Engineering, Henan University of Engineering, Zhengzhou 451191, China |
|
|
|
|
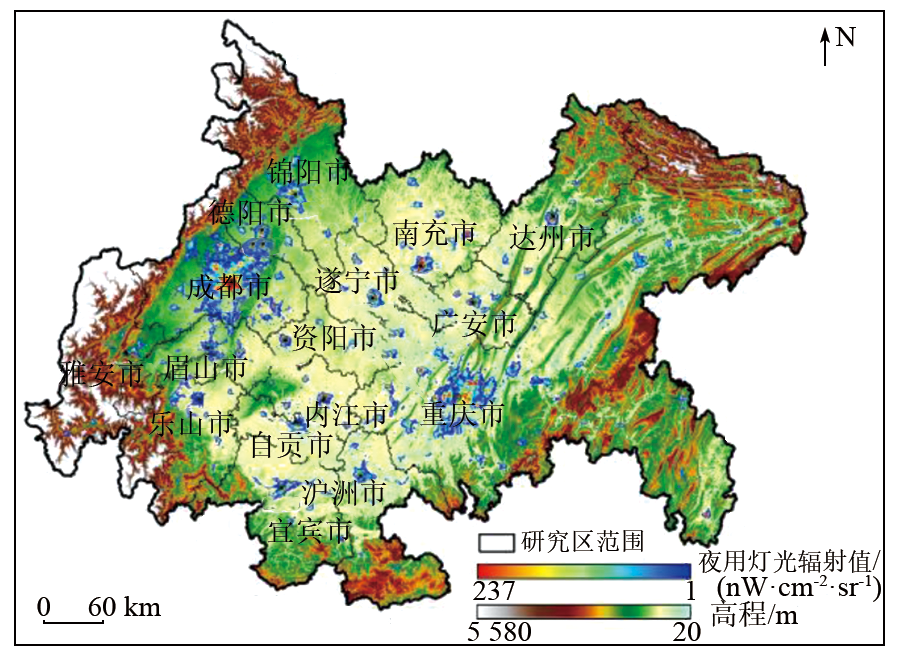
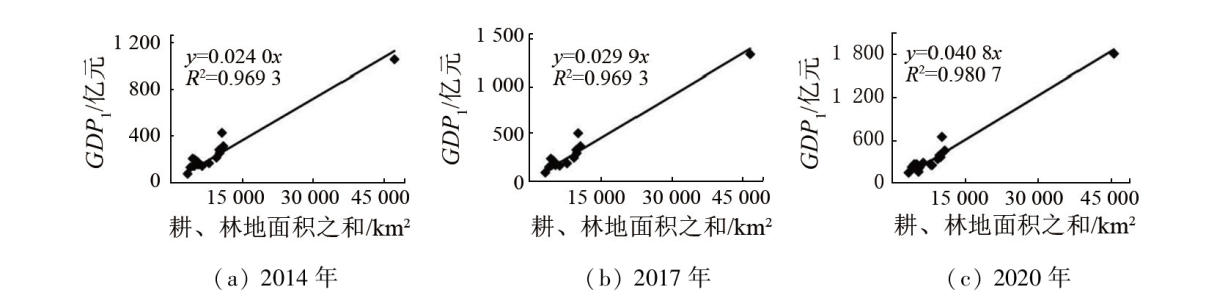
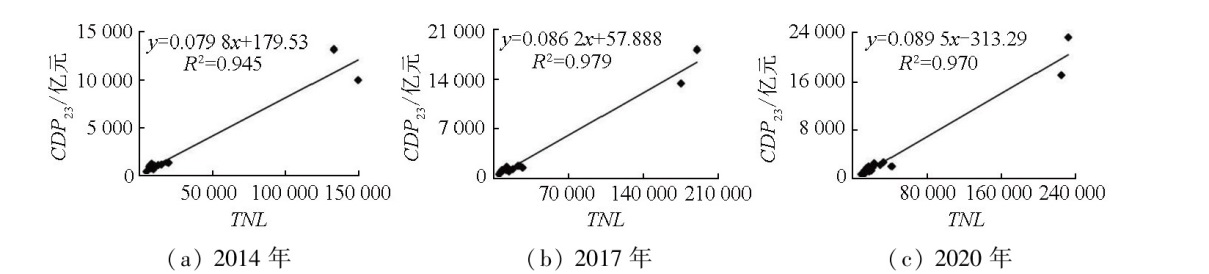
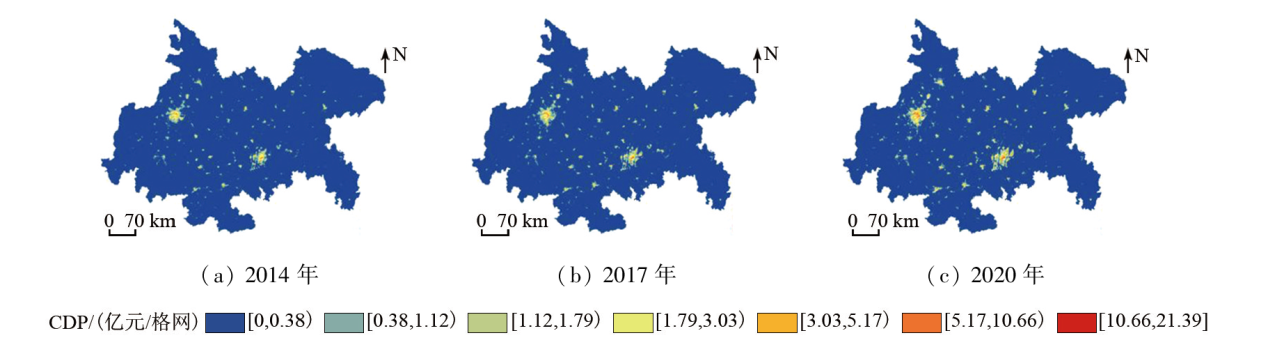
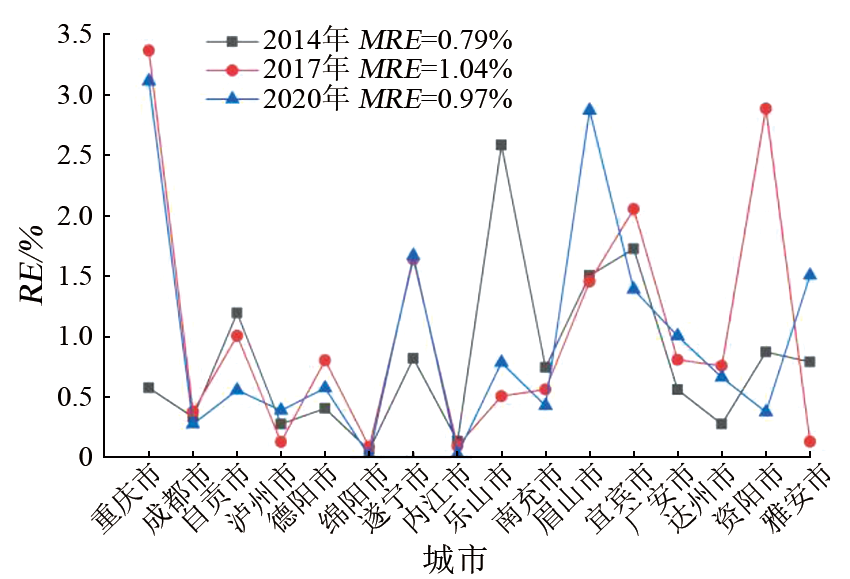
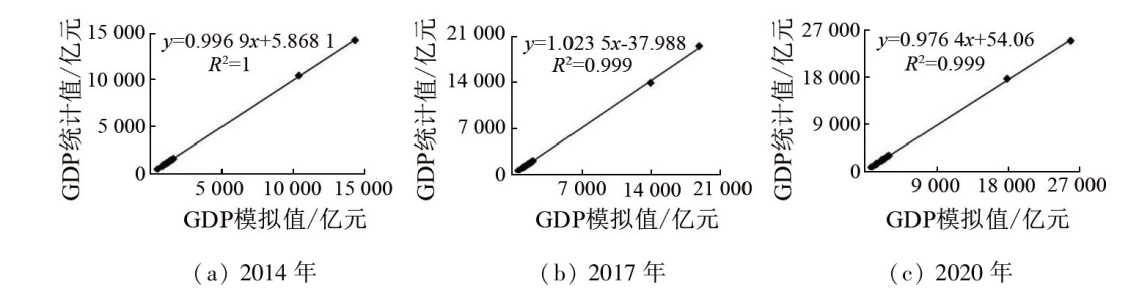
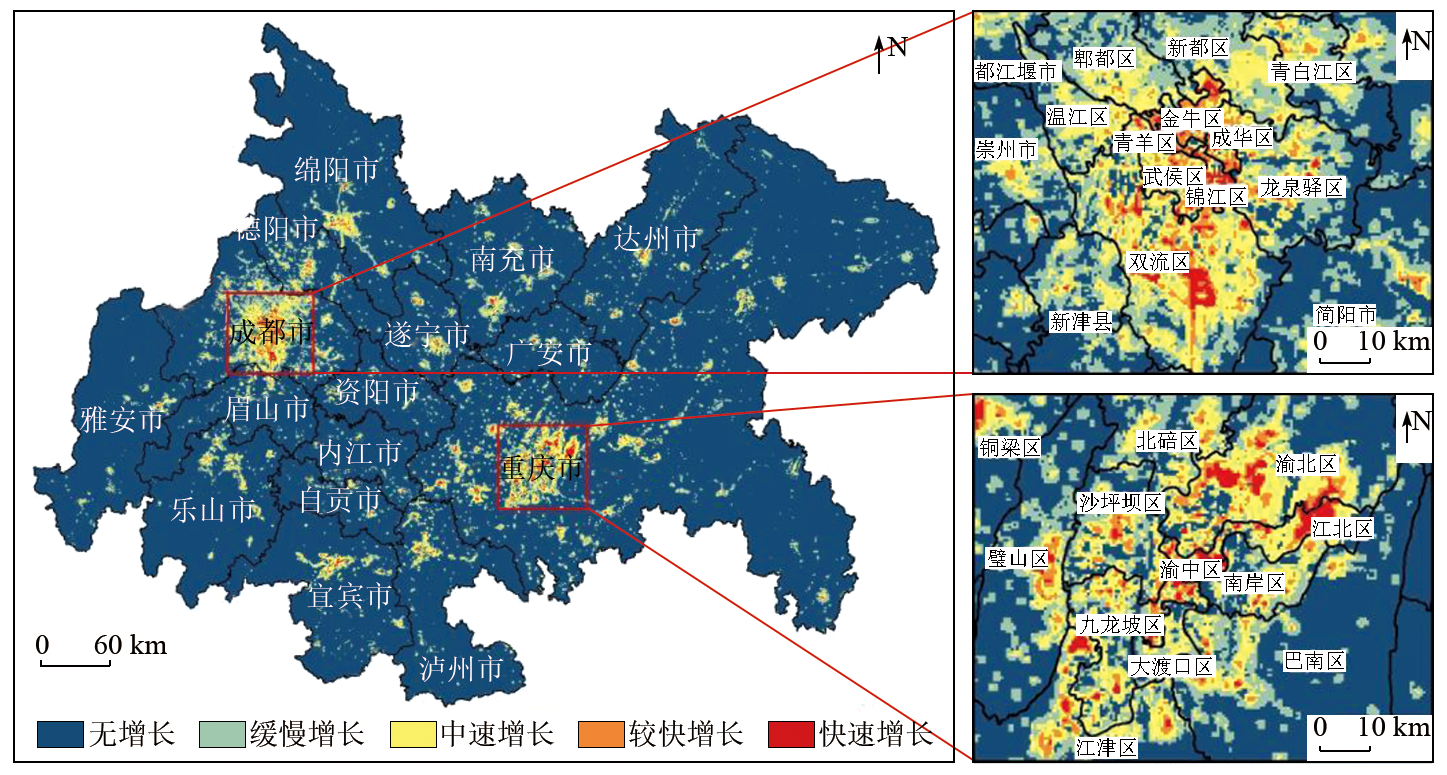
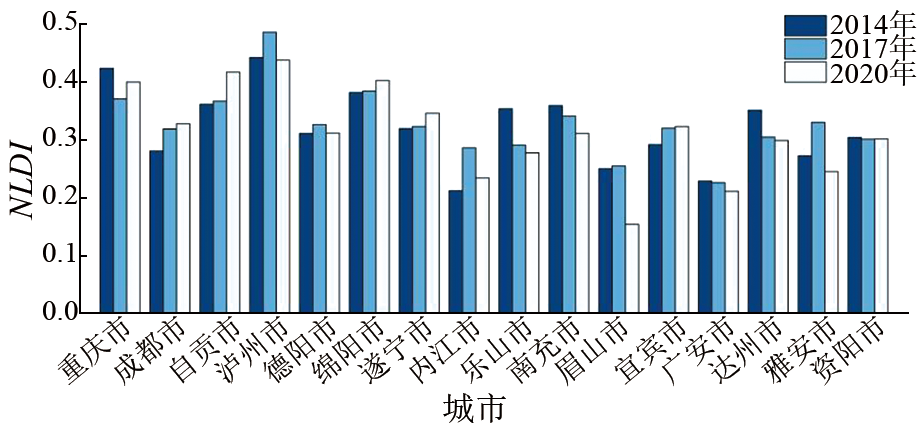
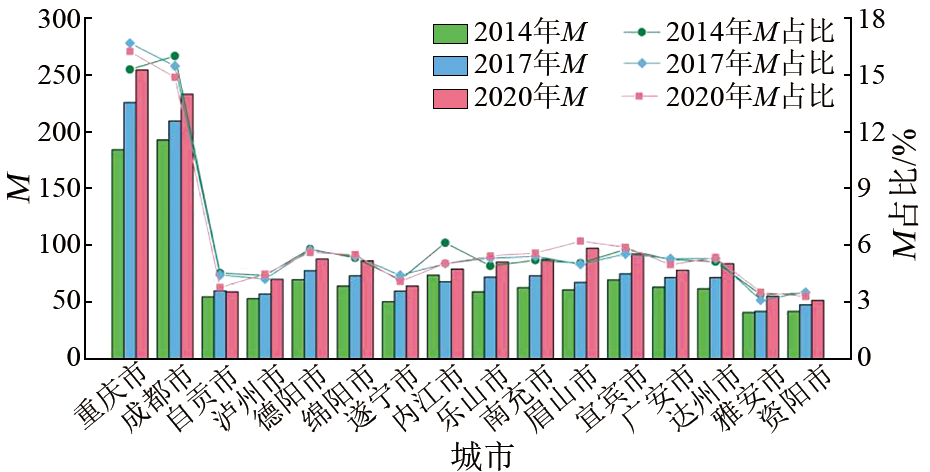
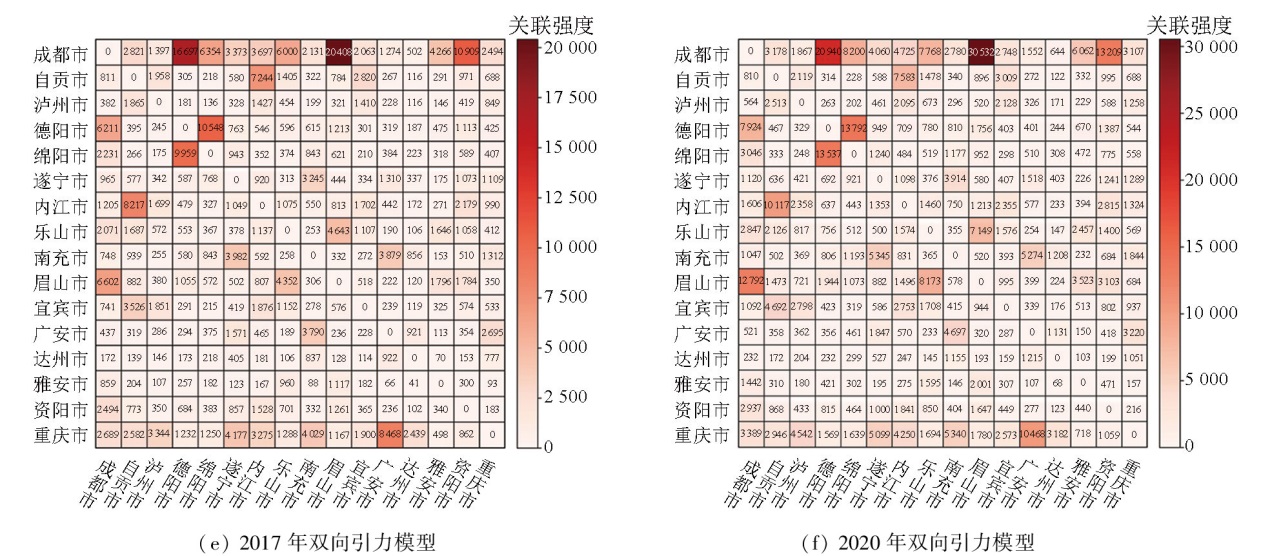
Abstract To resolve the limitations of traditional economic data such as the lack of spatial information and the difficulty in capturing the spatial disparities and dynamic patterns of regional economic development, this study integrated nighttime light data with land use and socio-economic data to develop a spatialized gross domestic product (GDP) model for the Chengdu-Chongqing region. Using trend analysis and a modified gravity model, this work analyzes the economic development characteristics of the region at the pixel level and in terms of inter-city economic relationships. The results indicate that the spatialized GDP model, constructed from multiple data sources, demonstrated high accuracy, with errors not exceeding 1.1%. The areas with the fastest GDP density growth in the Chengdu-Chongqing region are mainly concentrated around the core urban areas of Chengdu and Chongqing, accounting for approximately 73.9% of the total. These areas also show pronounced economic agglomeration characteristics. The inter-city economic relationships in the Chengdu-Chongqing region are continually strengthening, and the overall quality of urban development is steadily improving. Chengdu, in particular, has the closest economic ties with its neighboring cities. Overall, the Chengdu-Chongqing regional economy exhibits a spatial pattern of “dual-core driven development”, with the intensity of inter-city economic relationships continuing to strengthen. This study will provide valuable data support and methodological insights for promoting the high-quality economic development of the Chengdu-Chongqing urban agglomeration.
|
| Keywords
NPP/VIIRS night light data
GDP spatialization
Chengdu-Chongqing urban agglomeration
modified gravity model
economic development
|
|
|
|
Issue Date: 23 December 2024
|
|
|
| [1] |
王琪, 袁涛, 郑新奇. 基于夜间灯光数据的中国省域GDP总量分析[J]. 城市发展研究, 2013, 20(7):44-48.
|
| [1] |
Wang Q, Yuan T, Zheng X Q. GDP gross analysis at province-level in China based on night-time lightsatellite imagery[J]. Urban Development Studies, 2013, 20(7):44-48.
|
| [2] |
王旭, 吴吉东, 王海, 等. 基于夜间灯光和人口密度数据的京津冀GDP空间化对比[J]. 地球信息科学学报, 2016, 18(7):969-976.
doi: 10.3724/SP.J.1047.2016.00969
|
| [2] |
Wang X, Wu J D, Wang H, et al. Comparison of GDP spatialization in Beijing-Tianjin-Hebei based on night light and population density data[J]. Journal of Geo-Information Science, 2016, 18(7):969-976.
|
| [3] |
Zhao Z Z, Tang X J, Wang C, et al. Analysis of the spatial and temporal evolution of the GDP in Henan Province based on nighttime light data[J]. Remote Sensing, 2023, 15(3):716.
|
| [4] |
Zhang X, Gibson J. Using multi-source nighttime lights data to proxy for county-level economic activity in China from 2012 to 2019[J]. Remote Sensing, 2022, 14(5):1282.
|
| [5] |
旷开金, 郑开焰, 陈锐, 等. 基于NPP-VIIRS夜间灯光数据的福建省县域经济发展时空演化研究[J]. 地域研究与开发, 2023, 42(4):29-35.
|
| [5] |
Kuang K J, Zheng K Y, Chen R, et al. Spatio-temporal evolution of county economic development in Fujian Province based on NPP-VIIRS nighttime lighting data[J]. Areal Research and Development, 2023, 42(4):29-35.
|
| [6] |
李益敏, 傅星峰, 李媛婷, 等. 基于夜光遥感的东南亚国家经济发展时空特征研究[J]. 南京信息工程大学学报(自然科学版), 2023:1-12.
|
| [6] |
Li Y M, Fu X F, Li Y T, et al. Spatio-temporal characteristics of economic development in Southeast Asian countries based on nighttime light remote sensing[J]. Journal of Nanjing University of Information Science & Technology(Natural Science Edition), 2013:1-12.
|
| [7] |
刘杨, 李宏伟, 杨斌程, 等. 基于遥感数据和POI数据的GDP空间化研究——以北京市为例[J]. 地域研究与开发, 2021, 40(2):27-32,39.
|
| [7] |
Liu Y, Li H W, Yang B C, et al. Spatialization of GDP based on remote sensing data and POI data:A case study of Beijing City[J]. Areal Research and Development, 2021, 40(2):27-32,39.
|
| [8] |
Elvidge C D, Baugh K E, Kihn E A, et al. Relation between satellite observed visible-near infrared emissions,population,economic activity and electric power consumption[J]. International Journal of Remote Sensing, 1997, 18(6):1373-1379.
|
| [9] |
Li X, Xu H, Chen X, et al. Potential of NPP-VIIRS nighttime light imagery for modeling the regional economy of China[J]. Remote Sensing, 2013, 5(6):3057-3081.
|
| [10] |
朱永明, 贾宗雅. 城市经济高质量发展的空间联系及其特征研究——以中原城市群为例[J]. 生态经济, 2022, 38(12):82-88.
|
| [10] |
Zhu Y M, Jia Z Y. Research on the spatial connections and characteristics of high-quality economic development of cities:A case study of the central Plains urban agglomeration[J]. Ecological Economy, 2022, 38(12):82-88.
|
| [11] |
王莎, 童磊, 贺玉德. 京津冀城市群经济联系的定量测度[J]. 技术经济, 2019, 38(10):74-81.
|
| [11] |
Wang S, Tong L, He Y D. Quantitative measurement of economic linkages between Beijing-Tianjin-Hebei urban agglomeration[J]. Technology Economics, 2019, 38(10):74-81.
|
| [12] |
张志强, 熊永兰. 成渝地区双城经济圈一体化发展的思考与建议[J]. 中国西部, 2020(2):1-12.
|
| [12] |
Zhang Z Q, Xiong Y L. Strategic thoughts and suggestions of promoting the integrated development of Chengdu-Chongqing twin cities economic circle[J]. Western China, 2020(2):1-12.
|
| [13] |
伍亿真, 施开放, 余柏蒗, 等. 利用NPP-VIIRS夜间灯光遥感数据分析城市蔓延对雾霾污染的影响[J]. 武汉大学学报(信息科学版), 2021, 46(5):777-789.
|
| [13] |
Wu Y Z, Shi K F, Yu B L, et al. Analysis of the impact of urban sprawl on haze pollution based on the NPP-VIIRS nighttime light remote sensing data[J]. Geomatics and Information Science of Wuhan University, 2021, 46(5):777-789.
|
| [14] |
钟亮, 刘小生, 杨鹏. SNPP-VIIRS夜间灯光影像去噪方法研究[J]. 测绘通报, 2019(3):21-26.
doi: 10.13474/j.cnki.11-2246.2019.0071
|
| [14] |
Zhong L, Liu X S, Yang P. Method for SNPP-VIIRS nighttime lights images denoising[J]. Bulletin of Surveying and Mapping, 2019(3):21-26.
|
| [15] |
关靖云, 李东, 王亚菲, 等. 中国区域DMSP-OLS与NPP-VIIRS夜间灯光影像校正[J]. 测绘通报, 2021(9):1-8.
doi: 10.13474/j.cnki.11-2246.2021.0264
|
| [15] |
Guan J Y, Li D, Wang Y F, et al. DMSP-OLS and NPP-VIIRS night light image correction in China[J]. Bulletin of Surveying and Mapping, 2021(9):1-8.
doi: 10.13474/j.cnki.11-2246.2021.0264
|
| [16] |
Yang J, Huang X. The 30 m annual land cover dataset and its dynamics in China from 1990 to 2019[J]. Earth System Science Data, 2021, 13(8):3907-3925.
doi: 10.5194/essd-13-3907-2021
|
| [17] |
张雪红, 吴雨阳, 王永俊, 等. 基于热红外和夜间灯光遥感的GDP空间化研究——以福建省为例[J]. 南京信息工程大学学报(自然科学版), 2021, 13(6):720-729.
|
| [17] |
Zhang X H, Wu Y Y, Wang Y J, et al. GDP spatialization based on thermal infrared and night light remote sensing:A case study in Fujian Province[J]. Journal of Nanjing University of Information Science and Technology (Natural Science Edition), 2021, 13(6):720-729.
|
| [18] |
韩向娣, 周艺, 王世新, 等. 基于夜间灯光和土地利用数据的GDP空间化[J]. 遥感技术与应用, 2012, 27(3):396-405.
|
| [18] |
Han X D, Zhou Y, Wang S X, et al. GDP spatialization in China based on DMSP/OLS data and land use data[J]. Remote Sensing Technology and Application, 2012, 27(3):396-405.
|
| [19] |
陈军卫, 汪潇, 王秀丽. 基于夜间灯光数据的河南省GDP空间化研究[J]. 地域研究与开发, 2020, 39(1):28-31,45.
|
| [19] |
Chen J W, Wang X, Wang X L. Spatialization of GDP in Henan Province based on night light index[J]. Areal Research and Development, 2020, 39(1):28-31,45.
|
| [20] |
李峰, 米晓楠, 刘军, 等. 基于NPP-VIIRS夜间灯光数据的北京市GDP空间化方法[J]. 国土资源遥感, 2016, 28(3):19-24.doi:10.6046/gtzyyg.2016.03.04.
|
| [20] |
Li F, Mi X N, Liu J, et al. Spatialization of GDP in Beijing using NPP-VIIRS data[J]. Remote Sensing for Land and Resources, 2016, 28(3):19-24.doi:10.6046/gtzyyg.2016.03.04.
|
| [21] |
陈晋, 卓莉, 史培军, 等. 基于DMSP/OLS数据的中国城市化过程研究——反映区域城市化水平的灯光指数的构建[J]. 遥感学报, 2003, 7(3):168-175,241.
|
| [21] |
Chen J, Zhuo L, Shi P J, et al. The study on urbanization process in China based on DMSP/OLS data:Development of a light index for urbanization level estimation[J]. Journal of Remote Sensing, 2003, 7(3):168-175,241.
|
| [22] |
王俊华. 基于夜间灯光数据的四川省GDP空间化研究[D]. 成都: 成都理工大学, 2019.
|
| [22] |
Wang J H. GDP spatialization research of Sichuan Province based on nighttime light data[D]. Chengdu: Chengdu University of Technology, 2019.
|
| [23] |
吴燕, 李红波. 大都市城乡融合区空间演进及内在关联性测度——基于武汉市夜间灯光数据[J]. 地理科学进展, 2020, 39(1):13-23.
doi: 10.18306/dlkxjz.2020.01.002
|
| [23] |
Wu Y, Li H B. Spatial change and correlations of desakota regions in a metropolitan area using NPP/VIIRS nighttime light data:A case study of Wuhan City[J]. Progress in Geography, 2020, 39(1):13-23.
|
| [24] |
占玮, 陈朝隆, 孙武, 等. 基于多源数据的广佛都市区城市引力结构特征分析[J]. 热带地理, 2021, 41(6):1292-1302.
doi: 10.13284/j.cnki.rddl.003401
|
| [24] |
Zhan W, Chen C L, Sun W, et al. Characteristics of the urban gravity structure in the Guangzhou-foshan metropolitan area based on multi-source data[J]. Tropical Geography, 2021, 41(6):1292-1302.
doi: 10.13284/j.cnki.rddl.003401
|
| [25] |
曾佩枫, 孙美丽, 路娜, 等. 夜间灯光数据下的青岛市城乡结合区空间扩张与内在关联测度[J]. 测绘科学技术学报, 2021, 38(2):213-220.
|
| [25] |
Zeng P F, Sun M L, Lu N, et al. Spatial expansion and intrinsic correlation measure of Qingdao urban-rural integration area based on night light data[J]. Journal of Geomatics Science and Technology, 2021, 38(2):213-220.
|
| [26] |
Elvidge C D, Baugh K E, Anderson S J, et al. The Night Light Development Index (NLDI):A spatially explicit measure of human development from satellite data[J]. Social Geography, 2012, 7(1):23-35.
|
| [27] |
顾朝林, 庞海峰. 基于重力模型的中国城市体系空间联系与层域划分[J]. 地理研究, 2008, 27(1):1-12.
|
| [27] |
Gu C L, Pang H F. Study on spatial relations of Chinese urban system:Gravity Model Approach[J]. Geographical Research, 2008, 27(1):1-12.
|
| [28] |
谢金龙, 李熙, 徐慧敏. 基于夜光遥感影像的海峡西岸经济区城市发展时空格局演变分析[J]. 应用科学学报, 2021, 39(3):456-468.
|
| [28] |
Xie J L, Li X, Xu H M. Spatial-temporal evolution analysis of urban development in the western Taiwan Straits economic zone using night-time light imagery[J]. Journal of Applied Sciences, 2021, 39(3):456-468.
|
| [29] |
李月娇, 杨小唤, 王静. 基于景观生态学的人口空间数据适宜格网尺度研究——以山东省为例[J]. 地理与地理信息科学, 2014, 30(1):97-100.
|
| [29] |
Li Y J, Yang X H, Wang J. Grid size suitability of population spatial distribution in Shandong Province based on landscape ecology[J]. Geography and Geo-Information Science, 2014, 30(1):97-100.
|
|
Viewed |
|
|
|
Full text
|
|
|
|
|
Abstract
|
|
|
|
|
Cited |
|
|
|
|
| |
Shared |
|
|
|
|
| |
Discussed |
|
|
|
|
 2024,
Vol. 36
2024,
Vol. 36