|
|
 |
|

|
|
|
Research on energy consumption of Xinjiang based on DMSP/OLS night light data from 1992 to 2013 |
Xiaojing FAN1,2, Yongfu ZHANG1,2( ), Zhenzhen CHENG1,2 ), Zhenzhen CHENG1,2 |
1.School of Resources and Environment Science, Xinjiang University, Urumqi 830046, China
2.Key Laboratory of Oasis Ecology, Xinjiang University, Urumqi 830046, China |
|
|
|
|
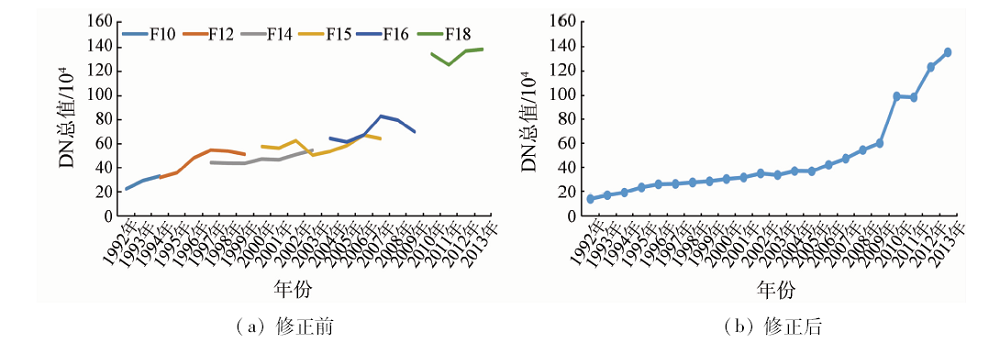
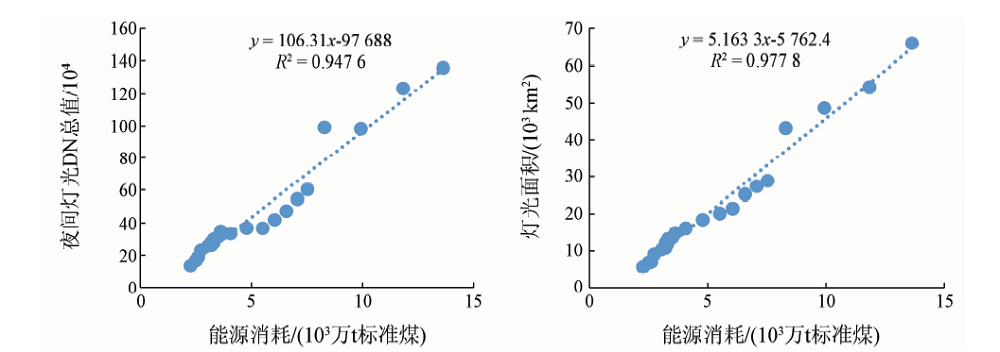
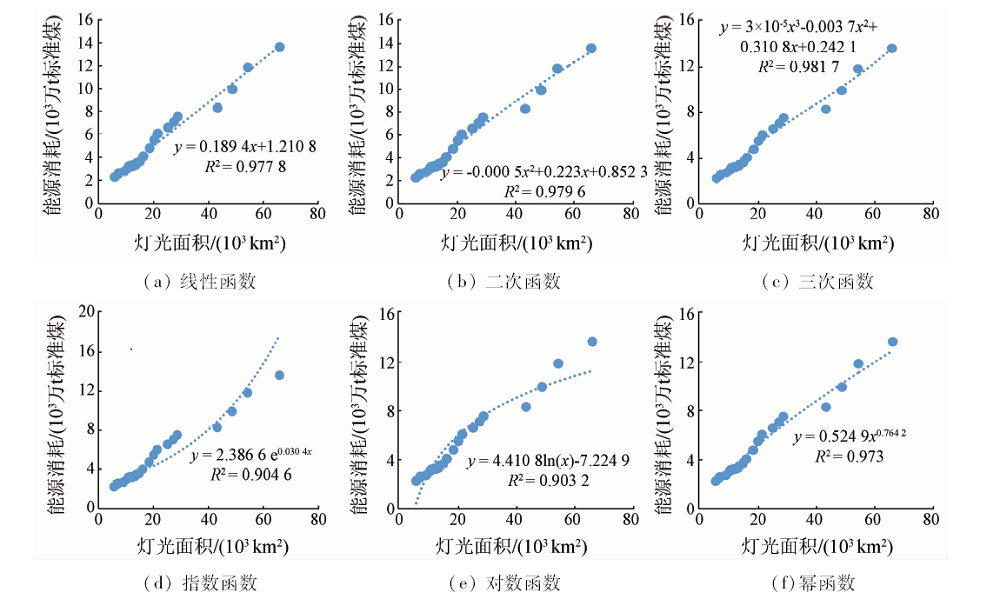
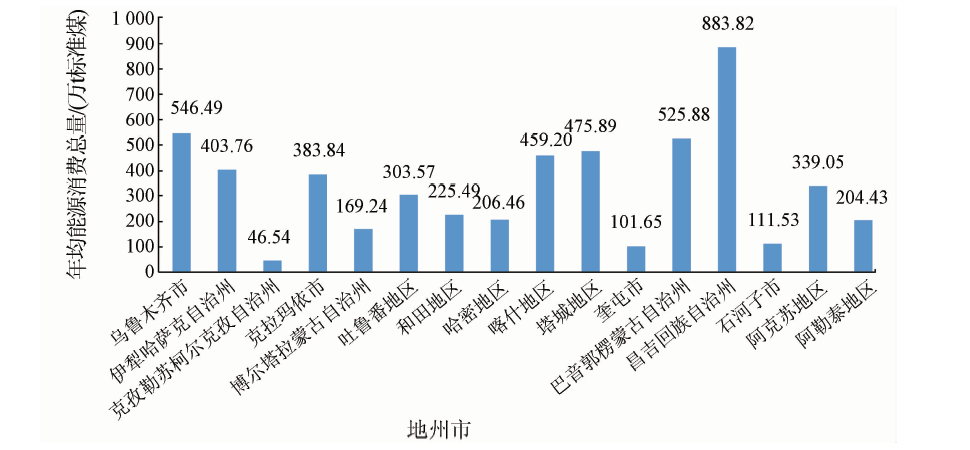
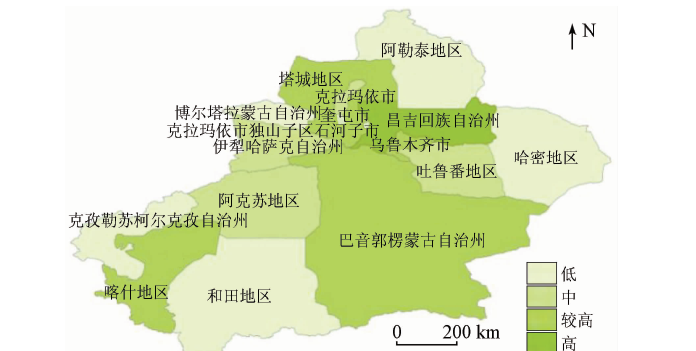
Abstract All the energy problems in different countries or regions are facing great challenges. The timely and accurate grasp of the spatial dynamic change of energy consumption can make reasonable layout to occupy the initiative, make the optimal allocation of energy structure and put forward the feasible solution. In this paper, the authors put forward the combined DMSP/OLS night light data from 1992 to 2013 and Xinjiang statistical yearbook and the application of mathematical statistics and analysis method, selected the average light intensity, DN value and light area as independent variables by using multiple regression analysis. Considering the downscaling and modifying the model, the authors made the simulation of the Xinjiang state municipal energy consumption data, and made grading of the spatial distribution difference of annual simulation data. It is found that Changji, Urumqi, Tacheng and Kashihave relatively high energy consumption level. This paper puts forward a new method for the study of dynamic energy consumption in Xinjiang.
|
| Keywords
DMSP/OLS night light data
energy consumption
regression analysis
spatialization
|
|
|
|
Corresponding Authors:
Yongfu ZHANG
E-mail: 2812164105@qq.com
|
|
Issue Date: 14 March 2019
|
|
|
| [1] |
戴彦德, 吕斌, 冯超 . "十三五"中国能源消费总量控制与节能[J]. 北京理工大学学报(社会科学版), 2015,17(1):1-7.
doi: 10.15918/j.jbitss1009-3370.2015.0101
url: http://d.wanfangdata.com.cn/Periodical/bjlgdxxb-shkxb201501001
|
| [1] |
Dai Y D, Lyu B, Feng C . China total energy consumption control and energy conservation during the 13th five-year period[J]. Journal of Beijing Institute of Technology(Social Sciences Edition), 2015,17(1):1-7.
|
| [2] |
Welch R . Monitoring urban population and energy utilization patterns from satellite data[J]. Remote sensing of Environment, 1980,9(1):1-9.
doi: 10.1016/0034-4257(80)90043-7
url: http://linkinghub.elsevier.com/retrieve/pii/0034425780900437
|
| [3] |
Elvidge C D, Baugh K E, Kihn E A , et al. Relation between satellite observed visible-near infrared emissions,population,economic activity and electric power consumption[J]. International Journal of Remote Sensing, 1997,18(6):1373-1379.
doi: 10.1080/014311697218485
url: https://www.tandfonline.com/doi/full/10.1080/014311697218485
|
| [4] |
Chand T R K, Badarinath K V S, Elvidge C D , et al. Spatial characterization of electrical power consumption patterns over India using temporal DMSP-OLS night-time satellite data[J]. International Journal of Remote Sensing, 2009,30(3):647-661.
doi: 10.1080/01431160802345685
url: https://www.tandfonline.com/doi/full/10.1080/01431160802345685
|
| [5] |
Amaral S, Câmara G , Monteiro A M V,et al.Estimating population and energy consumption in Brazilian Amazonia using DMSP night-time satellite data[J]. Computers,Environment and Urban Systems, 2005,29(2):179-195.
doi: 10.1016/j.compenvurbsys.2003.09.004
url: https://linkinghub.elsevier.com/retrieve/pii/S0198971503000966
|
| [6] |
Doll C N H . CIESIN Thematic Guide to Night-time Light Remote Sensing and Its Applications[R]. Palisades,NY:Center for International Earth Science Information Network of Columbia University, 2008.
|
| [7] |
Letu H, Hara M, Yagi H , et al. Estimating energy consumption from night-time DMPS/OLS imagery after correcting for saturation effects[J]. International Journal of Remote Sensing, 2010,31(16):4443-4458.
doi: 10.1080/01431160903277464
url: https://www.tandfonline.com/doi/full/10.1080/01431160903277464
|
| [8] |
Takashima M, Hayashi H, Kimura H, et al. Earthquake damaged area estimation using DMSP/OLS night-time imagery-application for Hanshin-Awaji Earthquake[C]// IEEE International Geoscience and Remote Sensing Symposium.Honolulu:IEEE, 2000,1:336-338.
|
| [9] |
吴健生, 牛妍, 彭建 , 等. 基于DMSP/OLS夜间灯光数据的1995—2009年中国地级市能源消费动态[J]. 地理研究, 2014,33(4):625-634.
doi: 10.11821/dlyj201404003
url: http://www.cqvip.com/qk/95732x/201404/68768974504849524852484852.html
|
| [9] |
Wu J S, Niu Y, Peng J , et al. Research on energy consumption dynamic among prefecture-level cities in China based on DMSP/OLS nighttime light[J]. Geographical Research, 2014,33(4):625-634.
|
| [10] |
李通, 何春阳, 杨洋 , 等. 1995—2008年中国大陆电力消费量时空动态[J]. 地理学报, 2011,66(10):1403-1412.
doi: 10.3724/SP.J.1011.2011.00415
url: http://www.cqvip.com/QK/90059X/201110/39741023.html
|
| [10] |
Li T, He C Y, Yang Y , et al. Understanding electricity consumption changes in Chinese mainland from 1995 to 2008 by using DMSP/OLS stable nighttime light time series data[J]. Acta Geographica Sinica, 2011,66(10):1403-1412.
|
| [11] |
吴耀文, 丁浩东, 李宛婕 , 等. 基于DMSP/OLS的湖北能源需求预测[J]. 科技视界, 2013(11):152,180.
url: http://www.cnki.com.cn/Article/CJFDTotal-KJSJ201311119.htm
|
| [11] |
Wu Y W, Ding H D, Li W J, , et al. Based on DMSP/OLS energy demand forecasting of Hubei[J]. Science and Technology Vision 2013(11):152,180.
|
| [12] |
杨续超, 康丽莉, 张斌 , 等. 基于多源遥感信息的电力消费量估算与影响因素分析——以浙江省为例[J]. 地理科学, 2013,33(6):718-723.
url: http://www.cqvip.com/QK/95809X/201306/46924922.html
|
| [12] |
Yang X C, Kang L L, Zhang B , et al. Electricity consumption estimation using multi-sensor remote sensing data:A case study of Zhejiang Province[J]. Scientia Geographica Sinica, 2013,33(6):718-723.
|
| [13] |
Zhao N, Ghosh T, Samson E L . Mapping spatio-temporal changes of Chinese electric power consumption using night-time imagery[J]. International Journal of Remote Sensing, 2012,33(20):6304-6320.
doi: 10.1080/01431161.2012.684076
url: https://www.tandfonline.com/doi/full/10.1080/01431161.2012.684076
|
| [14] |
苏泳娴, 陈修治, 叶玉瑶 , 等. 基于夜间灯光数据的中国能源消费碳排放特征及机理[J]. 地理学报, 2013,68(11):1513-1526.
doi: 10.11821/dlxb201311007
url: http://www.cnki.com.cn/Article/CJFDTotal-DLXB201311009.htm
|
| [14] |
Su Y X, Chen X Z, Ye Y Y , et al. The characteristics and mechanisms of carbon emissions from energy consumption in China using DMSP/OLS night light imageries[J]. Acta Geographica Sinica, 2013,68(11):1513-1526.
|
| [15] |
王琪, 袁涛, 郑新奇 . 基于夜间灯光数据的中国省域GDP总量分析[J]. 城市发展研究, 2013,20(7):44-48.
doi: 10.3969/j.issn.1006-3862.2013.07.007
url: http://d.wanfangdata.com.cn/Periodical_csfzyj201307007.aspx
|
| [15] |
Wang Q, Yuan T, Zheng X Q . GDP gross analysis at province-level in China based on night-time light satellite imagery[J]. Urban Development Studies, 2013,20(7):44-48.
|
| [16] |
吴健生, 许娜, 张曦文 . 中国低碳城市评价与空间格局分析[J]. 地理科学进展, 2016,35(2):204-213.
doi: 10.18306/dlkxjz.2016.02.007
url: http://www.cnki.com.cn/Article/CJFDTotal-DLKJ201602007.htm
|
| [16] |
Wu J S, Xu N, Zhang X W . Evaluation of low-carbon city and spatial pattern analysis in China[J]. Progress in Geography, 2016,35(2):204-213.
|
| [17] |
邹进贵, 陈艳华, 田径 , 等. 基于ArcGIS的DMSP/OLS夜间灯光影像校正模型的构建[J]. 测绘地理信息, 2014,39(4):33-37.
url: http://www.cqvip.com/QK/93326B/201404/661599145.html
|
| [17] |
Zou J G, Chen Y H, Tian J , et al. Construction of the calibration model for DMSP/OLS nighttime light images based on ArcGIS[J]. Journal of Geomatics, 2014,39(4):33-37.
|
| [18] |
任宇飞, 方创琳 . 京津冀城市群县域尺度生态效率评价及空间格局分析[J]. 地理科学进展, 2017,36(1):87-98.
doi: 10.18306/dlkxjz.2017.01.009
url: http://www.cnki.com.cn/Article/CJFDTotal-DLKJ201701010.htm
|
| [18] |
Ren Y F, Fang C L . Spatial pattern and evaluation of eco-efficiency in counties of the Beijing-Tianjin-Hebei Urban Agglomeration[J]. Progress in Geography, 2017,36(1):87-98.
|
| [19] |
孙伟, 金晓斌, 张志宏 , 等. 中国主要城市群新增制造业用地特征及城镇体系耦合分析[J]. 地理科学进展, 2016,35(12):1483-1493.
doi: 10.18306/dlkxjz.2016.12.005
url: http://www.cnki.com.cn/Article/CJFDTotal-DLKJ201612005.htm
|
| [19] |
Sun W, Jin X B, Zhang Z H , et al. Characteristics of new manufacturing land and coupling analysis with urban system in Chinese major urban agglomerations[J]. Progress in Geography, 2016,35(12):1483-1493.
|
| [20] |
李双双, 杨赛霓, 刘宪锋 . 1960—2013年秦岭—淮河南北极端降水时空变化特征及其影响因素[J]. 地理科学进展, 2015,34(3):354-363.
doi: 10.11820/dlkxjz.2015.03.010
url: http://www.cqvip.com/QK/96015A/201503/1005686308.html
|
| [20] |
Li S S, Yang S N, Liu X F . Spatiotemporal variability of extreme precipitation in north and south of the Qinling—Huaihe region and influencing factors during 1960—2013[J]. Progress in Geography, 2015,34(3):354-363.
|
| [21] |
刘璐 . 基于夜间灯光数据的城市群蔓延指标[J]. 国土资源遥感, 2018,30(2):208-213.doi: 10.6046/gtzyyg.2018.02.28.
url: http://www.cnki.com.cn/Article/CJFDTotal-GTYG201802028.htm
|
| [21] |
Liu L . Urban sprawl metrics based on night-time light data for metropolitan areas[J]. Remote Sensing for Land and Resources, 2018,30(2):208-213.doi: 10.6046/gtzyyg.2018.02.28.
|
| [22] |
刘佳, 辛鑫, 刘斌 , 等. 基于DMSP/OLS夜间灯光影像的2000—2013年鄂尔多斯市城市扩张遥感制图与驱动因子分析[J]. 国土资源遥感, 2018,30(1):166-172.doi: 10.6046/gtzyyg.2018.01.23.
doi: 10.6046/gtzyyg.2018.01.23
url: http://www.cnki.com.cn/Article/CJFDTotal-GTYG201801023.htm
|
| [22] |
Liu J, Xin X, Liu B , et al. Urban expansion mapping and driving factor analysis of Ordos City during the period of 2000—2013 based on DMSP/OLS nighttime light data[J]. Remote Sensing for Land and Resources, 2018,30(1):166-172.doi: 10.6046/gtzyyg.2018.01.23.
|
| [23] |
李宗光, 胡德勇, 李吉贺 , 等. 基于夜间灯光数据的连片特困区GDP估算及其空间化[J]. 国土资源遥感, 2016,28(2):168-174.doi: 10.6046/gtzyyg.2016.02.26.
doi: 10.6046/gtzyyg.2016.02.26
url: http://www.cnki.com.cn/Article/CJFDTotal-GTYG201602028.htm
|
| [23] |
Li Z G, Hu D Y, Li J H , et al. Simulation and spatialization of GDP in poverty areas based on night light imagery[J]. Remote Sensing for Land and Resources, 2016,28(2):168-174.doi: 10.6046/gtzyyg.2016.02.26.
|
|
Viewed |
|
|
|
Full text
|
|
|
|
|
Abstract
|
|
|
|
|
Cited |
|
|
|
|
| |
Shared |
|
|
|
|
| |
Discussed |
|
|
|
|
 2019,
Vol. 31
2019,
Vol. 31