|
|
 |
|

|
|
|
Regression analysis of MODIS aerosol optical thickness and air quality index in Xiamen City |
| Yiqiang SHI1,2, Qiuqin DENG1, Jun WU1, Jian WANG3 |
1. Department of Geographic Sciences of School of Science, Jimei University, Xiamen 361021, China
2. Research Center of Remote Sensing and Geo-Information, Jimei University, Xiamen 361021, China
3. Xiamen Environmental Monitoring Central Station, Xiamen 361012, China |
|
|
|
|
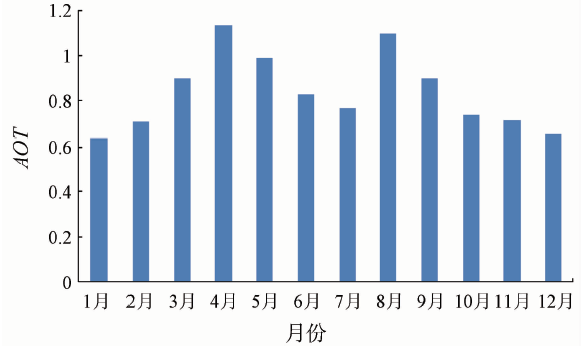
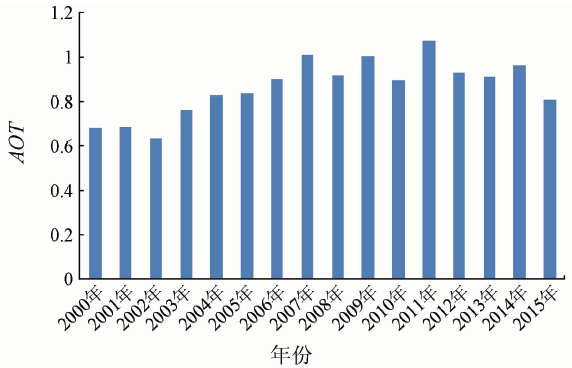
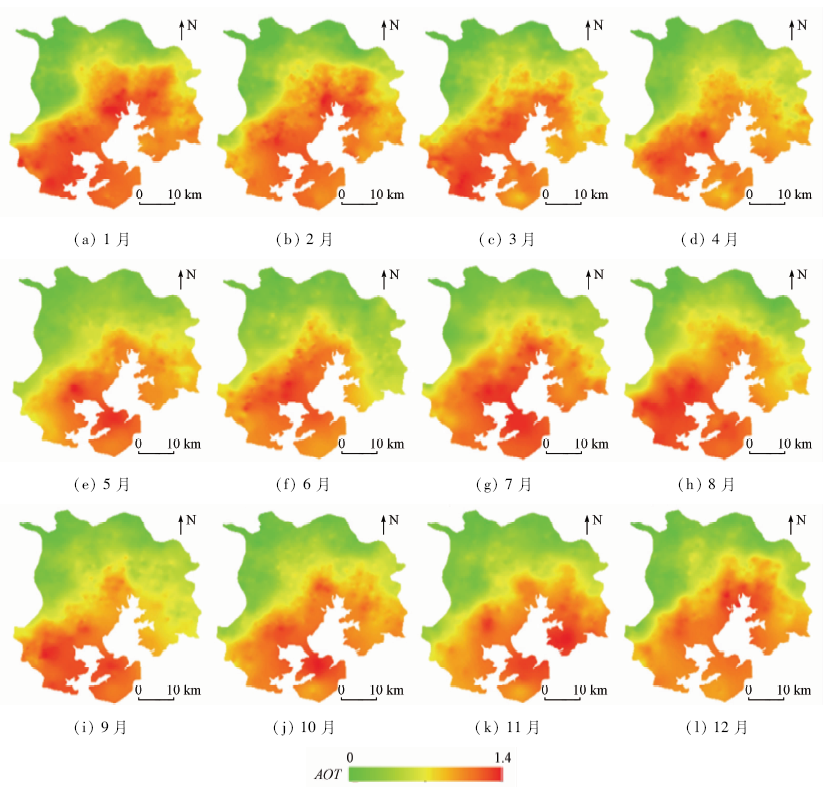
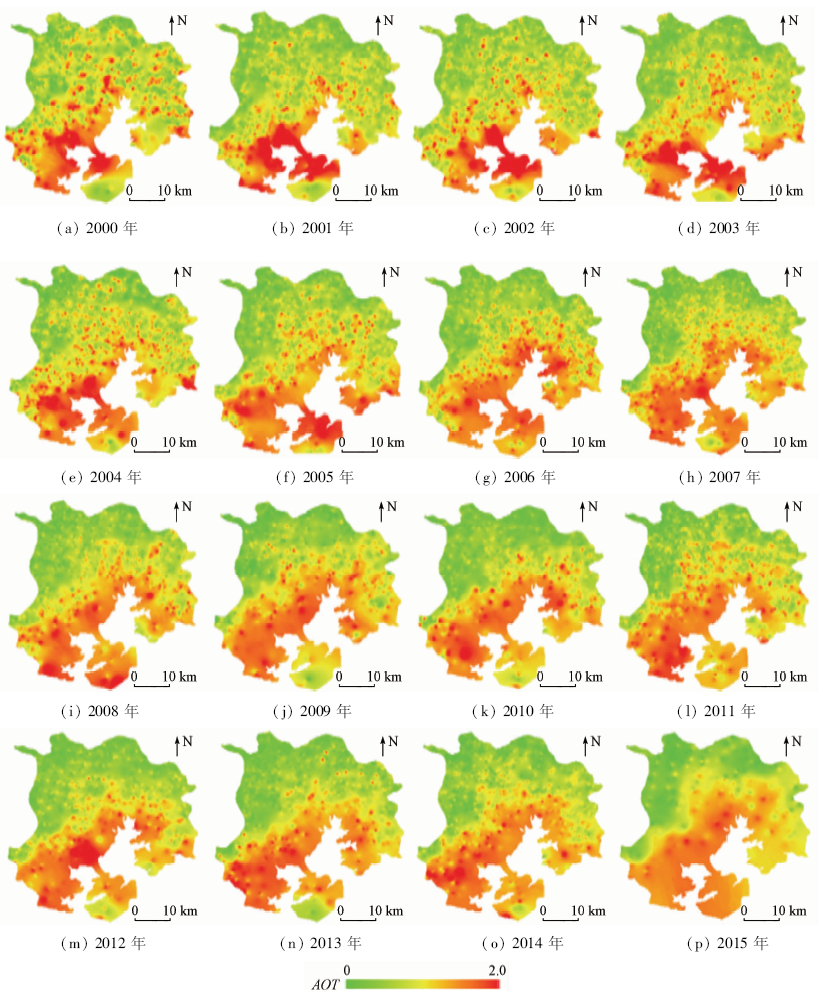
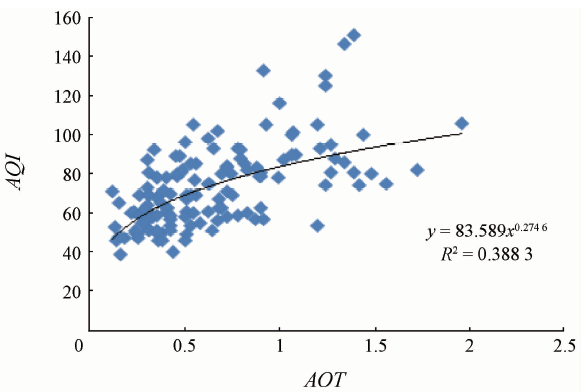
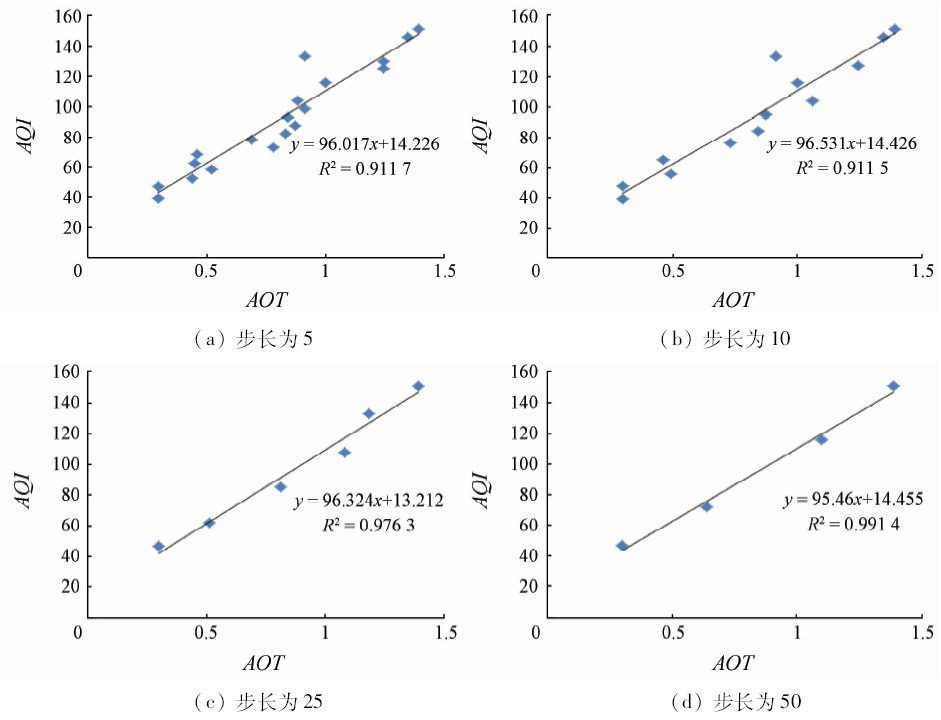
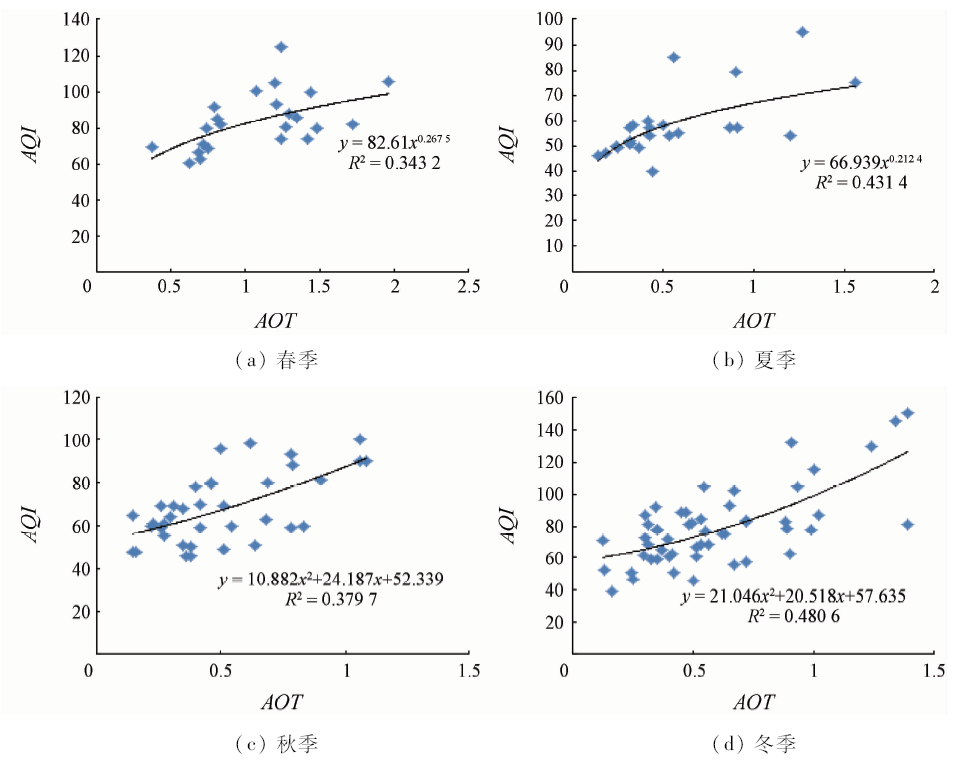
Abstract Based on MODIS product and the pollution concentration measured near the ground, the authors analyzed the spatio-temporal characteristics of aerosol optical thickness (AOT) and the regression on AOT and air quality index (AQI) by different lengths and seasons in Xiamen City, by using geographic information system (GIS) technology and statistical regression method. The results showed that there was a distinct change in the spatio-temporal characteristics of AOT from 2000 to 2015; for example, the AOT highest monthly average 1.13 appeared in April and the lowest 0.64 appeared in January, AOT seasonal average tended to decrease from spring through summer and autumn to winter, and its yearly average showed a steady trend of slow rise. The higher values of monthly and annual average AOT were almost distributed in the coastal areas and the lower values occur in northwest and northeast regions. R 2 of regression model of power function for AQI and AOT was the highest in the five regression models with its value being 0.388 3. AQI was divided into groups with a certain step length, and the regression model with AQI and AOT was built up, which exhibited larger step length and higher R 2. According to AQI grading length 50, the precision of the forecasting AQI value and the actual value could reach 77.35%, which could on the whole meet the demand of air quality level forecast. R 2 and the precision of the four-season regression models were a little higher than those of the full year regression models, and the R 2 was the lowest in spring season, R 2in other three seasons is almost the same, with the precision up to 83.33%. With the present remote sensing technology for air pollution monitoring, the utilization of the correlation models to estimate the level of air quality seems to be feasible.
|
| Keywords
AQI
MODIS AOT
GIS
step length
regression analysis
Xiamen City
|
|
|
|
Issue Date: 14 March 2020
|
|
|
| [1] |
陈辉, 厉青, 王中挺 , 等. 利用MODIS资料监测京津冀地区近地面PM2.5方法研究[J]. 气象与环境学报, 2014,30(5):27-37.
|
| [1] |
Chen H, Li Q, Wang Z T , et al. Study on monitoring surface PM2.5 concentration in Jing-Jin-Ji regions using MODIS data[J]. Journal of Meteorology and Environment, 2014,30(5):27-37.
|
| [2] |
高大伟, 徐宏辉, 郁珍艳 , 等. MODIS气溶胶光学厚度在临安大气颗粒物监测中的应用[J]. 环境科学研究, 2012,25(7):739-744.
|
| [2] |
Gao D W, Xu H H, Yu Z Y , et al. Application of MODIS aerosol optical depth in monitoring PM10 concentrations in Lin’an[J]. Research of Environmental Sciences, 2012,25(7):739-744.
|
| [3] |
张晖, 王伯铎, 陈良富 , 等. 西安市及周边地区MODIS气溶胶光学厚度与PM10浓度关系模型研究[J]. 环境工程学报, 2014,8(2):665-671.
|
| [3] |
Zhang H, Wang B D, Chen L F , et al. A study of relationship between MODIS aerosol optical depth and PM10 concentration over Xi’an[J]. Journal of Environmental Engineering, 2014,8(2):665-671.
|
| [4] |
刘显通, 李菲, 谭号波 , 等. 基于卫星遥感资料监测地面细颗粒物的敏感性分析[J]. 中国环境科学, 2014,34(7):1649-1659.
|
| [4] |
Liu X T, Li F, Tan H B , et al. Analysis of sensitivity of monitored ground PM2.5 concentrations based on satellite remote sensing data[J]. China Environmental Science, 2014,34(7):1649-1659.
|
| [5] |
王皓, 查勇 . MODIS气溶胶光学厚度对城市空气质量的指示[J]. 城市环境与城市生态, 2006,19(3):21-24.
|
| [5] |
Wang H, Zha Y . Urban air quality by MODIS AOT products[J]. Urban Environment and Urban Ecology, 2006,19(3):21-24.
|
| [6] |
Zheng S, Cao C X, Singh R P . Comparison of ground based indices (API and AQI) with satellite based aerosl products[J]. Science of the Total Environment, 2014(488-489):398-412.
|
| [7] |
潘本锋, 李莉娜 . 环境空气质量指数计算方法与分级方案比较[J]. 中国环境监测, 2016,32(1):13-17.
|
| [7] |
Pan B F, Li L N . Comparision of the calculation method and classifying program of air quality index among some countries[J]. Environmental Monitoring in China, 2016,32(1):13-17.
|
| [8] |
刘希, 胡秀清 . 厦门海域大气气溶胶光学厚度地基观测分析及卫星遥感检验[J]. 热带海洋学报, 2011,30(4):38-43
|
| [8] |
Liu X, Hu X Q . Ground-based measurements of the aerosol optical thickness at Xiamen sea and satellite remote sensing test[J]. Journal of Tropical Oceangraphy, 2011,30(4):38-43.
|
| [9] |
赵颜创, 赵小锋, 刘乐乐 , 等. 厦门市林地与建设用地对大气气溶胶空间分布的影响分析[J]. 地球信息科学学报, 2016,18(12):1653-1659.
|
| [9] |
Zhao Y C, Zhao X F, Liu L L . Impacts of the forests and built-up areas on the spatial distribution of aerosol in Xiamen City[J]. Journal of Geo-Informantion Science, 2016,18(12):1653-1659.
|
| [10] |
张春桂, 彭云峰, 林晶 , 等. 福建三大城市群气溶胶遥感监测及时空变化分析[J]. 气象, 2010,36(8):92-99.
|
| [10] |
Zhang C G, Peng Y F, Lin J , et al. Remote sensing retrieval and spatio-temporal analysis of aerosol over three cities of Fujian[J]. Meteorological Monthly, 2010,36(8):92-99.
|
| [11] |
肖建能, 杜国明, 施益强 , 等. 厦门市环境空气污染时空特征及其与气象因素相关分析[J]. 环境科学学报, 2016,36(9):3363-3371.
|
| [11] |
Xiao J N, Du G M, Shi Y Q , et al. Spatiotemporal distribution pattern of ambient air pollution and its correlation with meteorological factors in Xiamen City[J]. Acta Scientiae Circumstantiae, 2016,36(9):3363-3371.
|
| [12] |
石勇 . 武汉市MODIS气溶胶光学厚度与空气PM10浓度的关系研究[D]. 武汉:华中农业大学, 2012.
|
| [12] |
Shi Y . Study on the Correlation Between MODIS AOD and Concentration of PM10 Pollutants in Wuhan[D]. Wuhan:Huazhong Agricultural University, 2012.
|
| [13] |
王盈晓 . 基于MODIS数据的武汉市地表温度与空气污染关系研究[D]. 武汉:华中师范大学, 2016.
|
| [13] |
Wang Y X . Study on the Correlation Between Land Surface Temperature and Air Pollution Basic on MODIS Data in Wuhan[D]. Wuhan:Central China Normal University, 2016.
|
| [14] |
徐建辉, 江洪, 肖钟湧 . 长江三角洲PM10质量浓度遥感估算与时空分布特征[J]. 环境工程学报, 2016,10(3):1349-1358.
|
| [14] |
Xu J H, Jiang H, Xiao Z Y . Estimate PM10 concentration over the Yangtze Delta using remote sensing:Analysis of spatial and temporal variations[J]. Journal of Environmental Engineering, 2016,10(3):1349-1358.
|
| [15] |
李成才, 毛节泰, 刘启汉 , 等. MODIS卫星遥感气溶胶产品在北京市大气污染研究中的应用[J]. 中国科学(地球科学), 2005,35(s1):177-186.
|
| [15] |
Li C C, Mao J T, Liu Q H , et al. Application of MODIS aerosol products air pollution research in Beijing[J]. Science in China (Earth Science), 2005,35(s1):177-186.
|
| [16] |
李薛, 龚绍琦, 付东洋 , 等. 上海市PM10浓度四季遥感模型研究[J]. 大气科学学报, 2016,29(1) 126-132.
|
| [16] |
Li X, Gong S Q, Fu D Y , et al. Study on the four-season remote sensing models of PM10 concentration in Shanghai[J]. Transactions of Atmospheric Sciences, 2016,29(1) 126-132.
|
| [17] |
林长城, 王宏, 陈彬彬 , 等. 厦门市空气质量时空分布特征及其与气象条件的关系[J]. 福建农林大学学报(自然科学版), 2010,39(1):79-83.
|
| [17] |
Lin C C, Wang H, Chen B B , et al. The temporal and spatial distribution of air quality and the relation with meteorological conditions in Xiamen City[J]. Journal of Fujian Agriculture and Forestry University(Natural Science Edition), 2010,39(1):79-83.
|
|
Viewed |
|
|
|
Full text
|
|
|
|
|
Abstract
|
|
|
|
|
Cited |
|
|
|
|
| |
Shared |
|
|
|
|
| |
Discussed |
|
|
|
|
 2020,
Vol. 32
2020,
Vol. 32