

0 引言
水稻是世界三大粮食作物之一,为我国一半以上的人口提供粮食来源。种类和种植方式的不同导致水稻长势、产量存在一定差异,传统的水稻制图(区分水稻和非水稻)已经难以满足高精度农业应用的需求。因此实现水稻精细制图,区分不同水稻品种与种植方式,为水稻长势监测提供更精准的信息,对于现代农业的发展具有重要意义。
紧致极化SAR(compact polarimetry synthetic aperture Radar,CP-SAR)降低了系统复杂度与能耗,缩小了传感器体积,已成为新一代对地观测SAR系统的重要发展趋势之一[1]。与全极化SAR相比,CP-SAR不仅能够保持丰富的极化信息,还能实现更大的幅宽与入射角范围。近年来,CP-SAR相关研究主要集中在3方面: ①CP-SAR系统接发模式研究[2,3]; ②CP-SAR模拟与伪极化(pseudo-quad-pol,PQ)SAR重建方法研究[4,5]; ③CP-SAR应用研究,如信息提取[6]、作物分类[7]、森林参数反演[8]、海冰和溢油[9,10]等。虽然目前基于CP-SAR的应用研究覆盖面很广,但还不够深入,以农业应用为例,大多数研究都集中在简单的作物制图上,对于种植方式和种类的区分研究很少。
目前SAR水稻制图方法主要依据有3类: ①后向散射特性的时相变化规律[11,12]; ②不同极化后向散射特性的差异[13]; ③全极化散射机理特点[14,15]。前2类方法都只利用后向散射强度信息,不包含雷达回波的相位信息。第3类方法精度高,普适性较强,对数据时相的要求也较低。虽然全极化SAR在水稻制图中具有较大优势,但全极化系统的脉冲重复频率是单双极化的2倍,相应的幅宽也小,限制了大范围水稻制图的应用。因此,在同时兼顾制图精度与面积的情况下,CP-SAR是最佳选择之一。2013年,Brisco等[16]基于CP-SAR开展水稻制图研究,对比分析了单双极化、CP-SAR与全极化SAR的制图效果,结果表明CP-SAR在水稻制图中的应用效果可与全极化相媲美,远优于单、双极化数据; 2015年,Uppala等[17]基于RISAT-1卫星CP-SAR数据利用监督分类进行水稻识别,得到了较高的制图精度。这些研究表明了CP-SAR在水稻制图中的应用潜力,但集中于区分水稻和非水稻,对于水稻种类以及种植方式的区分研究不足。
鉴于此,以江苏金湖地区为研究区,开展CP-SAR水稻精细制图方法研究。针对插秧籼稻/粳稻、撒播粳稻3类水稻田,考虑水稻植株分布特征、生理结构特点以及下垫面的影响,研究分析其CP-SAR响应特征以及时相变化规律,在此基础上,针对CP-SAR多维特征信息,引入基于支持向量机和序列前进搜寻(support vector machine and sequential forward selection,SVM + SFS)[18]策略的特征选择方法,构建基于决策树和SVM的水稻精细分类方法。
1 研究区概况与数据源
研究区位于江苏金湖(E118°41'34″~119°16'27″,N33°17'05″~33°56'39″),属于亚热带季风气候区,地势平坦,地块规则。该区水稻一年一熟(6—11月)。水稻种类为籼稻和粳稻,播种方式分为插秧和撒播,故水稻田可分为插秧籼稻田(TH)、撒播籼稻田、插秧粳稻田(TJ)和撒播粳稻田(DJ)4类。由于该区几乎没有撒播籼稻田,因此主要针对TH,TJ和DJ这3类(图1),开展精细制图方法研究。
图1
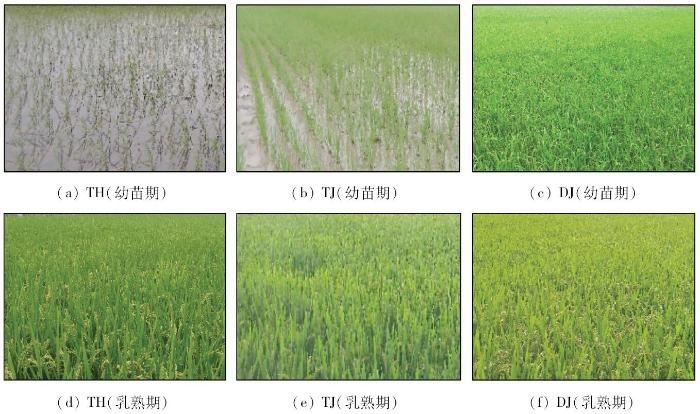
图1
3类水稻在不同物候期的特征
Fig.1
Three kinds of paddy land characteristics in different phonological stages
在研究区获取了9景RADARSAT-2精细全极化SAR数据,方位向和距离向空间分辨率分别为5.2 m和7.6 m。由于封行之前3类水稻田差异相对较大,因此,选择对应时段的SAR数据进行水稻精细分类方法研究,获取日期分别为2012年6月27日、7月11日和7月21日。首先基于3个时相的全极化SAR数据模拟CP-SAR数据。模拟数据为圆周极化发射线性极化接受模式(circular transimit and linear receive,CTLR),发射右旋圆(R)极化、接收水平(H)和垂直(V)极化[19],空间分辨率为30 m,噪声水平为-25 dB(图2)。获取SAR数据的同时,开展了地面实验,采集了水稻种类、种植方式和物候等信息,并利用高精度GPS获取了41块水稻样田的矢量数据,其中包括24块TH、6块TJ、11块DJ,还选择了8块水体和10块城镇建筑。
图2
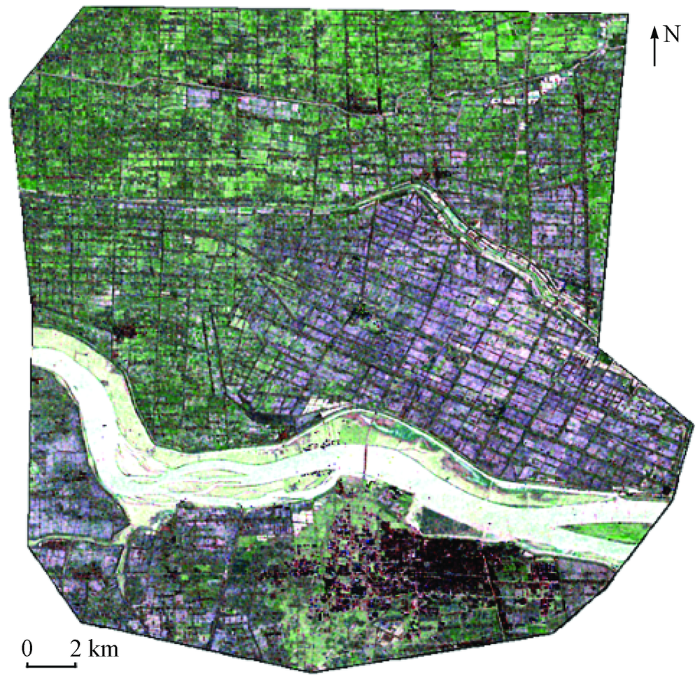
图2
CP-SAR模拟数据在不同极化通道的假彩色合成影像
(CP-SAR RR(R),RV(G),RH(B)假彩色合成)
Fig.2
Color synthetic images of CP-SAR data in different polarization channels
2 研究方法
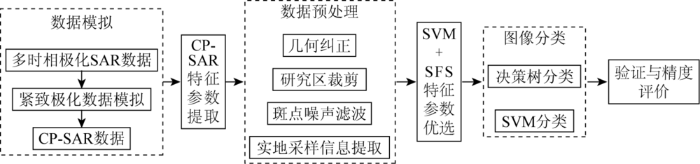
研究流程主要包括CP-SAR数据模拟与特征参数提取、数据预处理、基于SVM + SFS的CP-SAR特征参数优选以及基于优选特征利用决策树和SVM方法进行水稻田精细分类,具体技术流程如图3所示。
图3
2.1 数据预处理
基于CP-SAR模拟数据,根据特征参数定义,提取22个CP特征参数(表1)。然后对特征参数进行辐射定标、几何纠正、研究区裁剪和斑点噪声滤波等预处理。通过比较选择Frost滤波方法,以7×7窗口进行降噪处理。在此基础上,基于地面样方,提取不同类型水稻田、水体和城镇建筑的CP-SAR特征参数。
表1 提取的22个CP特征参数
Tab.1
| 符号 | 参数名称 | 参数物理意义 | 公式 | |||
|---|---|---|---|---|---|---|
| Stokes矢量 | 表征散射回波强度和极化状态 | 文献[19]公式2 | ||||
| RH,RV,RL,RR极化后向散射系数 | 表征目标在RH,RV,RL,RR极化的回波强度 | |||||
| RH和RV相位角 | RH和RV极化散射回波之间的相对相位角 | |||||
| 表征地物二次散射、体散射和面散射 | 文献[20]公式7 | |||||
| 表征地物二次散射、体散射和面散射 | 文献[19]公式5 | |||||
| 圆极化比 | Stokes向量派生参数 | |||||
| 一致性系数 | 与目标散射机理有关 | 表示取复数的虚部; <>表示内积运算; *表示 复共轭 | ||||
| 极化度 | 表征目标散射回波去相关程度 | |||||
| RH-RV相关系数 | 表征散射矩阵元素 | |||||
| 平均散射角 | 与目标散射机理有关 | |||||
| 香农熵 | 表征相干矩阵的强度 | |||||
| 符号 | 参数名称 | 参数物理意义 | 公式 | |||
| 香农极化度 | 表征Bakarat( 式中 | |||||
2.2 SVM + SFS策略特征选择方法
为了充分挖掘CP-SAR多维特征信息,同时保证分类方法的简洁性,引入基于SVM + SFS的特征选择方法,对22个CP-SAR参数进行优选。把每一特征参数看作由一个向量和一个标记组成,即
式中:
式中:
引入Lagrange算子
式中
以区分3种水稻田为目的,利用SVM+SFS特征选择方法步骤如下: ①原始特征集
除了3类水稻田的最优特征,利用上述方法还选出了区分水稻与非水稻的最优特征。
2.3 3类水稻田CP-SAR响应规律
表2 利用SVM + SFS方法优选的CP-SAR特征参数
Tab.2
| 影像日期 | CP-SAR特征参数 |
|---|---|
| 2012年6月27日 | |
| 2012年7月11日 | |
| 2012年7月21日 |
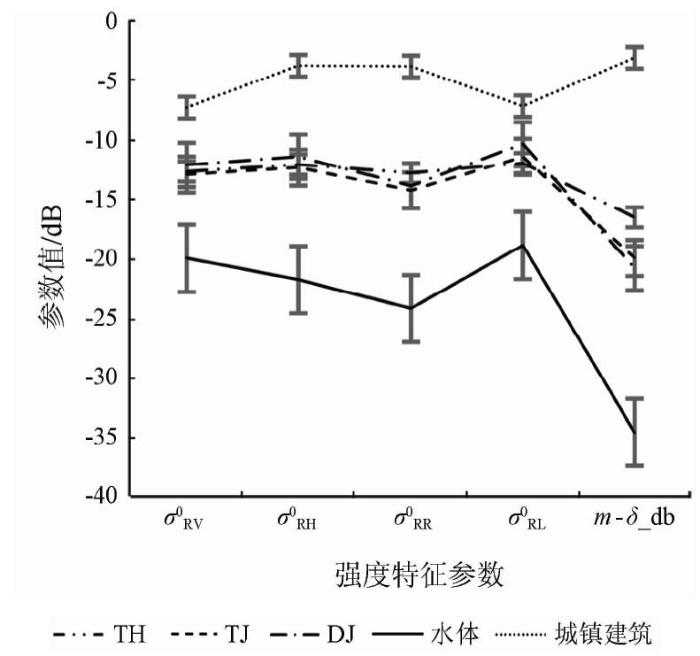
图4
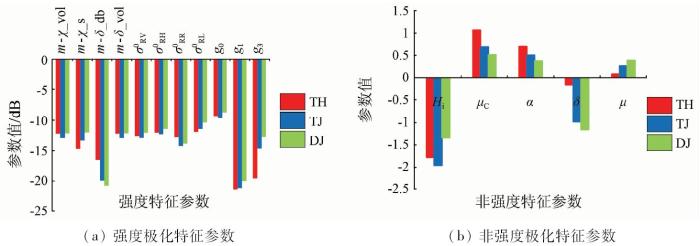
图4
3种水稻强度和非强度极化特征参数
Fig.4
Intensity and non-intensity polarization characteristic parameters about three kinds of paddy land
相对于TH和TJ,DJ水稻植株密度更大,因此其后向散射和体散射都比较大; 而TH和TJ的下垫面为水面,引起镜面反射使其后向散射和体散射较小,这导致DJ与TH,TJ的后向散射和体散射差异较大。由于
2.4 基于CP-SAR优选特征的水稻精细分类
基于SVM + SFS方法优选CP-SAR特征,分别采用决策树和SVM方法进行水稻精细分类。另外,将3类水稻田、城镇建筑和水体样方分为训练和验证样本2部分,TH、水体和城镇建筑的训练和验证样本各占一半,二者之间没有重叠。由于TJ和DJ的样本数较少,训练和验证样本之间约有30%的重叠。
2.4.1 决策树分类
首先利用CP-SAR优选特征区分水稻与非水稻,再进行3类水稻田的区分,最终实现精细分类,决策树分类如图5所示。图中变量的数字后缀代表影像获取日期。
图5
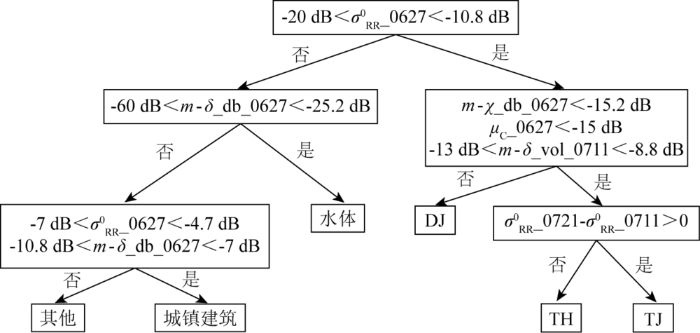
图5
3类水稻田的分类决策树
Fig.5
Classification decision tree of three kinds of paddy land
研究区非水稻区域主要包括城镇建筑和水体等,水稻与水体、建筑的二次散射贡献差异很大(图6),而RR极化对二次散射敏感,因此首先根据
图6
2.4.2 SVM分类
基于CP-SAR优选特征,利用SVM进行分类。选择径向基核函数(radial basis function,RBF),其Gamma值为输入图像波段的倒数,惩罚参数为100; 分级处理等级为0,以原图像空间分辨率进行分类处理; 分类概率阈值为0。
3 结果与分析
通过设计4组对比实验进行结果分析: ①利用6月27日12个CP优选参数进行SVM分类,并与全部22个参数SVM分类结果进行比较; ②考虑时相信息,利用3个时相28个优选参数进行SVM分类,并与全部66个参数分类结果进行比较; ③利用决策树方法进行TH,DJ与非水稻区的区分; ④利用决策树进行3类水稻田与非水稻区的区分。最后利用验证样本对分类结果进行精度评价(表3)。可以看出,水体和城镇建筑分类效果较好,生产者精度和用户精度均在90%以上,不同方法、不同时相组合对应的分类结果差异不大。
表3 2种分类方法的分类精度比较
Tab.3
| 方法 | 分类参数 | TH | TJ | DJ | 水体 | 城镇建筑 | 总体精 度/% | Kappa系数 | |||||
|---|---|---|---|---|---|---|---|---|---|---|---|---|---|
| 生产者精 度/% | 用户精 度/% | 生产者精 度/% | 用户精 度/% | 生产者精 度/% | 用户精 度/% | 生产者精 度/% | 用户精 度/% | 生产者精 度/% | 用户精 度/% | ||||
| SVM | T1-12-3① | 99.42 | 41.90 | 1.18 | 58.23 | 64.56 | 78.38 | 99.82 | 99.87 | 92.08 | 99.75 | 83.72 | 0.778 |
| T1-22-3 | 89.90 | 49.78 | 0.57 | 100 | 78.74 | 66.32 | 100 | 100 | 93.72 | 99.84 | 85.30 | 0.798 | |
| T3-28-3 | 100 | 59.63 | 24.16 | 95.20 | 91.44 | 85.66 | 100 | 100 | 95.13 | 100 | 91.39 | 0.880 | |
| T3-66-3 | 98.85 | 61.40 | 46.48 | 73.58 | 73.98 | 89.18 | 100 | 100 | 95.69 | 100 | 91.38 | 0.880 | |
| 决策树 | T3-28-2 | 94.73 | 87.89 | — | — | 95.44 | 92.43 | 100 | 100 | 95.89 | 99.62 | 97.44 | 0.962 |
| T3-28-3 | 96.25 | 69.57 | 45.74 | 68.06 | 86.39 | 88.53 | 100 | 100 | 95.30 | 99.03 | 92.57 | 0.896 | |
对于水稻来说,单一时相12个优选参数SVM分类,TH平均精度约为70.6%; TJ的生产者和用户精度都很低。多时相28个优选参数SVM分类,3类水稻的精度都有所提高,因此多时相对区分水稻种类、种植方式具有一定贡献; 但是TJ生产者精度只有24.16%,即大部分TJ被错分成TH,说明水稻种类的区分能力仍然不高。多时相全部66个参数SVM分类,总体精度为91.38%,Kappa系数为0.880,与多时相28个优选参数SVM分类结果相近,可见对于水稻精细分类,基于SVM + SFS策略优选的28个特征参数能够与全部66个参数达到同样效果,避免了数据赘余、提高了运算效率。
利用多时相28个优选参数,进行决策树方法,区分TH和DJ,总体精度为97.44%,Kappa系数为0.962; 区分3类决策树分类总体精度达到92.57%,Kappa系数达到0.896。与优选参数SVM分类对比总体精度提高1%~9%,Kappa系数提高0.01~0.12。TJ生产者精度为45.74%,比SVM分类精度提高了0~40%。总体来看,SVM + SFS策略优选参数决策树分类要优于SVM分类,并且分类速度更快。
从分类精度来看,TJ生产者精度较低,区分效果不好主要有以下几方面原因: ①由于播种方式的不同,幼苗期插秧稻田种植稀疏,植株成行成垄,而撒播稻田植株较稠密,在雷达响应上表现差异性大,因此DJ容易与TH,TJ区分。幼苗期TH和TJ这2类水稻具有水稻共性,并且幼苗期水稻植株小,导致在雷达响应上表现差异性小; 分蘖期和拔节期2类水稻植株表现出差异性,但随着植株生长,植株间的缝隙减小,这种差异性又淹没在水稻群体中,导致在雷达响应上差异性小,使得TJ区分效果不好; ②研究区TJ种植面积少,在研究区地面获取的样方也少,影响TJ生产者精度; ③本研究使用CP-SAR模拟数据,空间分辨率为30 m,噪声水平为-25 dB,空间分辨率和噪声水平与真实SAR数据(以RADARSAT-2全极化为例,空间分辨率8 m,噪声水平约为-32 dB)存在一定的差异。
采用SVM和决策树分类方法,3个时相28个参数分类结果如图7所示。
图7
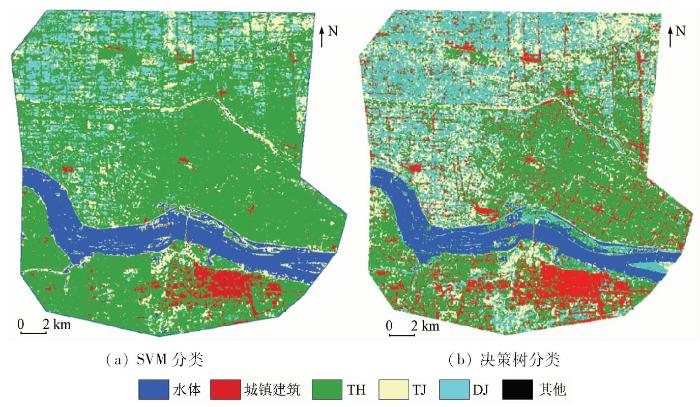
图7
3个时相28个参数分类结果
Fig.7
Classification results of 28 parameters at three periods
4 结论
利用CP-SAR模拟数据提取多维特征信息,引入基于SVM + SFS的特征选择方法,构建了基于决策树和SVM的水稻精细分类方法,为水稻长势监测与估产提供了更精准的信息。具体结论如下:
1)利用多时相CP-SAR模拟数据,分析了不同种植方式、不同品种的3类水稻田的CP-SAR响应特征、散射机理及其时相变化规律。
2)针对CP-SAR多维特征参数,引入基于SVM + SFS的特征选择方法,建立了面向水稻田精细分类的CP-SAR最优特征集,并结合物理意义分析了这些特征在不同水稻田区分中的优势。
3)基于优选的CP-SAR特征参数,建立了不同种植方式、不同品种的3类水稻田的精细分类方法,TH与DJ的分类精度较好,平均精度分别达到88%和82%。TJ的分类结果相对较差,平均精度达到60%。
4)当利用3个时相CP-SAR数据水稻精细分类时,基于SVM + SFS优选特征的分类结果优于全部特征的分类结果。
但是TJ分类精度不高,应继续分析TJ与TH,DJ的差异,充分利用CP-SAR数据,提高TJ分类精度将是我们下一步的工作重点。
参考文献
新一代SAR对地观测技术特点与应用拓展
[J].
Technical characteristics and potential application of the new generation SAR for earth observation
[J].
Compact polarimetry based on symmetry properties of geophysical media:The /spl pi//4 mode
[J].
DOI:10.1109/TGRS.2004.842486
URL
[本文引用: 1]

We assess the performance of synthetic aperture radar (SAR) compact polarimetry architectures based on mixed basis measurements, where the transmitter polarization is either circular or orientated at 45/spl deg/(/spl pi//4), and the receivers are at horizontal and vertical polarizations with respect to the radar line of sight. An original algorithm is proposed to reconstruct the full polarimetric (FP) information from this architecture. The performance assessment is twofold: it first concerns the level of information preserved in comparison with FP, both for point target analysis and crop fields classification, using L-band SIRC/XSAR images acquired over Landes forest and Jet Propulsion Laboratory AIRSAR images acquired over Flevoland. Then, it addresses the space implementation complexity, in terms of processed swath, downloading features, power budget, calibration, and ionospheric effects. The polarization uniqueness in transmission of this mixed basis mode, hereafter referred to as the /spl pi//4 mode, maintains the standard lower pulse repetition frequency operation and hence maximizes the coverage of the sensor. Because of the mismatch between transmitter and receiver basis, the power budget is deteriorated by a factor of 3 dB, but it can partly be compensated.
Dual-polarized SAR and stokes parameter
[J].
DOI:10.1109/LGRS.2006.871746
URL
[本文引用: 1]
For a given transmission polarization, the four-element Stokes vector captures all of the information inherent to the dual-polarized backscattered signals. Stokes parameters are linear combinations of the like-polarized power, the cross-polarized power, and the cross product between the complex image amplitudes in the two receive channels. Most so-called dual-polarized synthetic aperture radar (SAR) systems provide only the like- and cross-product images, ignoring the cross product. In so doing, potentially valuable information is thrown away. For most dual-polarized SARs, data sufficient to generate the Stokes parameters can be generated with small marginal cost. A practical and sufficient output data format would be a mapping of the (complex) cross product between the two channels, as well as their respective images
Hybrid-polarity SAR architecture
[J].DOI:10.1109/TGRS.2007.895883 URL [本文引用: 1]
On the reconstruction of quad-pol SAR data from compact polarimetry data for ocean target detection
[J].
DOI:10.1109/TGRS.2012.2199760
URL
[本文引用: 1]
Circular-transmit/linear-receive compact polarimetry synthetic aperture radar systems combine coherent dual polarization with wide-swath imaging. The polarization information in these data may be represented as a Stokes vector, or one can reconstruct several quadpolarized covariance elements. Two reconstruction algorithms have been published in the literature: one by Souyris et al. and a refined algorithm by Nord et al. We investigated the application of these two algorithms for reconstructing ocean clutter for the purpose of detecting targets. We tested the assumptions underlying these algorithms and found that they were not valid for ocean scenes. We present a simple empirical reconstruction model whose reconstruction and target detection performance is superior to the two published algorithms.
简缩极化SAR数据信息提取与应用
[J].
Information extraction application of compact polarimetric SAR data
[J].
Classification comparisons between dual-pol,compact polarimetric and quad-pol SAR imagery
[J].
DOI:10.1016/j.isprsjprs.2008.12.008
URL
[本文引用: 1]
We present a study of the polarimetric information content of dual-pol imaging modes and dual-pol imaging extended by polarimetric scattering models. We compare Wishart classifications both among the partial polarimetric datasets and against the full quad-pol dataset. Our emphasis is the inter-comparisons between the classification results based on dual-pol modes, compact polarimetric modes and scattering model extensions of the compact polarimetric modes. We primarily consider novel dual-pol modes, e.g. transmitting a circular polarization and receiving horizontal and vertical polarizations, and the pseudo-quad-pol data derived from polarimetric scattering models based on dual-pol data. We show that the overall classification accuracy of the pseudo-quad-pol data is essential the same as the classification accuracy obtained directly employing the underlying dual-pol imagery.
Dubois-Fernandez P C,Papathanassiou K.Pine forest height inversion using single-pass X-band PolInSAR data
[J].
DOI:10.1109/TGRS.2007.907602
URL
[本文引用: 1]
A sparse pine forest is investigated at X-band on a single-pass polarimetric synthetic aperture radar interferometry (PolInSAR) data set using HH and HV channels. These first preliminary results show that the associated phase centers present a significant vertical separation (about 6 m) allowed by penetration through gaps in the canopy. Forest parameter inversion using the random volume over ground (RVoG) model is evaluated and adapted at this frequency. The forest height can be retrieved accurately by supposing a high mean extinction coefficient (around 1.6 (dB/m). The penetration depth is estimated to be around 4 m, based on the forest height ground measurements. Finally, a time-frequency analysis using a sublook decomposition is performed to increase the vertical separation of the polarimetric phase centers. As a consequence, RVoG-inversion performance is improved, and a penetration depth that is in better accordance with a previous work (of the order of 2 m) is found. This paper has shown that the height inversion of a pine forest was possible using PolInSAR X-band data and that the performance was more dependent on the forest density than at lower frequencies.
Retrieval of the thickness of undeformed sea ice from simulated C-band compact polarimetric SAR images
[J].
DOI:10.5194/tc-10-1529-2016
URL
[本文引用: 1]
In this paper we introduce a parameter for the retrieval of the thickness of undeformed first-year sea ice that is specifically adapted to compact polarimetric??(CP) synthetic aperture radar??(SAR) images. The parameter is denoted as the "CP ratio". In model simulations we investigated the sensitivity of the CP ratio to the dielectric constant, ice thickness, ice surface roughness, and radar incidence angle. From the results of the simulations we deduced optimal sea ice conditions and radar incidence angles for the ice thickness retrieval. C-band SAR data acquired over the Labrador Sea in circular transmit and linear receive??(CTLR) mode were generated from RADARSAT-2 quad-polarization images. In comparison with results from helicopter-borne measurements, we tested different empirical equations for the retrieval of ice thickness. An exponential fit between the CP ratio and ice thickness provides the most reliable results. Based on a validation using other compact polarimetric SAR images from the same region, we found a root mean square (rms) error of 8???cm and a maximum correlation coefficient of??0.94 for the retrieval procedure when applying it to level ice between 0.1??and 0.8???m thick.
Estimation of soil moisture and Faraday rotation from bare surfaces using compact polarimetry
[J].
DOI:10.1109/TGRS.2009.2031428
URL
[本文引用: 1]
The potential of compact polarimetry (CP) mode at longer wavelengths in a space environment for surface parameter estimation is investigated. CP consists of transmitting a single polarization while receiving two polarizations. At longer wavelengths, one of the main challenges associated with CP from space is Faraday rotation (FR) estimation and correction. In this paper, an estimation procedure...
SAR signature investigation of rice crop using RADARSAT data
[J].
DOI:10.1080/01431160500239172
URL
[本文引用: 1]
The current study investigates the potential of multi‐temporal RADARSAT ScanSAR Narrow Beam B (SCNB) data to monitor rice crop growth and condition where special emphasis was given to the signature analysis of the crop. The study area is located in the Baleshwar and Bhadrak districts of Orissa. The temporal variations of radar backscatter of all land‐cover classes were analysed as a function of time. The analysis of the Synthetic Aperture Radar (SAR) backscatter coefficient (σ0) of rice crop shows significant temporal behaviour and a large dynamic range during its growth period, which is due to the interaction of microwave radiation with the crop canopy, increasing from the transplanting stage to the reproductive stage. This temporal variation of SAR backscatter clearly differentiates rice fields from other land‐cover classes. Separability studies among different class pairs carried out using t‐test and Bhattacharya distance show that all the rice classes are separable from each other except the early rice, which was mixed with far sides of hills and shadow. Knowledge‐based decision rule classifier based on the temporal evaluation of SAR backscatter was attempted to classify rice and non‐rice areas, and achieved more than 98% accuracy in the case of rice class. The results are promising and confirm the possibility of operational use of RADARSAT data for rice crop growth monitoring.
Use of ENVISAT/ASAR wide swath data for timely rice fields mapping in the Mekong River Delta
[J].
DOI:10.1016/j.rse.2010.12.014
URL
[本文引用: 1]
78We develop a large-scale rice fields mapping method using wide-swath SAR data. 78Multi-track datasets are used to increase the observation frequency. 78The temporal change of backscatter in each track is an effective classifier. 78Precise planted area estimations are hampered by the coarse resolution. 78Operational application is possible in integrated systems using ancillary data.
Monitoring of the rice cropping system in the Mekong Delta using ENVISAT/ASAR dual polarization data
[J].
DOI:10.1109/TGRS.2008.2007963
URL
[本文引用: 1]
The rice cropping system in Asia is undergoing major changes to cope with increasing demography and changing climate, making rice monitoring a critical issue. Past studies have demonstrated the use of C-band synthetic aperture radar (SAR) data to map rice areas. The methods were based on the temporal change of intensity backscattering coefficient of vertically or horizontally co-polarized data (VV or HH). In this paper, we assess the use of the HH/VV polarization ratio derived from Advanced SAR (ASAR) data from ENVISAT data for the production of rice paddy maps. The approach is based on past knowledge on the polarization behavior of rice canopy, i.e., VV backscattering is much lower than HH during a large part of the rice season, due to the attenuation of the wave by the vertical structure of the plants. The methodology is developed for the Mekong Delta, Vietnam, where a complex cropping pattern is found (one to three crops of rice per year). The approach includes a statistical analysis of the HH/VV distributions of rice and non-rice classes at different dates. The analysis results confirm that HH/VV can be used as classifier and point out the need for relevant speckle filtering prior to classification. A classification method is developed and applied to single- and multidate data sets. The methods are tested at one district of the province of An Giang and extended to the whole province. Comparisons of the mapping results to geographic-information-system land-use data and official agricultural statistics show very good agreement. The method will be further applied to the entire Mekong Delta.
Polarization signature analysis of paddy rice in southern China
[J].
DOI:10.5589/m11-018
URL
[本文引用: 1]
Rice is one of the three largest food grains in the world. Radar remote sensing has been proven to be an effective tool for rice monitoring. With the emergence of spaceborne polarimetric synthetic aperture radar (SAR) satellites, research on polarization backscatter behaviors and identification methods for rice are of great significance and attract the attention of remote sensing communities. The Zhazuo area located in Guizhou province of southwest China was selected as the test site for this study. The RADARSAT-2 polarimetric data acquired on four different dates were used to analyze the polarization backscatter behaviors and temporal variation of rice. Identification methods for rice based on polarization combinations and polarization decompositions were developed. The results indicated that HH with HH/HV was the optimal polarization combination for rice identification, with an accuracy of up to 86.65%. Based on the Pauli decomposition, rice can be discriminated effectively, with an accuracy of about 87.00%. Furthermore, using combinations of different polarization decompositions the identification results were greatly improved. The combination of the Pauli decomposition and the parameter 脦虏 derived from eigenvector-eigenvalue-based decomposition was best for rice identification, with an accuracy of up to 93.51%.
Polarimetric decomposition with RADARSAT-2 for rice mapping and monitoring
[J].
DOI:10.5589/m12-024
URL
[本文引用: 1]
Synthetic aperture radar for paddy rice crop mapping is operational in many countries in southeast Asia due to the unique temporal backscatter signature when the rice grows above the water surface. Although the rapid increase of up to 10 dB or more allows for the identification and subsequent mapping of the rice crop extent the saturation of the backscatter signal during the later growth stages makes yield determination difficult. The development of polarimetric decomposition techniques may improve the capability to estimate rice production as the phase centre of the backscatter is expected to change as the crop matures and the water distribution in the plant parts changes. These changes can potentially be related to crop yield using growth models. This capability for monitoring growth stage and enhancing yield estimation is explored with a multitemporal RADARSAT-2 polarimetric data set of a rice growing region in China. The Freeman urden, the Cloude ottier, and the Touzi decompositions were used for classification and then evaluated as a function of the growth stage, which was monitored in the rice paddies during the image acquisition period. The Touzi decomposition produced the best classification accuracy when six or more parameters were used in the classification, but all polarimetric decompositions produced suitable accuracies for rice mapping. This indicated only one date of imagery is needed for rice identification when polarimetric data are available. The results also demonstrated some sensitivity to the growth stage in the polarimetric decompositions, especially with the Freeman urden and the Touzi parameters. A controlled experiment is planned to further develop the methodology for using polarimetric decompositions for rice monitoring and yield estimation.
Compact polarimetry assessment for rice and wetland mapping
[J].
DOI:10.1080/01431161.2012.730156
URL
[本文引用: 1]
Polarimetric RADARSAT-2 data of rice and wetlands are used to simulate compact polarimetry (CP) mode data from the upcoming RADARSAT Constellation Mission (RCM). The simulated CP data are then used to evaluate the information content for rice and wetland mapping using supervised classification, and the results are compared for linear and circular polarization combinations and polarimetric decompositions from the fully polarimetric data and the simulated CP data. The results are consistent for both rice and wetlands and show that the classification accuracy increases as one goes up the polarization hierarchy. The circular polarizations produced the best classification results for the polarization combinations. This result requires further research to verify. Although the CP data did not perform as well as the fully polarimetric data, the results were better than for dual polarization, and this mode may offer the best option for rice and wetland mapping applications because of swath coverage. Note that both the compact simulations and the fully polarimetric data produced operationally suitable classification accuracies. Additional research is underway to evaluate the monitoring capability of this new CP mode. This article describes the approach used for the analyses and the classification results for both rice and wetlands.
Rice crop discrimination using single date RISAT1 Hybrid (RH,RV) polarimetric data
[J].
DOI:10.14358/PERS.81.7.557
URL
[本文引用: 1]
Rice is the most important food grain crop in India and contributes to more than 40 percent of the country’s food grain production. Spaceborne remote sensing offers economically viable and accurate production and area statistics. The utility of optical remote sensing in mapping rice cropped area is limited by persistent cloud cover during monsoon season. Temporal availability of SAR data has facilitated an operational procedure to monitor the rice crop. The current study discriminates rice crop, using single date hybrid polarimetric data available from RISAT-1 SAR. This was subjected to Raney m-δ, m-χ decompositions, and supervised classification was performed. The accuracy was estimated using the field points. The results were compared with rice map generated using optical sensor Resourcesat-2 LISS-IV and statistical data. The spatial agreement between the estimate from RISAT-1 and LISS-IV data was found to be 85 percent. The class kappa value was 0.94 and 0.92 for LISS-IV and RISAT-1, respectively.
SVM全极化SAR图像分类中的特征选择
[J].
DOI:10.3969/j.issn.1003-0530.2007.06.019
URL
[本文引用: 1]
本文将SVM用于全极化SAR图像分类,并提出一种新的应用于 SVM分类的特征选择算法.该算法以支持向量个数作为特征评估准则,利用顺序前进法加入特征.基于NASA/JPL实验室AIRSAR系统的L波段荷兰 Flevoland全极化数据的与RELIEF-F算法的对比实验表明,在特征个数更少(或相当)的情况下,本文特征选择算法能在更广泛的SVM参数取值 范围内获得更高的分类精度.
A new feature selection algorithm for SVM-based fully polarimetric SAR image classification
[J].
The m-chi decomposition of hybrid dual-polarimetric Radar data with application to lunar craters
[J].
DOI:10.1029/2011JE003986
URL
[本文引用: 3]
[1] We introduce a new technique derived from the classical Stokes parameters for analysis of polarimetric radar astronomical data. This decomposition is based on m (the degree of polarization) and chi (the Poincar ellipticity parameter). Analysis of the crater Byrgius A demonstrates how m-chi can more easily differentiate materials within ejecta deposits and their relative thicknesses. We use Goldschmidt crater to demonstrate how m-chi can differentiate coherent deposits of water ice. Goldschmidt crater floor is found to be consistent with single bounce Bragg scattering suggesting the absence of water ice and further corroborating adsorbed H to mineral grains or an H2O frost as plausible explanations for a H2O/OH detection by near-infrared instruments.
Compact polarimetry overview and applications assessment
[J].
DOI:10.5589/m10-062
URL
[本文引用: 1]
A synthetic aperture radar (SAR) with hybrid-polarity (CL-pol) architecture transmits circular polarization and receives two orthogonal, mutually coherent linear polarizations, which is one manifestation of compact polarimetry. The resulting radar is relatively simple to implement and has unique self-calibration features and low susceptibility to noise. It also enables maintenance of a larger swath coverage than fully polarimetric SAR systems. A research team composed of various departments of the Government of Canada evaluated this compact polarimetry mode configuration for application to soil moisture estimation, crop identification, ship detection, and sea-ice classification. This paper presents an overview of compact polarimetry, the approach developed for evaluation, and preliminary results for applications important to the Government of Canada. The implications of the results are also discussed with respect to future SAR missions such as the Canadian RADARSAT Constellation Mission, the American DESDynI, and India鈥檚 RISAT.
