Analyzing water area changes and inundation trends in Siling Co during 1995—2023 based on multi-source remote sensing
WANG Haochen1,2(), HE Peng1,2(), CHEN Hong2, TONG Liqiang2, GUO Zhaocheng2, TU Jienan2, WANG Genhou1
1. School of Earth Science and Resources, China University of Geosciences(Beijing), Beijing 100083, China 2. China Aero Geophysical Survey & Remote Sensing Center for Natural Resources, Beijing 100083, China
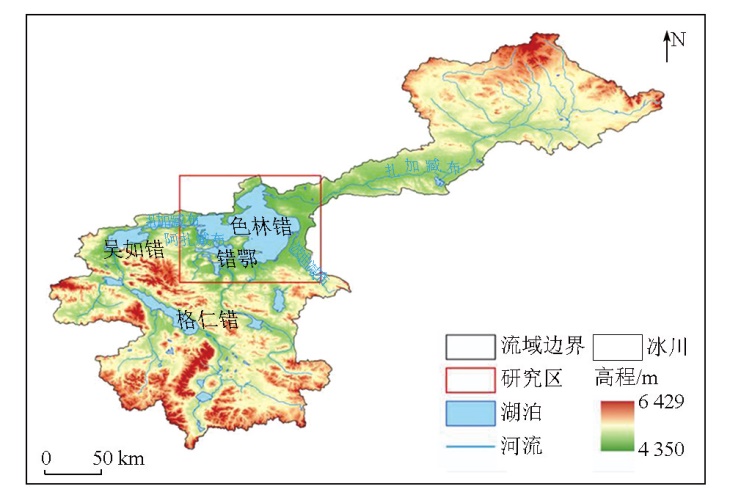
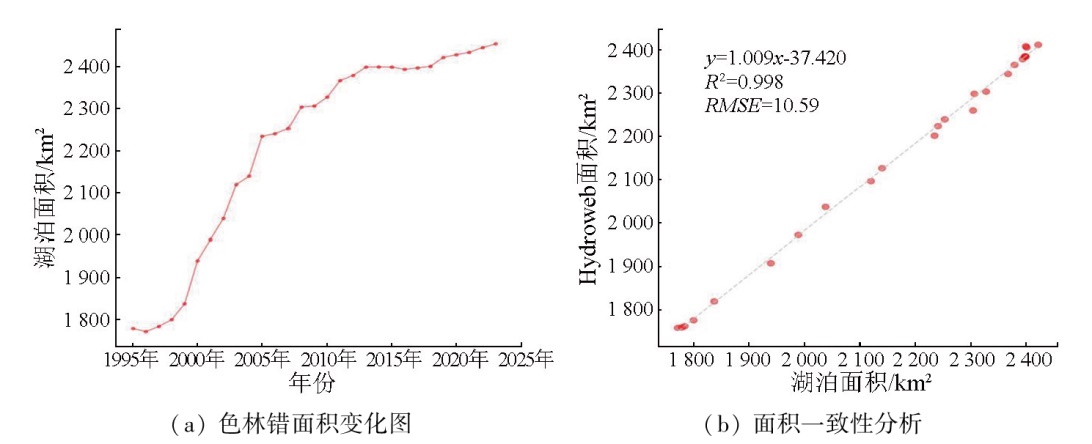
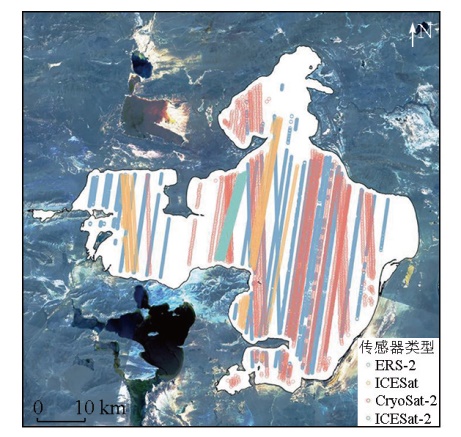
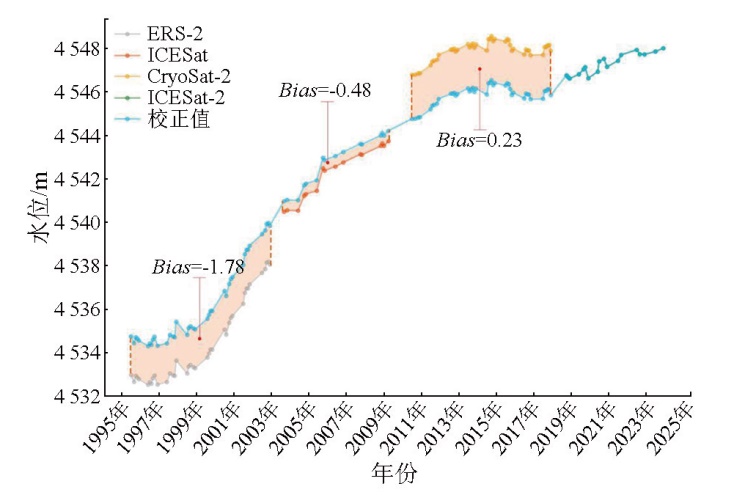
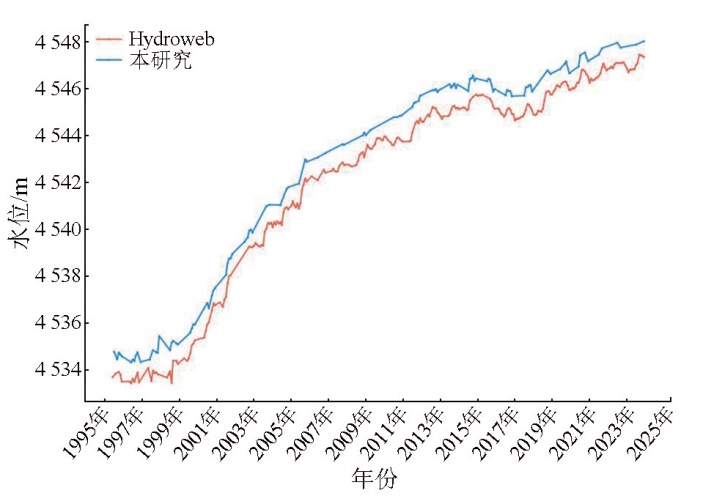
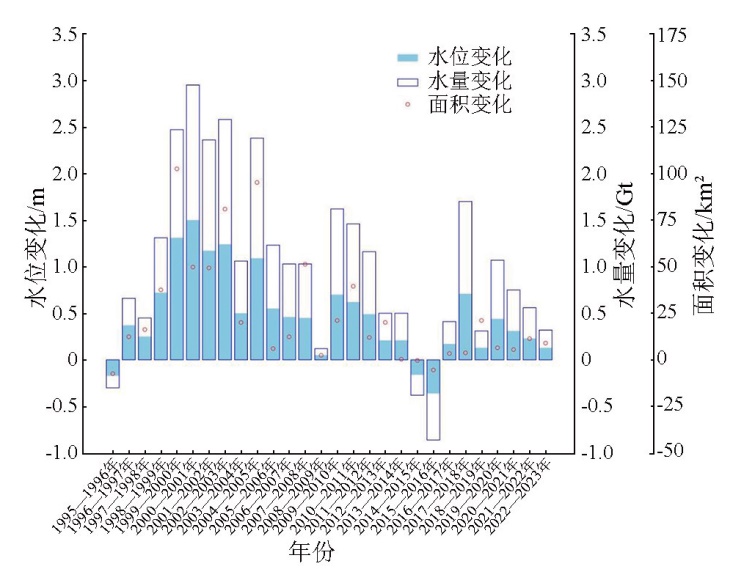
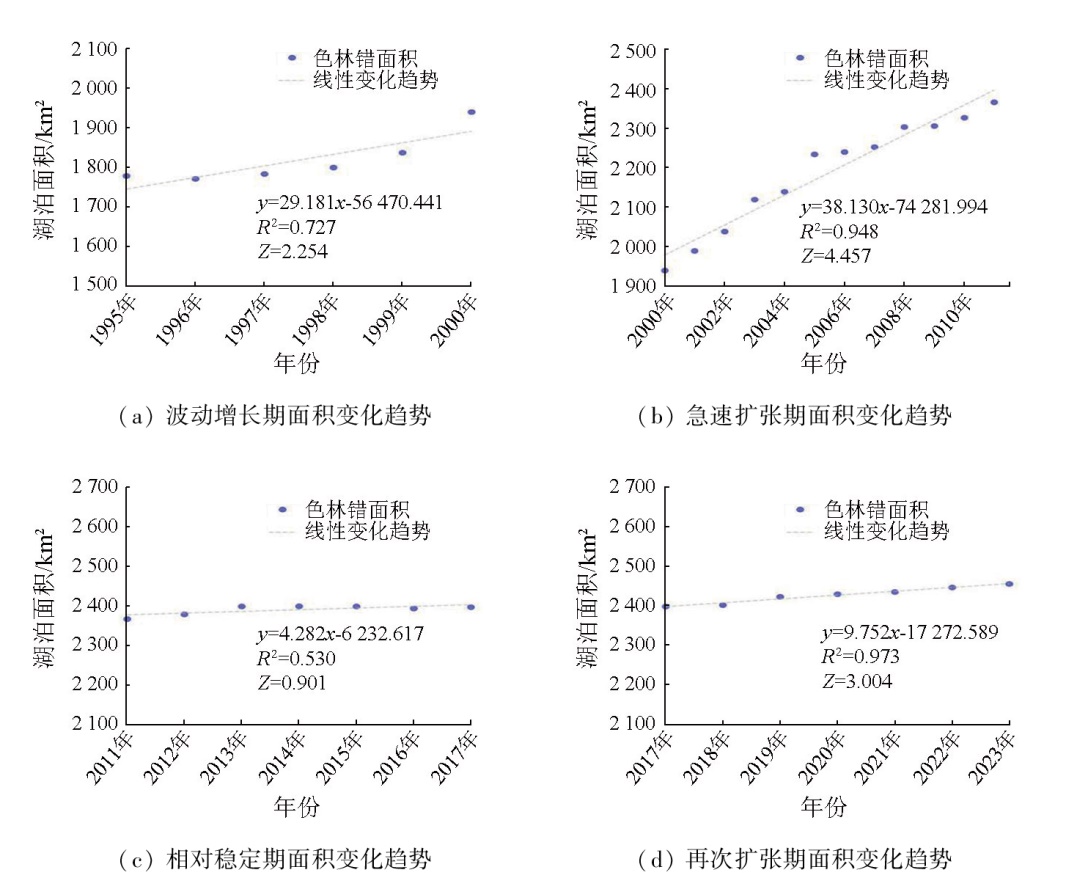
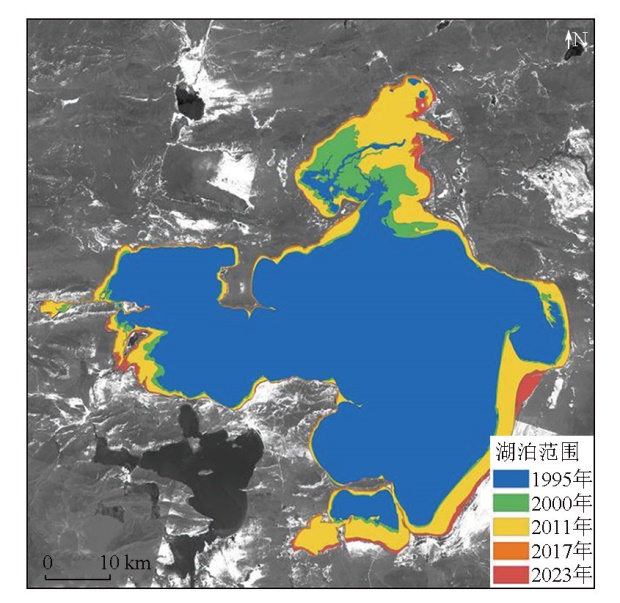
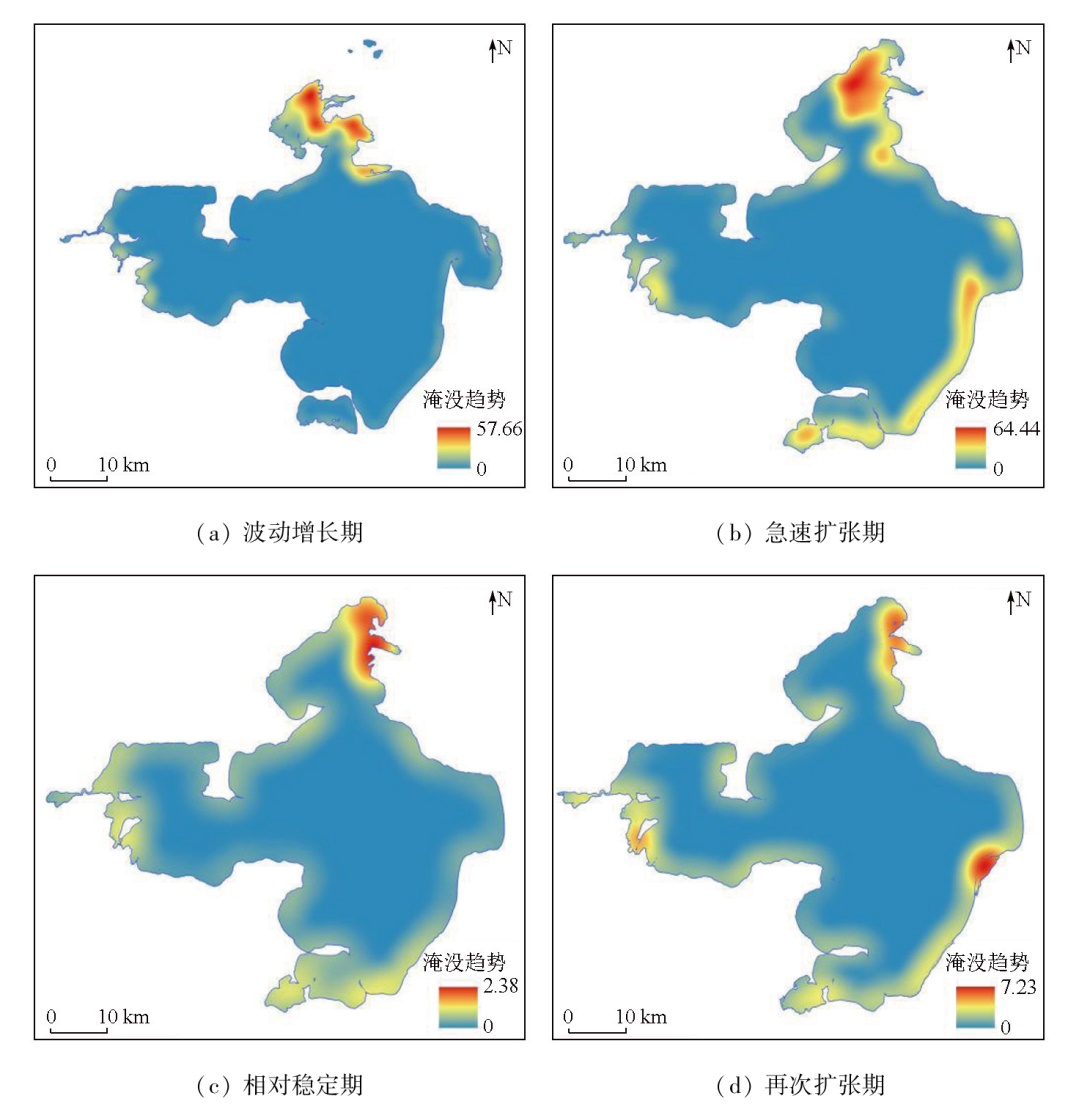
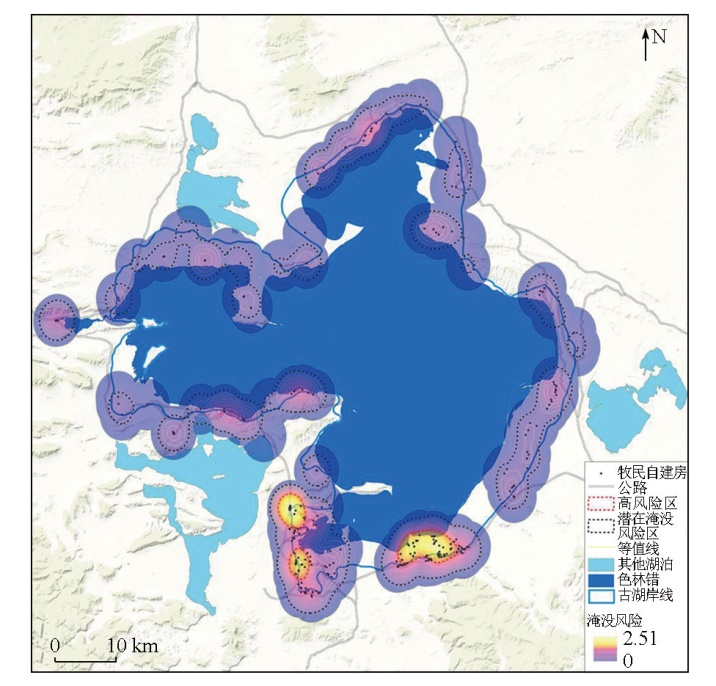
Siling Co, the largest lake in Xizang Autonomous Region, has expanded significantly in the past few years, threatening surrounding pastoral activities, infrastructures, and even the ecological environment. This study systematically reconstructed the time series of changes in the lake area, water level, and water volume of Siling Co from 1995 to 2023 using optical images from satellites Landsat and GF, as well as altimeter data from satellites ERS-2, ICEsat, Cryosat-2, and ICEsat-2. Through Mann-Kendall trend analysis, the study determined the stages of the lake area changes and revealed the key characteristics of various stages. Furthermore, it also made a preliminary judgement on the inundation trend and its impacts. The results indicate that from 1995 to 2023, Siling Co experienced an increase in water area of 676.75 km2 (with an annual average of 24.17 km2/a), a water level rise of approximately 13.32 m (with an annual average of 0.48 m/a), and a water volume growth of 28.45 Gt (with an annual average of 1.02 Gt/a). The changes in Siling Co from 1995 to 2023 can be divided into four stages: the fluctuating growth stage from 1995 to 2000, the rapid expansion stage from 2000 to 2011, the relatively stable stage from 2011 to 2017, and the re-expansion stage from 2017 to 2023. The inundated areas during the fluctuating growth and rapid expansion stages were primarily concentrated in the northern and southern parts of the lake. During the relatively stable stage, no significant expansion was observed in the inundated areas. In the re-expansion stage, the inundated areas were distributed in the eastern part of the lake. The continuous rise in the water level of Siling Co led to an annually increasing risk of surrounding inundation. Currently, the areas exposed to a high inundation risk are primarily concentrated along the south bank of the lake, which should be the focus in future monitoring and research.
王皓琛, 贺鹏, 陈虹, 童立强, 郭兆成, 涂杰楠, 王根厚. 基于多源遥感的1995—2023年间色林错水域变化特征及淹没趋势分析[J]. 自然资源遥感, 2025, 37(6): 251-262.
WANG Haochen, HE Peng, CHEN Hong, TONG Liqiang, GUO Zhaocheng, TU Jienan, WANG Genhou. Analyzing water area changes and inundation trends in Siling Co during 1995—2023 based on multi-source remote sensing. Remote Sensing for Natural Resources, 2025, 37(6): 251-262.
Wang K X, Zhang Y S, Zhang T, et al. Analysis of climate change in the Selin Co basin,Tibetan Plateau,from 1979 to 2017[J]. Arid Zone Research, 2020, 37(3):652-662.
Zhang G Q. Changes in lakes on the Tibetan Plateau observed from satellite data and their responses to climate variations[J]. Progress in Geography, 2018, 37(2):214-223.
doi: 10.18306/dlkxjz.2018.02.004
[3]
Song C, Huang B, Richards K, et al. Accelerated lake expansion on the Tibetan Plateau in the 2000s:Induced by glacial melting or other processes?[J]. Water Resources Research, 2014, 50(4):3170-3186.
doi: 10.1002/wrcr.v50.4
Zhang G Q, Wang M M, Zhou T, et al. Progress in remote sensing monitoring of lake area,water level,and volume changes on the Tibetan Plateau[J]. National Remote Sensing Bulletin, 2022, 26(1):115-125.
doi: 10.11834/jrs.20221171
Ma Y M, Hu Z Y, Tian L D, et al. Study progresses of the Tibet Plateau climate system change and mechanism of its impact on East Asia[J]. Advances in Earth Science, 2014, 29(2):207-215.
doi: 1001-8166(2014)02-0207-09
[6]
Zhang G, Yao T, Xie H, et al. Response of Tibetan Plateau lakes to climate change:Trends,patterns,and mechanisms[J]. Earth-Science Reviews, 2020,208:103269.
[7]
Wan W, Xiao P, Feng X, et al. Monitoring lake changes of Qinghai-Tibetan Plateau over the past 30 years using satellite remote sensing data[J]. Chinese Science Bulletin, 2014, 59(10):1021-1035.
doi: 10.1007/s11434-014-0128-6
[8]
Meng K, Shi X, Wang E, et al. High-altitude salt lake elevation changes and glacial ablation in Central Tibet,2000—2010[J]. Chinese Science Bulletin, 2012, 57(5):525-534.
doi: 10.1007/s11434-011-4849-5
[9]
Fang Y, Cheng W, Zhang Y, et al. Changes in inland lakes on the Tibetan Plateau over the past 40 years[J]. Journal of Geographical Sciences, 2016, 26(4):415-438.
doi: 10.1007/s11442-016-1277-0
[10]
Li Y, Liao J, Guo H, et al. Patterns and potential drivers of drama-tic changes in Tibetan lakes,1972—2010[J]. PLoS One, 2014, 9(11):e111890.
[11]
Zhang J, Hu Q, Li Y, et al. Area,lake-level and volume variations of typical lakes on the Tibetan Plateau and their response to climate change,1972—2019[J]. Geo-Spatial Information Science, 2021, 24(3):458-473.
doi: 10.1080/10095020.2021.1940318
Song Y Z, De J. Variation of Selin Co lake area during 1988—2020 and its response to climate change[J]. Journal of Nanjing University of Information Science & Technology (Natural Science Edition), 2023, 15(1):24-33.
Yang Z G, Du J, Lin Z Q. Extreme air temperature changes in Selin Co basin,Tibet(1961—2012)[J]. Acta Ecologica Sinica, 2015, 35(3):613-621.
[14]
Sun M, Jin H, Yao X, et al. Hydrochemistry differences and causes of tectonic lakes and glacial lakes in Tibetan Plateau[J]. Water, 2020, 12(11):3165.
doi: 10.3390/w12113165
Liu J K, Zhang J J, Gao B, et al. An overview of glacial lake outburst flood in Tibet,China[J]. Journal of Glaciology and Geocryology, 2019, 41(6):1335-1347.
Jia Y, Cui P. The extreme climate background for glacial lakes outburst flood events in Tibet[J]. Climate Change Research, 2020, 16(4):395-404.
[17]
Allen S K, Zhang G, Wang W, et al. Potentially dangerous glacial lakes across the Tibetan Plateau revealed using a large-scale automated assessment approach[J]. Science Bulletin, 2019, 64(7):435-445.
doi: 10.1016/j.scib.2019.03.011
pmid: 36659793
[18]
Westoby M J, Glasser N F, Brasington J, et al. Modelling outburst floods from moraine-dammed glacial lakes[J]. Earth-Science Reviews, 2014,134:137-159.
[19]
Liu W H, Xie C W, Zhao L, et al. Dynamic changes in lakes in the Hoh Xil region before and after the 2011 outburst of Zonag Lake[J]. Journal of Mountain Science, 2019, 16(5):1098-1110.
doi: 10.1007/s11629-018-5085-0
Deji Y Z, Nima J, Qiangba O Z, et al. Lake area variation of Selin Tso in 1975—2016 and its influential factors[J]. Plateau and Mountain Meteorology Research, 2018, 38(2):35-41,96.
Tai X N, Wang N L, Wu Y W, et al. Lake ice phenology variations and influencing factors of Selin Co from 2000 to 2020[J]. Journal of Lake Sciences, 2022, 34(1):334-348.
doi: 10.18307/2022.0127
[22]
Tang Y, Huo J, Zhu D, et al. Simulation of the water storage capacity of Siling co lake on the Tibetan Plateau and its hydrological response to climate change[J]. Water, 2022, 14(19):3175.
doi: 10.3390/w14193175
Li Z N, Lei W W, Wang Y F, et al. Water level variation of Qinghai Hu based on multi-source satellite altimetry data[J]. Science of Surveying and Mapping, 2023, 48(5):140-151.
Wu W J, Zhang S F, Su Q M, et al. Water level changes monitoring of important reservoirs in Loess Plateau based on ICESat/GLA14[J]. Science of Surveying and Mapping, 2018, 43(4):71-75.
[25]
Berry P A M, Garlick J D, Freeman J A, et al. Global inland water monitoring from multi-mission altimetry[J]. Geophysical Research Letters, 2005, 32(16):L16401.
[26]
Santos da Silva J, Calmant S, Seyler F, et al. Water levels in the Amazon basin derived from the ERS 2 and ENVISAT radar altimetry missions[J]. Remote Sensing of Environment, 2010, 114(10):2160-2181.
doi: 10.1016/j.rse.2010.04.020
[27]
Feng Y, Yang L, Zhan P, et al. Synthesis of the ICESat/ICESat-2 and CryoSat-2 observations to reconstruct time series of lake level[J]. International Journal of Digital Earth, 2023, 16(1):183-209.
doi: 10.1080/17538947.2023.2166134
[28]
Nielsen K, Stenseng L, Andersen O B, et al. Validation of CryoSat-2 SAR mode based lake levels[J]. Remote Sensing of Environment, 2015,171:162-170.
[29]
Yuan C, Gong P, Bai Y. Performance assessment of ICESat-2 laser altimeter data for water-level measurement over lakes and reservoirs in China[J]. Remote Sensing, 2020, 12(5):770.
doi: 10.3390/rs12050770
[30]
Shi X, Kirby E, Furlong K P, et al. Rapid and punctuated late Holocene recession of Siling Co,central Tibet[J]. Quaternary Science Reviews, 2017,172:15-31.
Meng K, Shi X H, Wang E Q, et al. Geomorphic characteristics,spatial distribution of paleoshorelines around the Siling Co area,central Tibetan Plateau,and the lake evolution within the plateau[C]// The 2012 (12th) Academic Annual Conference of the Institute of Geology and Geophysics,Chinese Academy of Sciences. Beijing,China, 2013:618-633.
[32]
Lee H, Calvin K, Dasgupta D, et al. Climate change 2023:Synthesis report,summary for policymakers[EB/OL]. Geneva, Switzerland: Intergovernmental Panel on Climate Change (IPCC), 2023:1-34[2024-10-09].https://doi.org/10.59327/IPCC/AR6-9789291691647.001.
 2025, Vol. 37
  ), 贺鹏1,2(