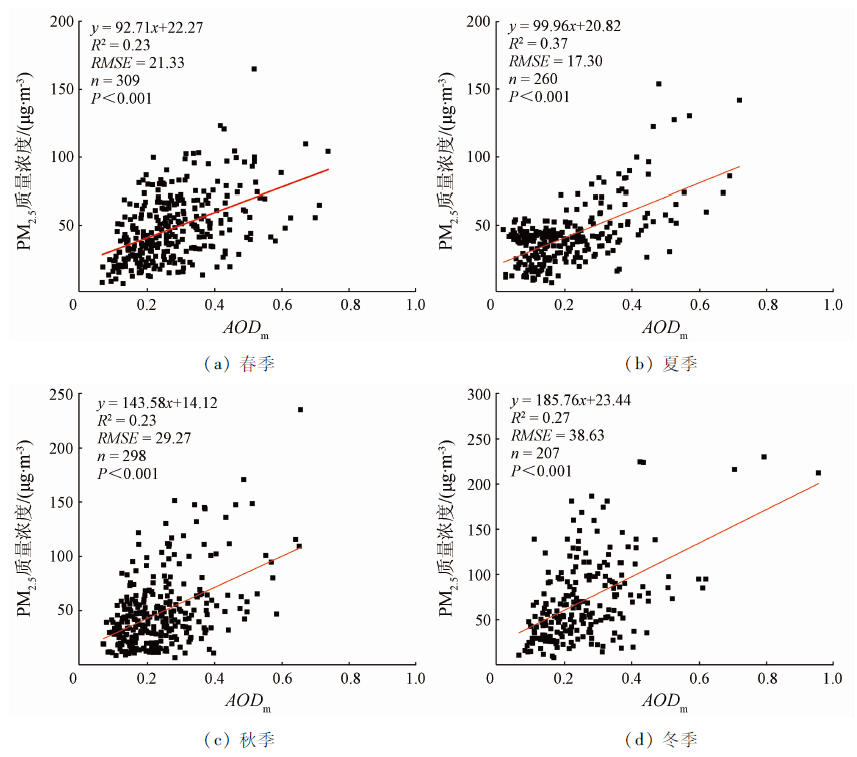
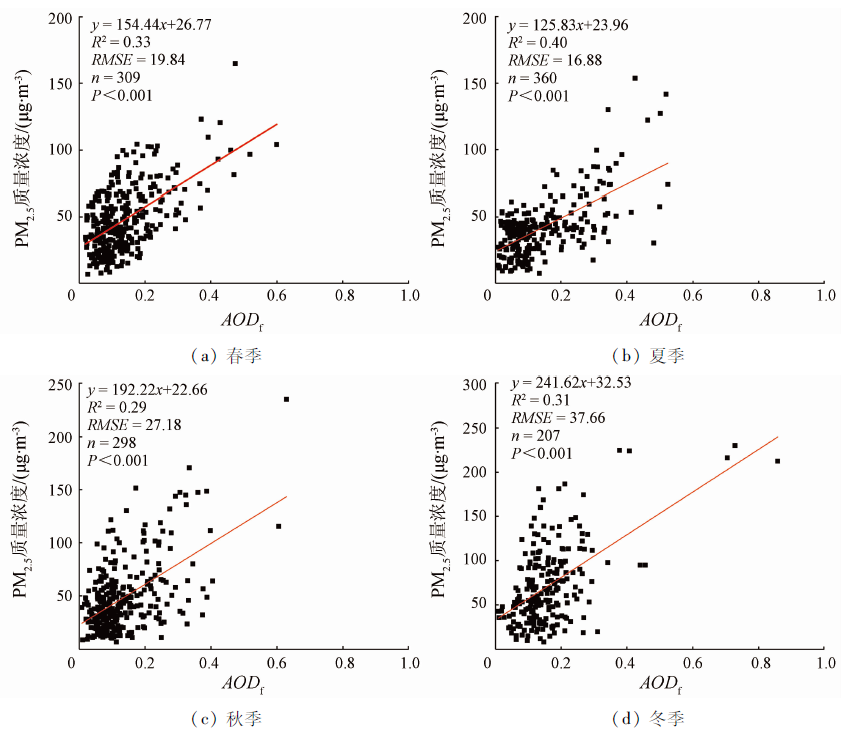
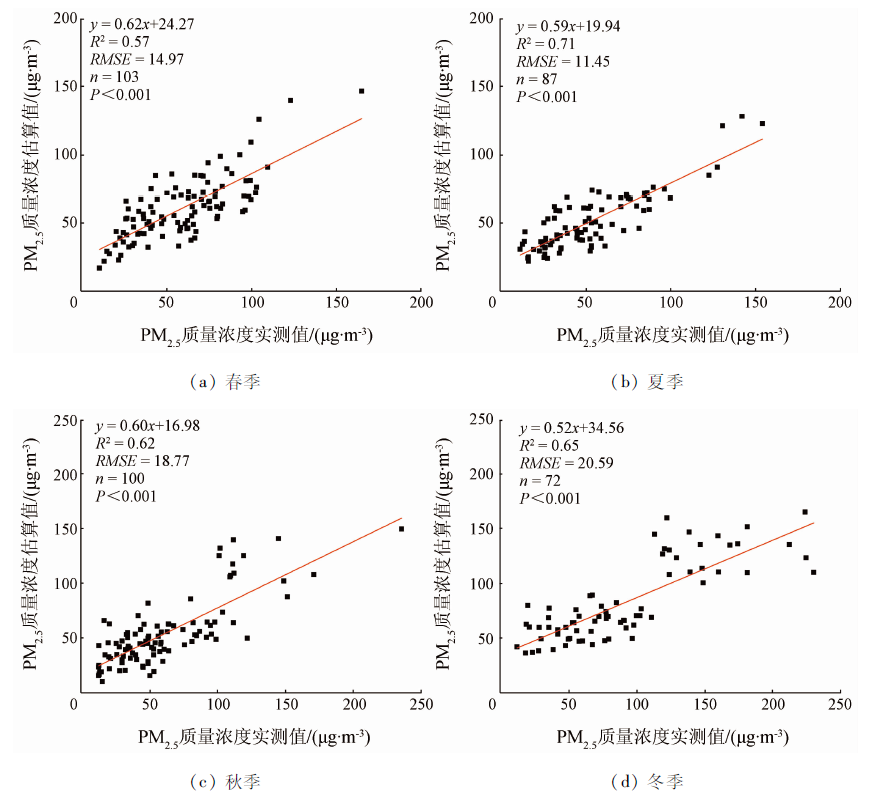
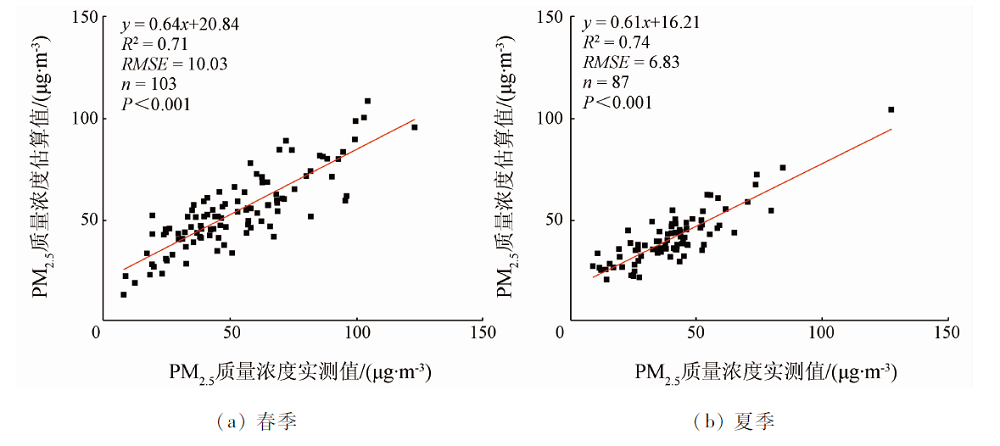
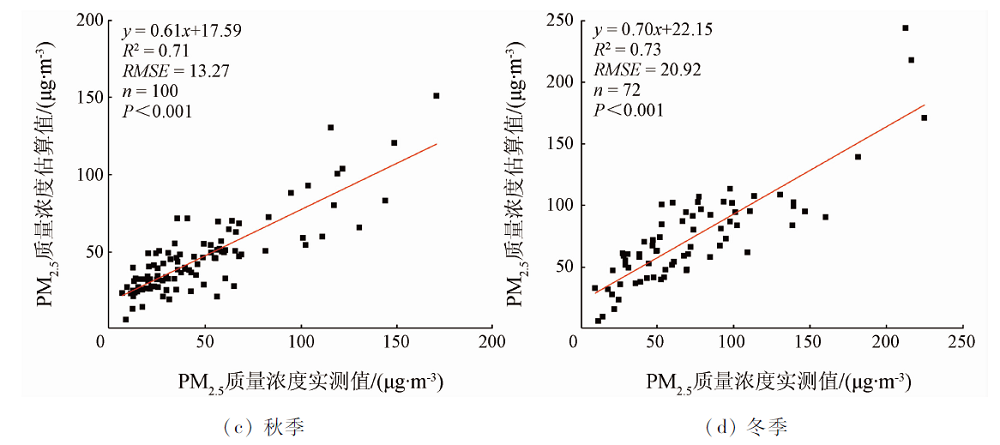
将气象要素加入到基于气溶胶光学厚度(aerosol optical depth,AOD)的近地面大气颗粒物浓度估算是目前热门的技术手段之一。获取了江苏省南京市2014年3月—2019年2月期间的AOD,精细模式分数 (fine-mode fraction,FMF)和PM2.5质量浓度数据,并结合天气研究和预报 (weather research and forecast,WRF)模式得到的气象模拟数据,对南京市PM2.5的质量浓度进行反演。结果表明,相比于AOD与PM2.5进行相关性分析,通过FMF校正得到的精细气溶胶光学厚度AODf与PM2.5的相关性分析能够取得更高的拟合系数,R2最高达到0.40。利用随机森林模型,引入含不同高度的气象因子对PM2.5质量浓度建立反演模型,得到的拟合系数与各误差指标均优于仅含近地面气象因子的模型,表明PM2.5质量浓度受到多因子共同作用的影响,能较好地为利用多源数据反演PM2.5质量浓度提供依据和参考。
The addition of meteorological factors to the estimation of near-ground atmospheric particulate concentration based on AOD is one of the most popular techniques nowadays. In this paper, AOD (Aerosol Optical Depth), FMF (Fine-Mode Fraction) and PM2.5mass concentration data from March 2014 to February 2019 in Nanjing were obtained, and the mass concentration of PM2.5 in Nanjing was retrieved in combination with the meteorological simulation data from WRF (Weather Research and Forecast) model. The results show that, compared with correlation between AOD and PM2.5, the correlation analysis of fine aerosol optical depth AODf and PM2.5 obtained by FMF correction can obtain a higher fitting coefficient, and the maximum R2 reaches 0.40. By adding meteorological factors on different heights into random forest model to establish an inversion model for PM2.5 mass concentration, the obtained fitting coefficients and various error indicators are better than those from models with only near-surface meteorological factors, which indicates that the PM2.5 mass concentration is affected by the combined effect of multiple factors, thus the result can provide a basis and reference for inversion of PM2.5 mass concentration by using multi-source data.
韦耿, 侯钰俏, 韩佳媚, 查勇. 基于精细模式气溶胶与WRF模式估算PM2.5质量浓度[J]. 国土资源遥感, 2021, 33(2): 66-74.
WEI Geng, HOU Yuqiao, HAN Jiamei, ZHA Yong. The estimation of PM2.5 mass concentration based on fine-mode aerosol and WRF model. Remote Sensing for Land & Resources, 2021, 33(2): 66-74.
Betha R, Behera S, Balasubramanian R. 2013 Southeast Asian smoke haze:Fractionation of particulate-bound elements and associated health risk[J]. Environmental Science & Technology, 2014, 48(8):4327-4335.
doi: 10.1021/es405533d
[2]
Peng R D, Bell M L, Geyh A S. Emergency admissions for cardiovascular and respiratory diseases and the chemical composition of fine particle air pollution[J]. Environmental Health Perspectives, 2009, 117(6):957-963.
doi: 10.1289/ehp.0800185
[3]
Kloog I, Ridgway B, Koutrakis P, et al. Long and short term exposure to PM2.5 and mortality[J]. Epidemiology, 2013, 24:555-561.
doi: 10.1097/EDE.0b013e318294beaa
pmid: 23676266
[4]
King M, Kaufman Y, Nakajima T. Remote sensing of tropospheric aerosols from space:Past,present and future[J]. Bulletin of the American Meteorological Society, 1999, 80(11):2229-2259.
doi: 10.1175/1520-0477(1999)080<2229:RSOTAF>2.0.CO;2
[5]
Xu X D. Dynamic issues of urban atmospheric pollution models[J]. Journal of Applied Meteorological Science, 2002, 13:1-12.
[6]
Xu X D, Shi X H, Zhang S J, et al. Influence domain and climate effect related to aerosol of urban community around Beijing[J]. Chinese Science Bulletin, 2005, 50(22):2522-2530.
[7]
Bell M, Ebis K, Peng R. Community-level spatial heterogeneity of chemical constituent levels of fine particulates and implications for epidemiological research[J]. Journal of Exposure Science & Environmental Epidemiology, 2011, 21:372-384.
[8]
Luo N, Zhao W, Yan X. Integrated aerosol optical thickness,gaseous pollutants and meteorological parameters to estimate ground PM2.5 concentration[J]. Fresenius Environmental Bulletin, 2014, 23:2567-2577.
[9]
Lee K H, Kim Y J, Kim M J. Characteristics of aerosol observed during two severe haze events over Korea in June and October 2004[J]. Atmospheric Environment, 2006, 40:5146-5155.
doi: 10.1016/j.atmosenv.2006.03.050
[10]
Lee K H, Kim Y J, Wolfgand H. Sptio-temporal variability of satellite derived aerosol optical thickness over Northeast Asia in 2004[J]. Atmospheric Environment, 2007, 41:3959-3973.
doi: 10.1016/j.atmosenv.2007.01.048
[11]
Wang J, Christopher S A. Intercomparison between satellite-derived aerosol optical thickness and PM2.5 mass:Implications for air quality studies[J]. Geophysical Research Letters, 2003, 30(21):2095.
doi: 10.1029/2003GL018174
[12]
Engel-Cox J A, Holloman C H, Coutant B W, et al. Qualitative and quantitative evaluation of MODIS satellite sensor data for regional and urban scale air quality[J]. Atmospheric Environment, 2004, 38:2495-2509.
doi: 10.1016/j.atmosenv.2004.01.039
[13]
Hutchison K D, Smith S, Faruqui S J. Correlating MODIS aerosol optical thickness data with ground-based PM2.5 observations across Texas for use in a real-time air quality prediction system[J]. Atmospheric Environment, 2005, 39:7190-7203.
doi: 10.1016/j.atmosenv.2005.08.036
[14]
Liu Y, Sarnat J A, Kilaru V, et al. Estimating ground-level PM2.5 in the eastern United States using satellite remote sensing[J]. Environmental Science & Technology, 2005, 39:3269-3278.
doi: 10.1021/es049352m
[15]
Nicolantonio W D, Cacciari A, Bolzacchini E, et al.MODIS aerosol optical properties over north italy for estimating surface-level PM2.5[C]//Proceedings of Envisat Symposium 2007, Montreux,Switzerland, ESA SP- 636,2007.
[16]
Xing Y, Shi W Z, Li Z Q, et al. Satellite-based PM2.5 estimation using fine-mode aerosol optical thickness over China[J]. Atmospheric Environment, 2017, 170:290-302.
doi: 10.1016/j.atmosenv.2017.09.023
Lin J, Liu W, Li Y, et al. Relationship between meteorological conditions and particle size distribution of atmospheric aerosols[J]. Journal of Meteorology and Environment, 2009, 25(1):1-5.
Ji X L, Lian L S, Zhou T T, et al. Temporal and spatial variation characteristics analysis of aerosol around Bohai Sea region based on MODIS data[J]. Environmental Pollution & Control, 2017, 39(11):1238-1241,1245.
[19]
Ni X L, Cao C X, Zhou Y K, et al. Spatio-temporal pattern estimation of PM 2.5 in Beijing-Tianjin-Hebei region based on MODIS AOD and meteorological data using the back propagation neural network[J]. Atmosphere, 2018, 105(9):1-14.
Hou J Y, Li Q, Zhu Y J, et al. PM2.5 forecasting method based on machine learning and WRF hybrid model[J]. Science of Surveying and Mapping, 2018, 43(2):114-120.
He J L, Zhang S Y, Li J, et al. Particulate matter indices derived from MODIS data for indicating urban air pollution[J]. Remote Sensing for Land and Resources, 2016, 28(2):126-131.doi: 10.6046/gtzyyg.2016.02.20.
doi: 10.6046/gtzyyg.2016.02.20
Wang H R, Wu C B. Application of MODIS aerosol products in monitoring PM2.5 concentration in Beijing[J]. Science and Technology Innovation Herald, 2016, 13(20):76-78.
[23]
Zhang Y, Li Z Q. Remote sensing of atmospheric fine particulate matter (PM2.5) mass concentration near the ground from satellite observation[J]. Remote Sensing of Environment, 2015, 160:252-262.
doi: 10.1016/j.rse.2015.02.005
[24]
Melissa S B, David J K. Precipitation simulations using WRF as a nested regional climate model[J]. Journal of Applied Meteorology and Climatology, 2009, 48:2152-2159.
doi: 10.1175/2009JAMC2186.1
Gao Y. WRF numerical simulation of freezing rain extreme weather process in southern China in January 2008[D]. Beijing:Chinese Academy of Meteorological Sciences, 2011.
Zhang C L, Chen B Z, Wang J. Application of WRF model meteorological data in PM2.5 remote sensing inversion[J]. Geospatial Information, 2018, 16(2):45-47.
Shen L, Gu F, Zhang J H, et al. The effect of relative humidity on the extinction coefficient of aerosols[J]. The Journal of Light Scattering, 2017, 29(3):251-256.
[28]
Tian J, Chen D M. A semi-empirical model for predicting hourly ground-level fine particulate matter (PM2.5) concentration in southern Ontario from satellite remote sensing and ground-based meteorological measurements[J]. Remote Sensing of Environment, 2010, 114(2):221-229.
doi: 10.1016/j.rse.2009.09.011
 2021, Vol. 33
  ), 侯钰俏, 韩佳媚, 查勇(