|
|
 |
|

|
|
|
Impacts of COVID-19 epidemic on the spatial distribution of GDP contributed by secondary and tertiary industries in Guangdong Province in the first quarter of 2020 |
WANG Zheng1,2( ), JIA Gongxu1,2(), ZHANG Qingling1,3, HUANG Yue1,2 ), JIA Gongxu1,2(), ZHANG Qingling1,3, HUANG Yue1,2 |
1. Xinjiang Institute of Ecology and Geography, Chinese Academy of Sciences, Urumqi 830011, China
2. University of Chinese Academy of Sciences, Beijing 100049, China
3. School of Aeronautics and Astronautics, Sun Yat-sen University, Guangzhou 510275, China |
|
|
|
|
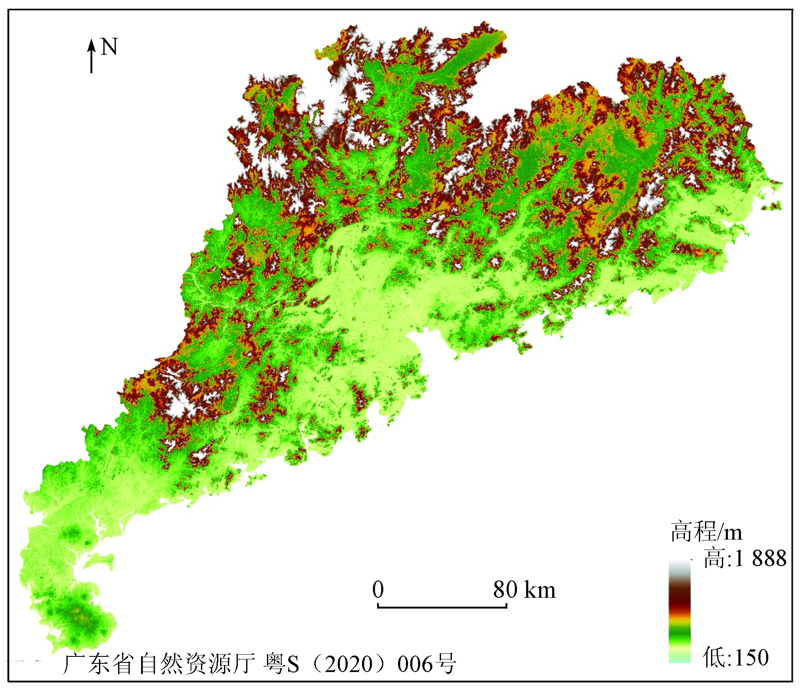
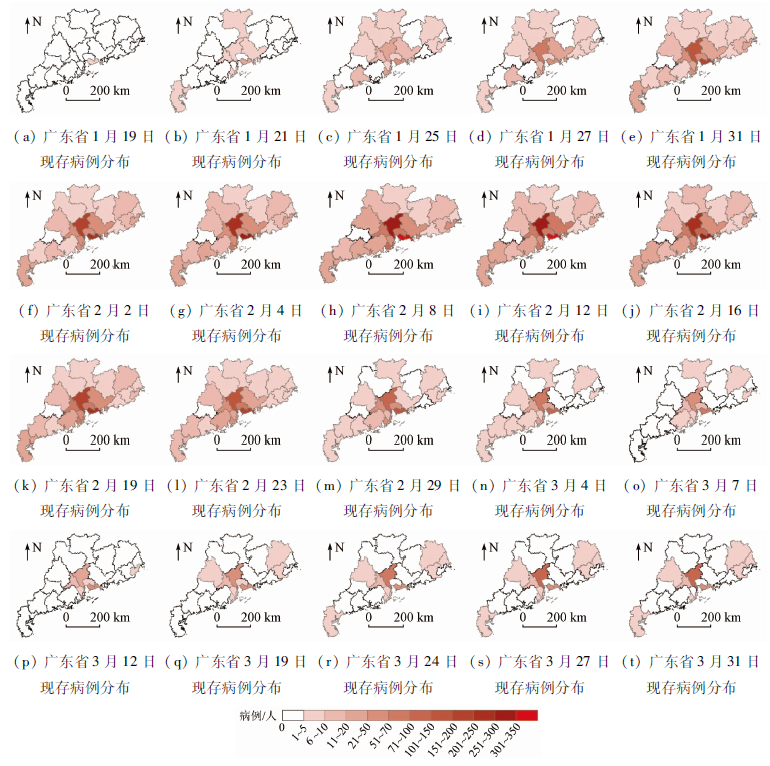
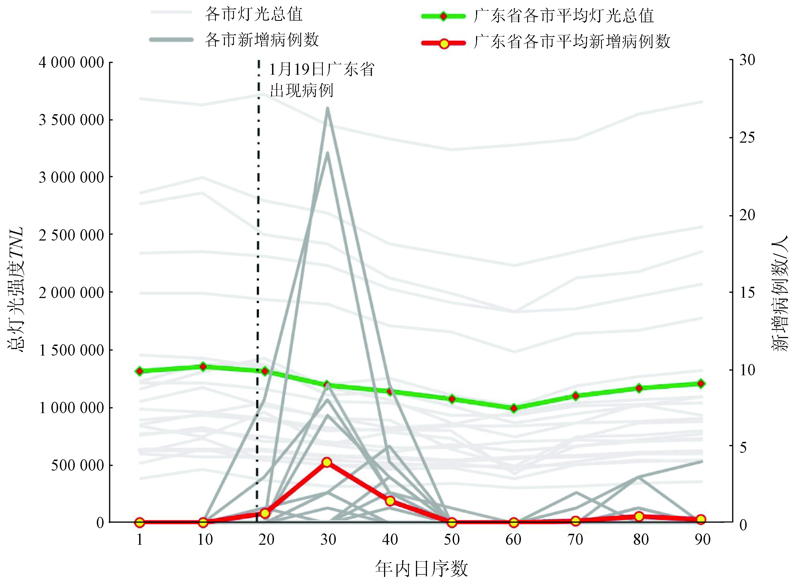
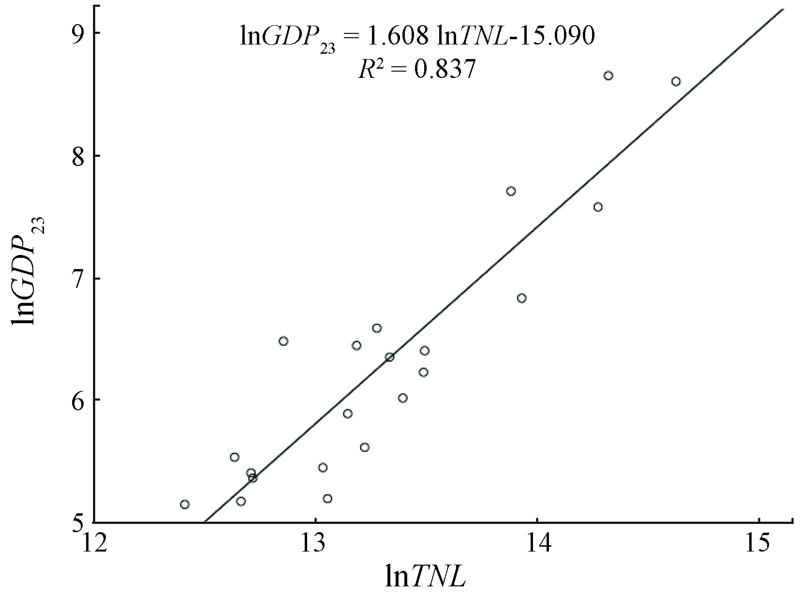
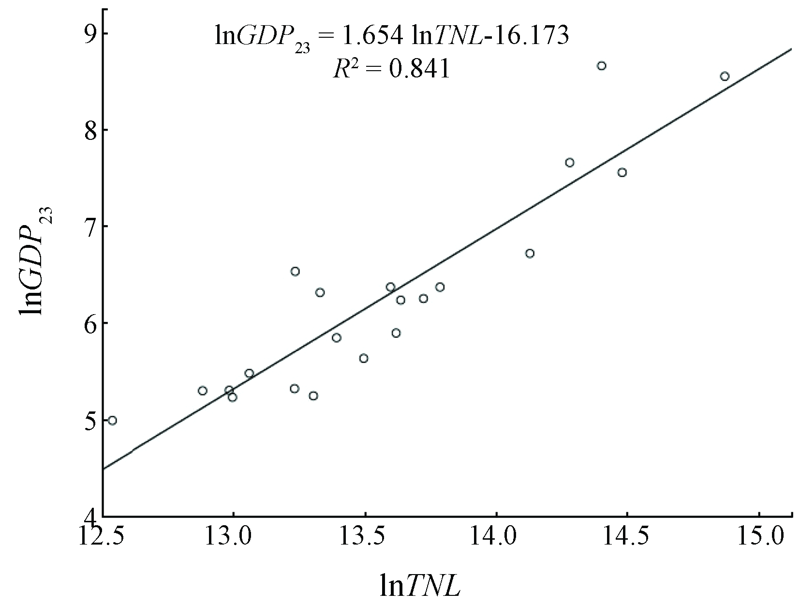
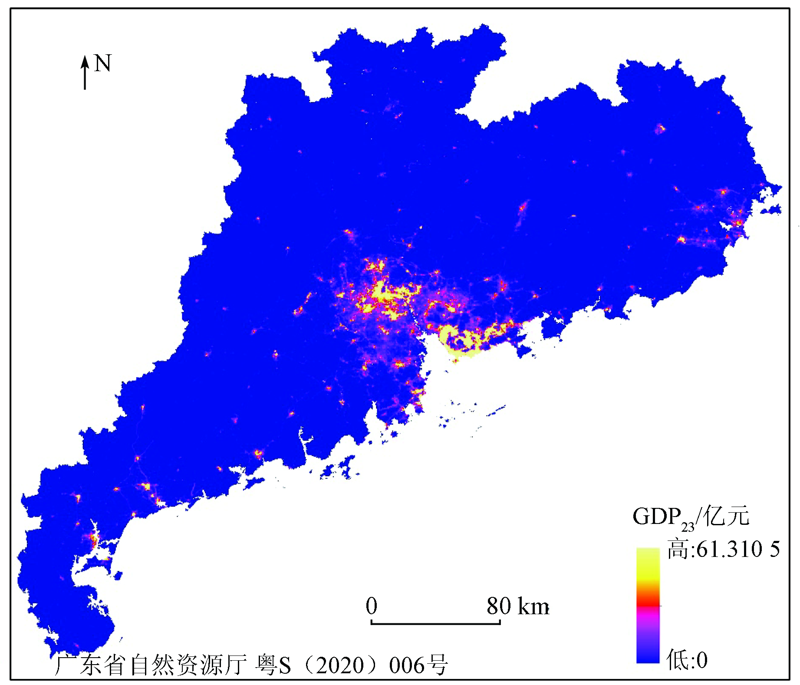
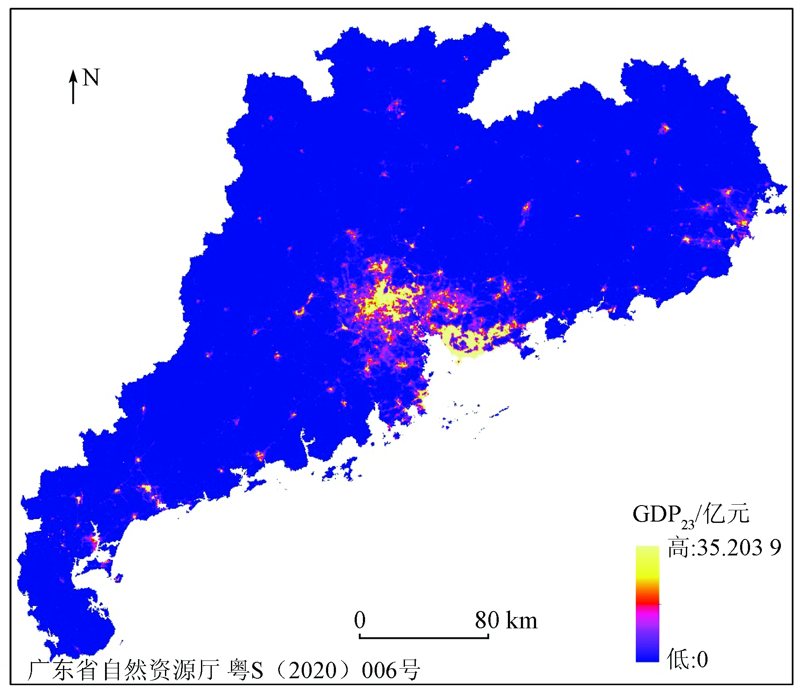
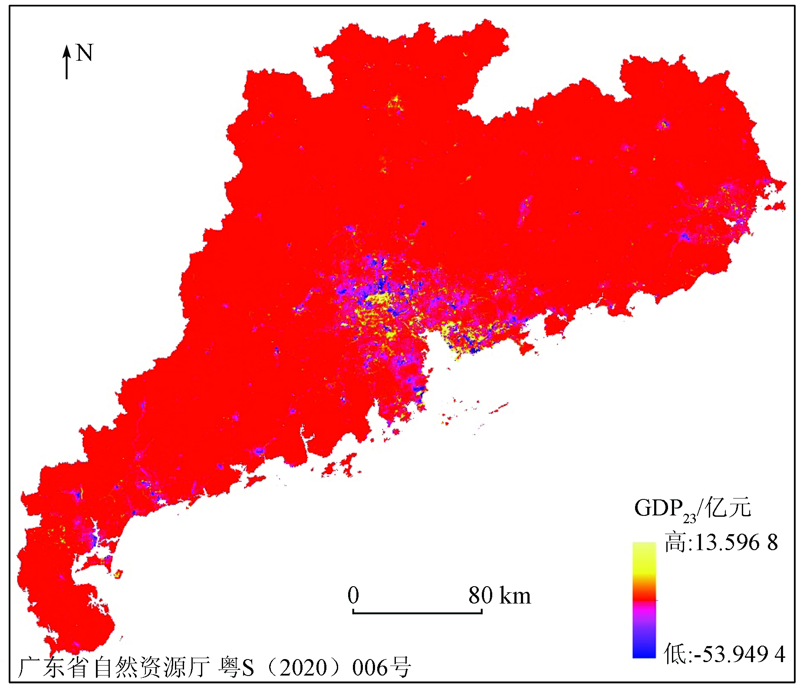
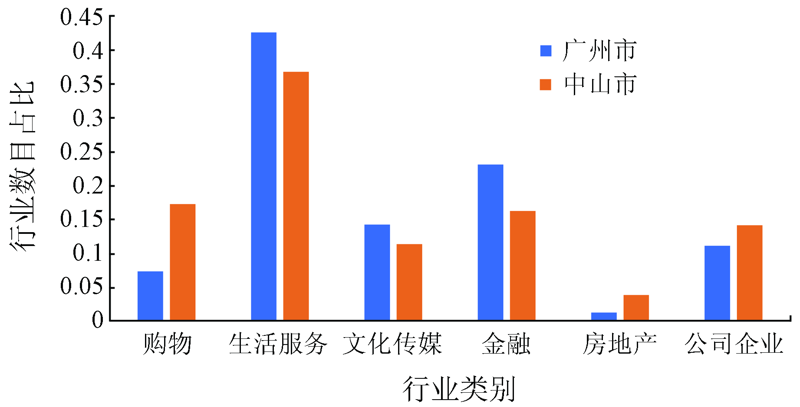
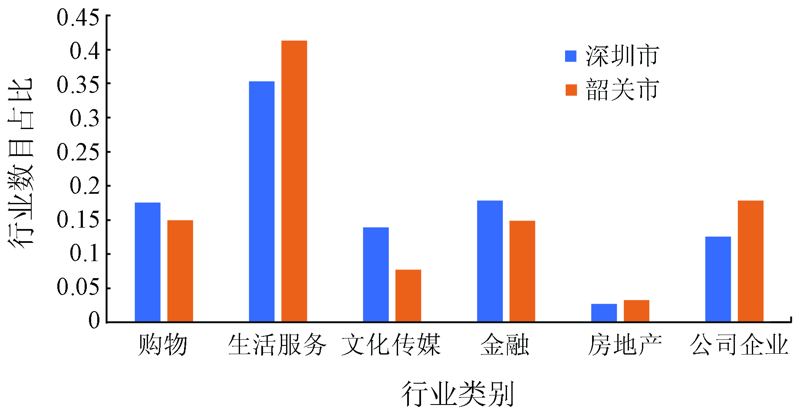
Abstract Gross Domestic Product (GDP) is commonly regarded as the best measure of a country's economic health. In 2020, China suffered from a relatively serious COVID-19 epidemic, which had a huge impact on economic development. This paper aims to accurately analyze the spatial and temporal variation pattern of the GDP contributed by the second and tertiary industries in Guangdong Province, China in the first quarter under the background of the epidemic. To this end, the remote sensing data of night-time light was taken as an indicator of GDP contributed by the secondary and tertiary industries (GDP 23). By combining the real-time monitoring data of the epidemic and point of interest (POI) data of Guangdong Province, the authors firstly determined that the epidemic was the factor that caused the decrease in urban total night light intensity (TNLI). Then they analyzed the fitting of various night light indices and different regression models to the GDP 23 of Guangdong Province. Based on this, the optimal index and model were selected for the spatial grid partition of GDP 23 and the comparison of GDP 23 with that in 2019. Afterward, the authors analyzed the impacts of COVID-19 on GDP 23 of Guangdong Province in the first quarter and the reasons from spatial-temporal perspectives according to the spatial simulation results of GDP 23. For the cities most affected by the epidemic, the most affected industries were obtained through the statistical analysis of POI data, aiming to scientifically guide the precise resumption of work and production in Guangdong Province. The results are as follows. The spatial distribution of GDP 23 in 2019 was highly consistent with that in 2020, and the heart of Guangdong's economic development consisted of Guangzhou, Shenzhen, Dongguan, and Foshan cities in the two years. In terms of temporal distribution, 21 cities in Guangdong Province were affected by COVID-19 at different degrees in 2020 compared to 2019. Among them, the cities with relatively developed economies were affected the most, including Shenzhen, Guangzhou, Dongguan, and Foshan. According to POI data and the spatial distribution difference of GDP 23 between 2019 and 2020, the cities having suffered the biggest economic impacts were Guangzhou and Zhongshan, where the leading industries included shopping, real estate, and enterprises and companies, while the cities with the highest increased amplitude of GDP 23 included Shaoguan and Shenzhen, where the leading industries consisted of finance, real estate, and shopping. Therefore, the provincial and municipal governments should formulate corresponding policies on the financial industry, life service industry, and shopping consumption in Guangzhou and Zhongshan cities, in order to accurately assist enterprises and companies to early resume work and production.
|
| Keywords
NPP-VIIRS data
GDP contributed by secondary and tertiary industries
spatialization
Guangdong Province
POI data
COVID-19
|
|
|
|
Corresponding Authors:
JIA Gongxu
E-mail: emailwangz@163.com;854628263@qq.com
|
|
Issue Date: 24 September 2021
|
|
|
| [1] |
徐梦洁, 陈黎, 刘焕金, 等. 基于DMSP/OLS夜间灯光数据的长江三角洲地区城市化格局与过程研究[J]. 国土资源遥感, 2011, 23(3):106-112.doi: 10.6046/gtzyyg.2011.03.19.
doi: 10.6046/gtzyyg.2011.03.19
|
| [1] |
Xu M J, Chen L, Liu H J, et al. Pattern and process of urbanization in the Yangtze Delta based on DMSP/OLS data[J]. Remote Sensing for Land and Resources, 2011, 23(3):106-112.doi: 10.6046/gtzyyg.2011.03.19.
doi: 10.6046/gtzyyg.2011.03.19
|
| [2] |
王晓慧, 肖鹏峰, 冯学智, 等. 基于DMSP/OLS数据的中国大尺度城镇用地信息提取[J]. 国土资源遥感, 2013, 25(3):159-164.doi: 10.6046/gtzyyg.2013.03.26.
doi: 10.6046/gtzyyg.2013.03.26
|
| [2] |
Wang X H, Xiao P F, Feng X Z, et al. Extraction of large-scale urban area information in China using DMSP/OLS nighttime light data[J]. Remote Sensing for Land and Resources, 2013, 25(3):159-164.doi: 10.6046/gtzyyg.2013.03.26.
doi: 10.6046/gtzyyg.2013.03.26
|
| [3] |
陈征, 胡德勇, 曾文华, 等. 基于TM图像和夜间灯光数据的区域城镇扩张监测——以浙江省为例[J]. 国土资源遥感, 2014, 26(1):83-89.doi: 10.6046/gtzyyg.2014.01.15.
doi: 10.6046/gtzyyg.2014.01.15
|
| [3] |
Chen Z, Hu D Y, Zeng W H, et al. TM image and nighttime light data to monitoring regional urban expansion:A case study of Zhejiang Province[J]. Remote Sensing for Land and Resources, 2014, 26(1):83-89.doi: 10.6046/gtzyyg.2014.01.15.
doi: 10.6046/gtzyyg.2014.01.15
|
| [4] |
Elvidge C D, Baugh K E, Kihn E A, et al. Relation between satellite observed visible-near infrared emissions,population,economic activity and electric power consumption[J]. International Journal of Remote Sensing, 1997, 18(6):1373-1379.
doi: 10.1080/014311697218485
url: https://www.tandfonline.com/doi/full/10.1080/014311697218485
|
| [5] |
Elvidge C D, Imhoff M L, Baugh K E, et al. Night-time lights of the world:1994-1995[J]. ISPRS Journal of Photogrammetry and Remote Sensing, 2001, 56(2):81-99.
doi: 10.1016/S0924-2716(01)00040-5
url: https://linkinghub.elsevier.com/retrieve/pii/S0924271601000405
|
| [6] |
李峰, 米晓楠, 刘军, 等. 基于NPP-VIIRS夜间灯光数据的北京市GDP空间化方法[J]. 国土资源遥感, 2016, 28(3):19-24.
|
| [6] |
Li F, Mi X N, Liu J, et al. Spatialization of GDP in Beijing using NPP-VIIRS data[J]. Remote Sensing for Land and Resources, 2016, 28(3):19-24.
|
| [7] |
郭永德, 高金环, 马洪兵. Suomi-NPP夜间灯光数据与GDP的空间关系分析[J]. 清华大学学报(自然科学版), 2016, 56(10):1122-1130.
|
| [7] |
Guo Y D, Gao J H, Ma H B. Spatial correlation analysis of Suomi-NPP nighttime light data and GDP data[J]. Journal of Tsinghua University (Natural Science edition), 2016, 56(10):1122-1130.
|
| [8] |
于丙辰, 刘玉轩, 陈刚. 基于夜光遥感与POI数据空间耦合关系的南海港口城市空间结构研究[J]. 地球信息科学学报, 2018, 20(6):854-861.
doi: 10.12082/dqxxkx.2018.180020
|
| [8] |
Yu B C, Liu Y X, Chen G. Urban spatial structure of port city in south China Sea Based on spatial coupling between nighttime light data and POI[J]. Journal of Geo-Information Science, 2018, 20(6):854-861.
|
| [9] |
宁波. 广东简介[N/OL]. 中国日报, 2009-10-09(10)[2020-10-20]. http://www.chinadaily.com.cn/dfpd/2009-10/09/content_8772777_2.html.
url: http://www.chinadaily.com.cn/dfpd/2009-10/09/content_8772777_2.html
|
| [9] |
Ning B. Introduction of Guangdong[N/OL]. China Daily, 2009-10-09(10)[2020-10-20]. http://www.chinadaily.com.cn/dfpd/2009-10/09/content_8772777_2.html.
url: http://www.chinadaily.com.cn/dfpd/2009-10/09/content_8772777_2.html
|
| [10] |
陈继奋, 刘蔚琴, 李文媛. 2018年广东省气候概况[J]. 广东气象, 2019, 41(6):5-8.
|
| [10] |
Chen J F, Liu W Q, Li W Y. A summary of the climate in Guangdong Province in 2018[J]. Guangdong Meteorology, 2019, 41(6):5-8.
|
| [11] |
周翼, 陈英, 刘洋, 等. NPP-VIIRS年度夜间灯光数据的合成方法与验证[J]. 遥感信息, 2019, 34(2):62-68.
|
| [11] |
Zhou Y, Chen Y, Liu Y, et al. Generation and verification of NPP-VIIRS annual nighttime light data[J]. Remote Sensing Information, 2019, 34(2):62-68.
|
| [12] |
Li X, Xu H, Chen X, et al. Potential of NPP-VIIRS nighttime light imagery for modeling the regional economy of China[J]. Remote Sensing, 2013, 5(6),3057-3081.
doi: 10.3390/rs5063057
url: http://www.mdpi.com/2072-4292/5/6/3057
|
| [13] |
韩向娣, 周艺, 王世新, 等. 夜间灯光遥感数据的GDP空间化处理方法[J]. 地球信息科学学报, 2012, 14(1):128-136.
doi: 10.3724/SP.J.1047.2012.00128
|
| [13] |
Han X T, Zhou Y, Wang S X, et al. GDP spatialization in China based on nighttime imagery[J]. Journal of Geo-information Science, 2012, 14(1):128-136.
doi: 10.3724/SP.J.1047.2012.00128
url: http://pub.chinasciencejournal.com/article/getArticleRedirect.action?doiCode=10.3724/SP.J.1047.2012.00128
|
| [14] |
卓莉, 史培军, 陈晋, 等. 20世纪90年代中国城市时空变化特征——基于灯光指数CNLI方法的探讨[J]. 地理学报, 2003(6):893-902.
|
| [14] |
Zhuo L, Shi P J, Chen J, et al. Application of compound night light index derived from DMSP/OLS data to urbanization analysis in China in the 1990s[J]. Acta Geographica Sinica, 2003(6):893-902.
|
| [15] |
陈晋, 卓莉, 史培军, 等. 基于DMSP/OLS数据的中国城市化过程研究——反映区域城市化水平的灯光指数的构建[J]. 遥感学报, 2003, 7(3):168-175.
|
| [15] |
Chen J, Zhuo L, Shi P J, et al. The study on urbanization process in China based on DMSP/OLS data:Development of a light index for urbanization level estimation[J]. Journal of Remote Sensing, 2003, 7(3):168-175.
|
| [16] |
叶靖, 杨小唤, 江东. 乡镇级人口统计数据空间化的格网尺度效应分析——以义乌市为例[J]. 地球信息科学学报, 2010, 12(1):40-47.
|
| [16] |
Ye J, Yang X H, Jiang D. The grid scale effect analysis of town leveled population statistical data spatialization[J]. Journal of Geo-information Science, 2010, 12(1):40-47.
doi: 10.3724/SP.J.1047.2010.00040
url: http://pub.chinasciencejournal.com/article/getArticleRedirect.action?doiCode=10.3724/SP.J.1047.2010.00040
|
| [17] |
李月娇, 杨小唤, 王静. 基于景观生态学的人口空间数据适宜格网尺度研究——以山东省为例[J]. 地理与地理信息科学, 2014, 30(1):97-100.
|
| [17] |
Li Y J, Yang X H, Wang J. Grid size suitability of population spatialization distribution in Shandong Province based on landscape ecology[J]. Geography and Geo-information Science, 2014, 30(1):97-100.
|
|
Viewed |
|
|
|
Full text
|
|
|
|
|
Abstract
|
|
|
|
|
Cited |
|
|
|
|
| |
Shared |
|
|
|
|
| |
Discussed |
|
|
|
|
 2021,
Vol. 33
2021,
Vol. 33