|
|
|
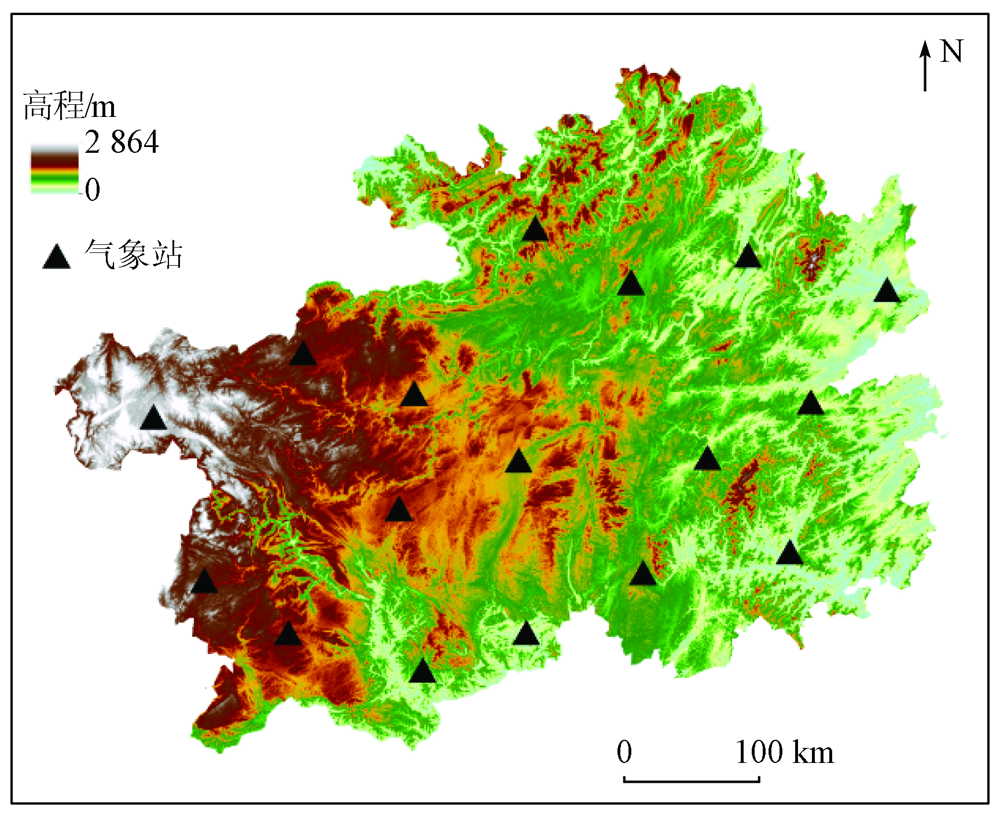
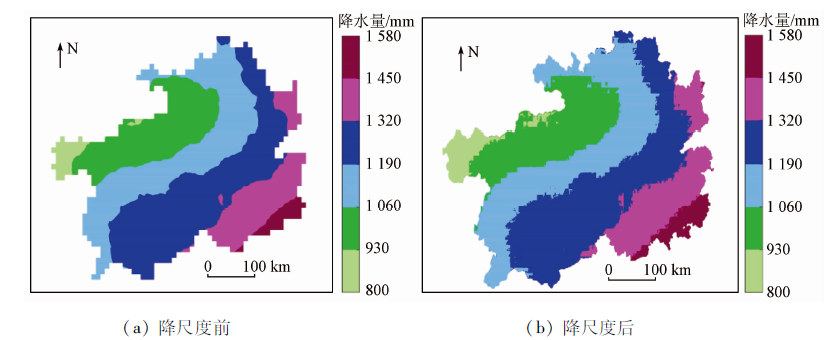
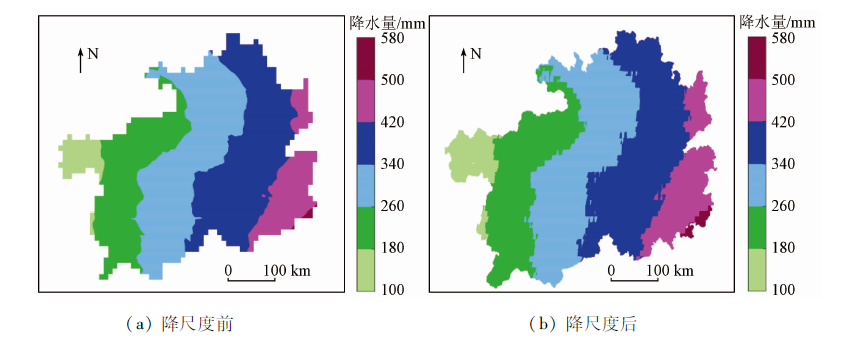
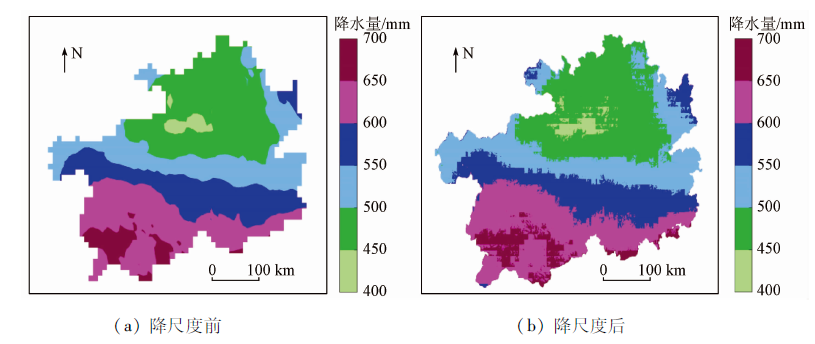
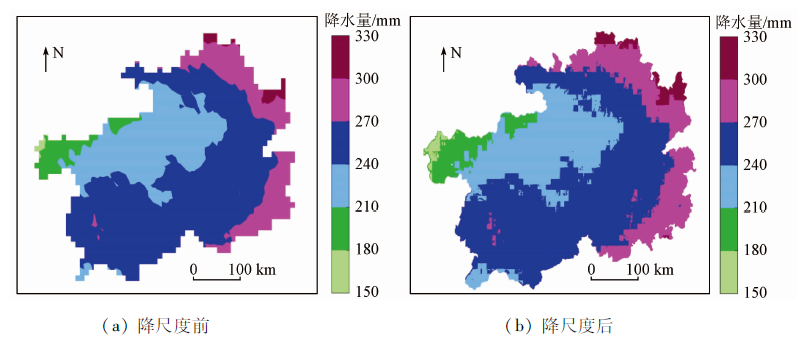
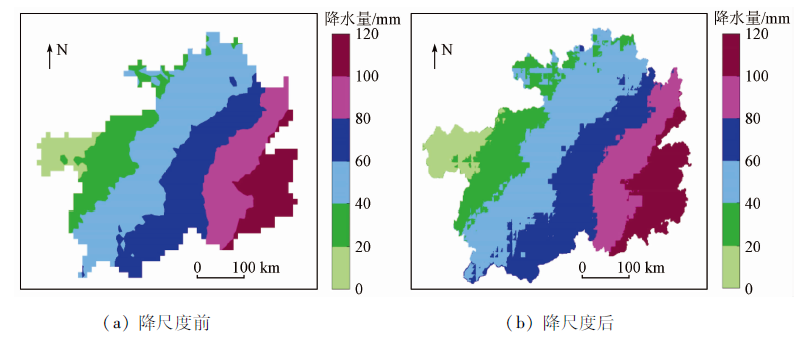
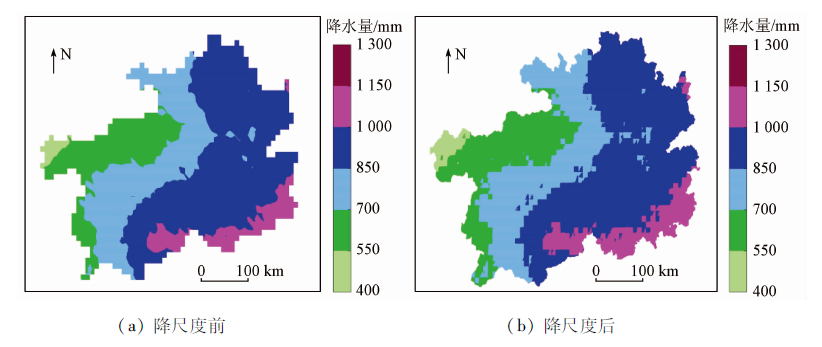
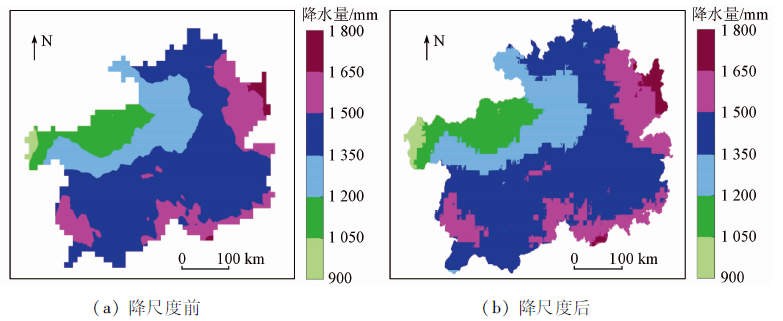
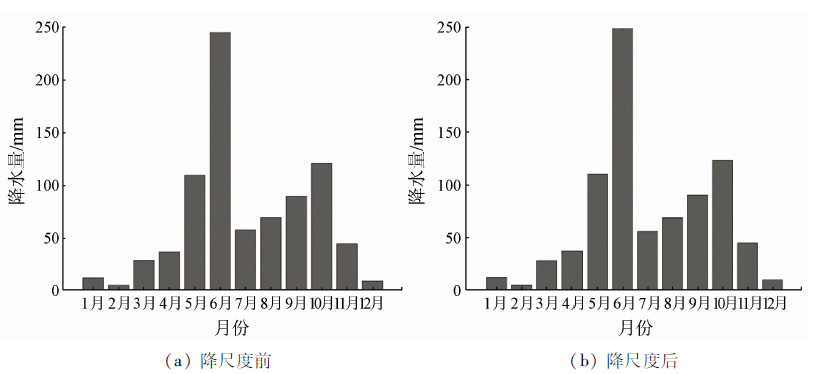
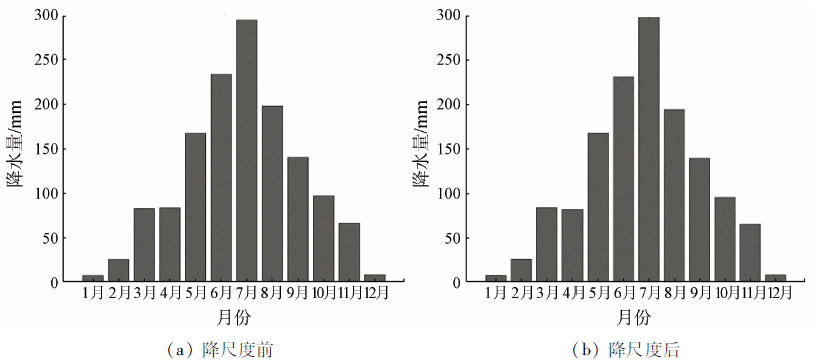
Abstract To improve the spatial resolution and expand the application scopes of GPM precipitation products, the downscaling study of GPM precipitation products was conducted based on the precipitation data of Guizhou Province by establishing multiple spatial downscaling models. Firstly, with the topographic factors including longitude, latitude, elevation, slope, and aspect as explanatory variables and the original GPM precipitation data as target variables, multiple downscaling models were established based on the methods of multivariate linear regression, geographically weighted regression, extreme learning machine, support vector machine, and random forest regression. Then multiyear average precipitation data were applied and assessed, and the optimal model was selected to conduct the spatial downscaling study of the annual and monthly precipitation amount in typical years in Guizhou Province. According to the results, the downscaling models except for the random forest regression model all performed well. Most especially, the multivariate linear regression model performed the most stably and effectively and yielded the highly improved downscaling results in terms of observation accuracy and spatial correlation. This study will provide a set of high-resolution gridded precipitation products for Guizhou Province and provide support for regional hydrometeorological research.
|
| Keywords
Guizhou Province
GPM
spatial downscaling
multivariate linear regression
geographically weighted regression
extreme learning machine
|
|
|
|
Corresponding Authors:
WANG Dagang
E-mail: duyi19930922@163.com;wangdag@mail.sysu.edu.cn
|
|
Issue Date: 23 December 2021
|
|
|
| [1] |
史岚, 何其全, 杨娇, 等. 闽浙赣地区GPM IMERG降水产品降尺度建模与比较分析[J]. 地球信息科学学报, 2019,21(10):1642-1652.
doi: 10.12082/dqxxkx.2019.180603
|
| [1] |
Shi L, He Q Q, Yang J, et al. Downscaling modeling of the GPM IMERG precipitation product and comparative analysis in the Fujian-Zhejiang-Jiangxi region[J]. Journal of Geo-Infomation Science, 2019,21(10):1642-1652.
|
| [2] |
唐国强, 万玮, 曾子悦, 等. 全球降水测量(GPM)计划及其最新进展综述[J]. 遥感技术与应用, 2015,30(4):607-615.
|
| [2] |
Tang G Q, Wan W, Zeng Z Y, et al. An overview of the global precipitation measurement (GPM) mission and it’s latest development[J]. Remote Sensing Technology and Application, 2015,30(4):607-615.
|
| [3] |
Immerzeel W W, Rutten M M, Droogers P. Spatial downscaling of TRMM precipitation using vegetative response on the Iberian Peninsula[J]. Remote Sensing of Environment, 2009,113(2):362-370.
doi: 10.1016/j.rse.2008.10.004
url: https://linkinghub.elsevier.com/retrieve/pii/S0034425708003155
|
| [4] |
Jia S F, Zhu W B, Lyu A F, et al. A statistical spatial downscaling algorithm of TRMM precipitation based on NDVI and DEM in the Qaidam basin of China[J]. Remote sensing of Environment, 2011,115(12):3069-3079.
doi: 10.1016/j.rse.2011.06.009
url: https://linkinghub.elsevier.com/retrieve/pii/S0034425711002331
|
| [5] |
Zhang Y Y, Li Y G, Ji X, et al. Fine-resolution precipitation mapping in a mountainous watershed:Geostatistical downscaling of TRMM products based on environmental variables[J]. Remote Sensing, 2018,10(1):1-27.
doi: 10.3390/rs10010001
url: http://www.mdpi.com/2072-4292/10/1/1
|
| [6] |
胡实, 韩建, 占车生, 等. 太行山区遥感卫星反演降雨产品降尺度研究[J]. 地理研究, 2020,39(7):1680-1690.
doi: 10.11821/dlyj020190545
|
| [6] |
Hu S, Han J, Zhan C S, et al. Spatial downscaling of remotely sensed precipitation in Taihang Mountains[J]. Geographical Research, 2020,39(7):1680-1690.
|
| [7] |
马金辉, 屈创, 张海筱, 等. 2001—2010年石羊河流域上游TRMM降水资料的降尺度研究[J]. 地理科学进展, 2013,32(9):1423-1432.
doi: 10.11820/dlkxjz.2013.09.012
|
| [7] |
Ma J H, Qu C, Zhang H X, et al. Spatial downscaling of TRMM precipitation data based on DEM in the upstream of Shiyang River basin during 2001—2010[J]. Progress in Geography, 2013,32(9):1423-1432.
|
| [8] |
蔡明勇, 吕洋, 杨胜天, 等. 雅鲁藏布江流域TRMM降水数据降尺度研究[J]. 北京师范大学学报(自然科学版), 2017,53(1):111-119,2.
|
| [8] |
Cai M Y, Lv Y, Yang S T, et al. TRMM precipitation downscaling in the data scarce Yarlung Zangbo River basin[J]. Journal of Beijing Normal University(Natural Science), 2017,53(1):111-119,2.
|
| [9] |
吴健, 周秋文, 韦小茶, 等. TRMM降水产品在喀斯特地区的空间降尺度研究——以贵州省为例[J]. 人民珠江, 2019,40(6):20-26,53.
|
| [9] |
Wu J, Zhou Q W, Wei X C, et al. Spatial downscaling research of TRMM precipitation products in karst region:A case study of Guizhou province[J]. Pearl River, 2019,40(6):20-26,53.
|
| [10] |
樊东, 薛华柱, 董国涛, 等. 基于二次多项式回归模型的黑河流域TRMM数据降尺度研究[J]. 水土保持研究, 2017,24(2):146-151.
|
| [10] |
Fan D, Xue H Z, Dong G T, et al. Downscaling study on TRMM 3B43 data of the Heihe river basin based on quadratic polynomial regression model[J]. Research of Soil and Water Conservation, 2017,24(2):146-151.
|
| [11] |
刘小婵, 张洪岩, 赵建军, 等. 东北地区TRMM数据降尺度的GWR模型分析[J]. 地球信息科学学报, 2015,17(9):1055-1062.
|
| [11] |
Liu X C, Zhang H Y, Zhao J J, et al. Spatial downscaling of TRMM precipitation data based on GWR model in Northeast China[J]. Journal of Geo-Information Science, 2015,17(9):1055-1062.
|
| [12] |
曾业隆, 谭伟, 王超, 等. 基于GWR模型的贵州喀斯特山区TRMM 3B43降水资料降尺度分析[J]. 干旱气象, 2018,36(3):405-414.
|
| [12] |
Zeng Y L, Tan W, Wang C, et al. Spatial downscaling of TRMM 3B43 precipitation data based on GWR model in karst mountainous area of Guizhou Province[J]. Journal of Arid Meteorology, 2018,36(3):405-414.
|
| [13] |
熊俊楠, 李伟, 刘志奇, 等. 基于GWR模型的青藏高原地区TRMM数据降尺度研究[J]. 国土资源遥感, 2019,31(4):88-95.doi: 10.6046/gtzyyg.2019.04.12.
doi: 10.6046/gtzyyg.2019.04.12
|
| [13] |
Xiong J N, Li W, Liu Z Q, et al. Research on downscaling of TRMM data in the Tibetan Plateau based on GWR model[J]. Remote Sensing for Land and Resources, 2019,31(4):88-95.doi: 10.6046/gtzyyg.2019.04.12.
doi: 10.6046/gtzyyg.2019.04.12
|
| [14] |
徐彬仁, 魏瑗瑗. 基于随机森林算法对青藏高原TRMM降水数据进行空间统计降尺度研究[J]. 国土资源遥感, 2018,30(3):181-188.doi: 10.6046/gtzyyg.2018.03.25.
doi: 10.6046/gtzyyg.2018.03.25
|
| [14] |
Xu B R, Wei Y Y. Spatial statistics of TRMM precipitation in the Tibetan Plateau using random forest algorithm[J]. Remote Sensing for Land and Resources, 2018,30(3):181-188.doi: 10.6046/gtzyyg.2018.03.25.
doi: 10.6046/gtzyyg.2018.03.25
|
| [15] |
沈思民, 赵军, 刘佳茹, 等. 祁连山TRMM降水数据降尺度不同方法比较研究[J]. 山地学报, 2019,37(6):923-931.
|
| [15] |
Shen S M, Zhao J, Liu J R, et al. Comparative study on different downscaling methods of TRMM satellite precipitation data over the Qilian Mountains,China[J]. Mountain Research, 2019,37(6):923-931.
|
| [16] |
范雪薇, 刘海隆. 天山山区TRMM降水数据的空间降尺度研究[J]. 自然资源学报, 2018,33(3):478-488.
|
| [16] |
Fan X W, Liu H L. Downscaling method of TRMM satellite precipitation data over the Tianshan Mountains[J]. Journal of Natural Resources, 2018,33(3):478-488.
|
| [17] |
李净, 张晓. TRMM降水数据的空间降尺度方法研究[J]. 地理科学, 2015,35(9):1164-1169.
doi: 10.13249/j.cnki.sgs.2015.09.1164
|
| [17] |
Li J, Zhang X. Downscaling method of TRMM satellite precipitation data[J]. Scientia Geographica Sinica, 2015,35(9):1164-1169.
|
| [18] |
Brunsdon C, Fotheringham A S, Charlton M E. Geographically weighted regression:A method for exploring spatial nonstationarity[J]. Geographical Analysis, 1999,28(4):281-298.
doi: 10.1111/gean.1996.28.issue-4
url: http://doi.wiley.com/10.1111/gean.1996.28.issue-4
|
| [19] |
雷蕾, 程志刚, 冯冬蕾, 等. 近16年秦巴山区TRMM降水资料的降尺度研究[J]. 成都信息工程大学学报, 2018,33(2):190-196.
|
| [19] |
Lei L, Cheng Z G, Feng D L, et al. Statistical downscaling of TRMM precipitation data in Qinling-Daba Mountains area in recent 16 years[J]. Journal of Chengdu University of Information Technology, 2018,33(2):190-196.
|
| [20] |
李豪, 雷苑. 复杂地形下TRMM降水数据的降尺度研究:四川省为例[J]. 中国农业气象, 2019,40(10):607-619.
|
| [20] |
Li H, Lei Y. Spatial downscaling of TRMM precipitation data in areas of complex terrain:A case study in Sichuan Province[J]. Chinese Journal of Agrometeorology, 2019,40(10):607-619.
|
| [21] |
Huang G B, Zhu Q Y, Siew C K. Extreme learning machine:Theory and applications[J]. Neurocomputing, 2006,70(1):489-501.
doi: 10.1016/j.neucom.2005.12.126
url: https://linkinghub.elsevier.com/retrieve/pii/S0925231206000385
|
| [22] |
Huang G B, Chen L. Letters:Convex incremental extreme learning machine[J]. Neurocomputing, 2007,70(16):3056-3062.
doi: 10.1016/j.neucom.2007.02.009
url: https://linkinghub.elsevier.com/retrieve/pii/S0925231207000677
|
| [23] |
Cortes C, Vapnik V. Support-vector networks[J]. Machine Learning, 1995(20):273-297.
|
| [24] |
Vapnik V. The Nature of statistical learning theory[M]. New York:Springer Verlag, 1995.
|
| [25] |
Breiman L. Random forests[J]. Machine Learning, 2001,45(1):5-32.
doi: 10.1023/A:1010933404324
url: http://link.springer.com/10.1023/A:1010933404324
|
|
Viewed |
|
|
|
Full text
|
|
|
|
|
Abstract
|
|
|
|
|
Cited |
|
|
|
|
| |
Shared |
|
|
|
|
| |
Discussed |
|
|
|
|
 2021,
Vol. 33
2021,
Vol. 33
 ), WANG Dayang, WANG Dagang(