

0 引言
国内外研究者对土地利用变化的研究主要集中在土地利用时空变化特征[9]、土地利用变化机制或驱动力[10]、土地利用变化的环境影响[11]等方面,少有涉及连续长时间序列的土地内部结构详细转移过程与模拟。从研究区域上看,多数研究集中在东部沿海经济发达的城市区域[12,13],而着眼于西北干旱区经济较为落后的典型人工绿洲区域的研究甚少。同时,城市区域的土地利用变化研究所使用的数据源多为典型时间断面的单时相遥感影像和单一的社会统计数据[14],不仅未能有效捕捉连续性信息和解译更精细土地利用分类结果,特别是造成一些关键突变点或拐点信息的遗漏,而且也不能全面反映研究区地形地貌、路网和气象情况。因此,基于连续长时间序列的多时相遥感影像和多数据源(地形地貌、路网、气象和社会统计数据等)对人工绿洲区域的土地利用内部结构转变过程及定量模拟机制研究仍需进一步加强。
阿拉尔垦区位于我国西北干旱地区,属于典型的人工绿洲区域,垦区内荒漠区域的自然土壤表层常覆有一层盐结皮以防止水分流失,保护土壤内部结构,过度的土地开发利用破坏了表层盐结皮,加速了水分流失,影响了土壤水分和大气循环系统。同时,阿拉尔垦区紧邻塔克拉玛干沙漠,自然环境恶劣,常出现大风、扬尘和沙暴等极端天气,自然状态下的盐结皮能抵抗10级风的侵蚀,而表层盐结皮破坏后3级风就能引起扬尘,严重影响空气质量[15]。此外,植被也是研究区的天然生态屏障[16],但自然植被对生态系统的维护能力大于人工植被,而阿拉尔垦区内的植被以人工植被(农作物和经济林)为主,自然植被(林草地)为辅,且农作物多为1 a生植物,极易受到破坏。因此,有必要对垦区进行土地利用变化和模拟研究,为未来土地利用规划提供科学依据。
本研究以西北干旱区典型人工绿洲阿拉尔垦区为例,收集1990—2019年所有可用Landsat遥感影像、地形地貌、路网、气象和社会统计数据,将逐年各月份影像进行多时相合成,使用支持向量机(support vector machine,SVM)分类方法,辅以2019年高分二号遥感影像及野外勘察对多时相合成后影像进行解译分类,获得逐年土地利用分类图,从面积变化、类型转化、空间动态变化3方面进行土地利用变化分析,选用CA(cellular automaton)-Markov模型对阿拉尔垦区2010年土地利用情况进行模拟并与真实情况比较,验证模拟模型的可靠性后,模拟2050年和2080年的土地利用情景,探究长时序土地利用类型面积的突变情况和驱动因素,进一步说明了CA-Markov模拟模型的优势,为典型人工绿洲区域的生态环境综合管理和宏观的土地资源与社会经济统筹管理提供理论依据。
1 研究区概况
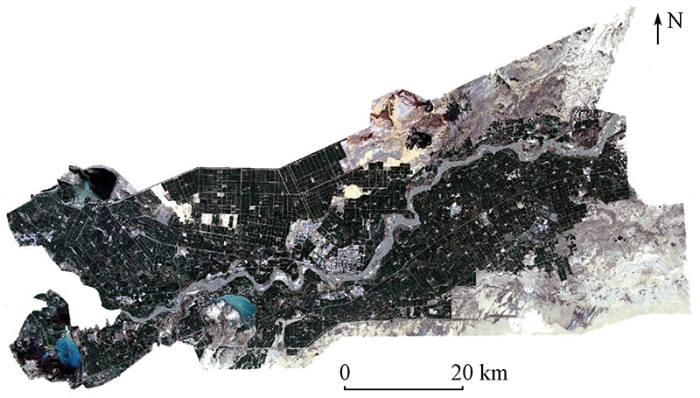
阿拉尔垦区位于新疆维吾尔自治区阿克苏地区,地处塔克拉玛干沙漠和天山山脉的交汇过渡地带,地理坐标为E80°30'~81°58',N40°22'~40°57'(图1),总面积4 105.92 km2。阿拉尔垦区地势相对平坦,气象多变,常有沙暴、扬尘和霜冻等灾害,全年降水少蒸发大; 生态系统属于荒漠—绿洲型,土壤表层常常附有一层盐结皮,以防土壤水分蒸发; 垦区种植结构单一,大面积种植棉花。
图1
2 材料与方法
2.1 遥感数据源及其预处理
从美国USGS网站中(
图2
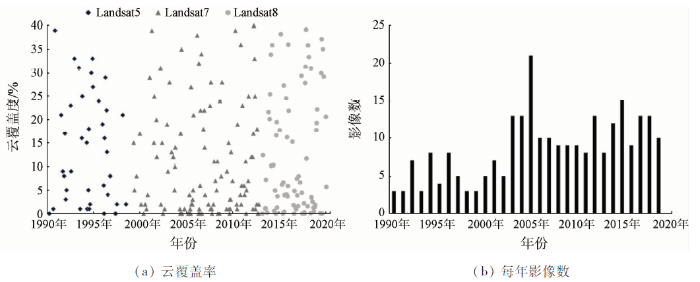
从图2可看出各影像云覆盖度情况多低于10 %,由于Landsat系列传感器不断更新,因此本文1990—1998年选用Landsat5,1999—2012年选用Landsat7,2013—2019年选用Landsat8影像,避免了多传感器合成所带来的误差,且每年影像数至少有3景。
为了进一步提高土地利用分类精确度,将所有影像逐一进行预处理,其中包括辐射定标、大气校正、配准、裁剪等操作,并提取各景影像的归一化植被指数(normalized difference vegetation index,NDVI),计算公式为:
式中: NIR为Landsat近红外波段反射率; R为红光波段反射率。
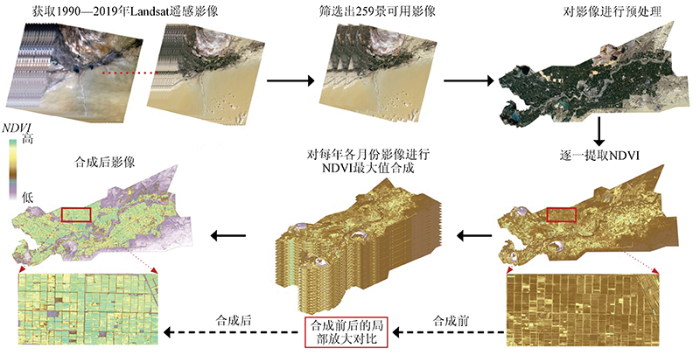
将每年各月份影像进行NDVI最大值合成,得到逐年植被覆盖最全面的情景,从数据源方面提高分类精度,相关影像的合成流程如图3所示,对影像合成前后的局部放大对比中可以看出,NDVI最大值合成后的影像植被覆盖度更高,利于解译分类。
图3
2.2 土地利用分类方法
表1 阿拉尔垦区分类体系及解译标志
Tab.1
| 类型 | 地表特征 | 影像特征 | 影像 | 照片 |
|---|---|---|---|---|
| 耕地 | 棉地、小麦地、玉米地、高粱地等 | 浅绿色,形状规则,一般为长条,均匀分布 | ||
| 林草地 | 胡杨林、草场、柽柳等 | 黄色或深黄色,形状不规则,一般分布在河流、道路两侧以及偏远地区 | ||
| 园地 | 苹果地、枣地、葡萄地、香梨地等 | 黄色,形状相对规则,多呈矩形,有明显边界线,连片分布 | ||
| 水体 | 河流、沟渠、水库等 | 白色或浅紫色,形状规则,有明显边界线 | ||
| 建设用地 | 城镇、学校、广场、工业用地等 | 灰色或深紫色,形状规则,周边常有规则的行道树,有明显边界线,连片分布 | ||
| 未利用地 | 湿地、裸石、盐碱地、沙地等 | 灰色或深紫色,形状不规则,多分布于偏远地区 | ||
图4
图4
每类样本点个数和分布
Fig.4
Number and distribution of sample points for each category
图5
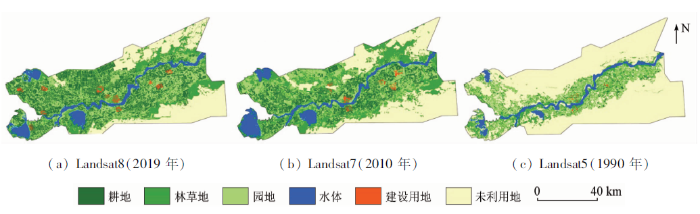
表2 不同数据源的精度评价
Tab.2
| 土地利用类型 | Landsat8 (2019年) | Landsat7 (2010年) | Landsat5 (1990年) | |||
|---|---|---|---|---|---|---|
| 制图精 度/% | 用户精 度/% | 制图精 度/% | 用户精 度/% | 制图精 度/% | 用户精 度/% | |
| 耕地 | 93.19 | 90.14 | 91.30 | 89.91 | 90.55 | 88.43 |
| 林草地 | 87.49 | 93.47 | 85.81 | 93.41 | 85.14 | 92.36 |
| 园地 | 76.46 | 94.52 | 75.55 | 93.52 | 75.22 | 92.18 |
| 水体 | 84.18 | 95.65 | 82.06 | 93.98 | 81.36 | 92.46 |
| 建设用地 | 82.76 | 82.11 | 82.58 | 81.04 | 81.17 | 80.17 |
| 未利用地 | 98.27 | 88.66 | 98.16 | 86.74 | 97.01 | 85.12 |
| Kappa系数 | 0.88 | 0.85 | 0.82 | |||
| 总体精度/% | 90.05 | 89.82 | 88.29 | |||
2.3 土地利用变化分析方法
从各土地利用类型的面积变化、类型转化和空间动态变化3方面对阿拉尔垦区土地利用变化展开分析。基于ArcGIS软件的空间分析功能,对各时间段起始年份和终止年份的分类后影像进行分析,并制作各土地利用类型变化的转移矩阵和空间动态分布图。
2.4 土地利用模拟数据的收集与处理
高程数据从中国科学院计算机网络信息中心国际科学数据镜像网站中获取,在ArcGIS软件中对高程数据进行重采样得到坡度和坡向信息,利用Near工具得到每个栅格到高速、铁路、公路和水系的距离; 气温和降水数据从中国气象科学数据共享网中获取,并进行反距离权重(inverse distance weight,IDW)空间插值得到气温和降水的空间分布情况; 人口、GDP、全社会固定资产投资、第一产业、农业生产总值和棉花价格从《新疆生产建设兵团统计年鉴》(1990—2019年)中获取,并利用多因子权重分配法将以阿拉尔垦区为基本统计单元的统计数据分布到栅格单元上。
2.5 基于CA-Markov模型的土地利用模拟
马尔科夫(Markov)模型侧重于对土地利用变化数量的预测,缺乏对各土地利用类型的空间性表达,而CA模型能表达空间系统的时空动态演化过程。将Markov模型和CA模型结合(CA-Markov模型)[23]进行土地利用类型空间动态变化的模拟和预测,其既能够对土地利用的数量变化进行表达,也能对空间动态变化进行演示。
利用IDRISI软件中的CA-Markov功能,首先利用1990—1999年10期土地利用数据和收集的15种影响因素数据,模拟阿拉尔垦区2010年的土地利用变化情况并与2010年真实土地利用情况进行比较。对模拟图像进行精度检验,以验证CA-Markov模型模拟的可靠性,使用1990—2019年30期土地利用数据和相关影响因素数据模拟出2050年和2080年的土地利用变化情况。
3 结果与分析
3.1 阿拉尔垦区土地利用变化分析
3.1.1 面积变化分析
图6
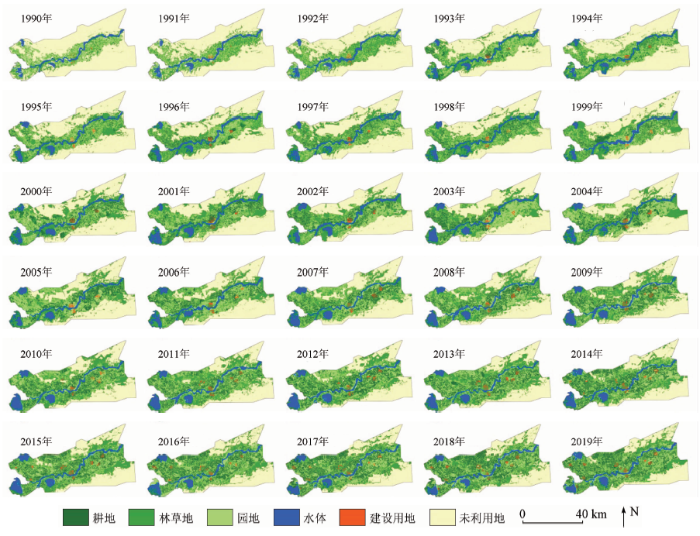
图6
1990—2019年阿拉尔垦区土地利用变化情况
Fig.6
Land use change in Alar reclamation area from 1990 to 2019
图7
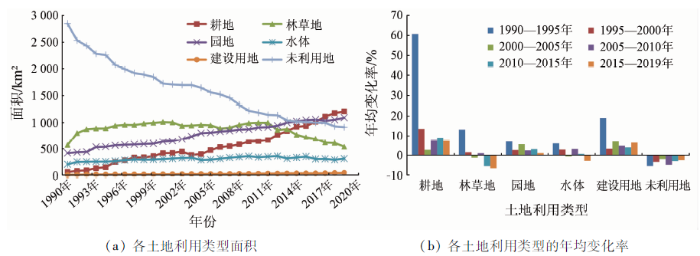
图7
1990—2019年阿拉尔垦区各土地利用类型的面积变化情况
Fig.7
The area change of land use types in Alar reclamation area from 1990 to 2019
3.1.2 类型转化分析
1990—2019年阿拉尔垦区各土地利用类型的转化情况如表3所示。阿拉尔垦区耕地面积增加1 516.19 km2,减少368.99 km2,净变化量为1 147.2 km2,耕地面积的净增加主要是由未利用地转化而来; 林草地面积减少了39.63 km2,主要被转化成耕地; 园地由未利用地转化了1 160.44 km2; 水体面积增加主要由未利用地转化; 建设用地面积的增加主要是由耕地转化而来; 未利用地减少了1 934.48 km2,主要被开垦为园地和耕地。
表3 1990—2019年阿拉尔垦区各土地利用类型的变化转换矩阵
Tab.3
| 1990年 | |||||||
|---|---|---|---|---|---|---|---|
| 2019年 | 耕地 | 林草地 | 园地 | 水体 | 建设用地 | 未利用地 | 合计 |
| 耕地 | — | 14.09 | 832.59 | 4.94 | 0.00 | 664.57 | 1 516.19 |
| 林草地 | 0.38 | — | 0.36 | 0.58 | 0.00 | 4.64 | 5.97 |
| 园地 | 349.64 | 8.81 | — | 15.69 | 0.00 | 1 160.44 | 1 534.58 |
| 水体 | 2.86 | 6.77 | 15.84 | — | 0.00 | 103.36 | 128.82 |
| 建设用地 | 16.11 | 8.60 | 11.59 | 0.04 | — | 1.48 | 37.82 |
| 未利用地 | 0.00 | 1.36 | 0.00 | 0.00 | 1.28 | — | 2.64 |
| 合计 | 368.99 | 39.63 | 860.38 | 21.25 | 1.28 | 1 934.48 | |
不同时间段各土地利用类型变化特征不同(图8),1990—2000年,除未利用地外,各土地利用类型面积净变化量均增加; 2000—2010年,林草地、园地和未利用地面积净变化量均减少,分别为-14.37 km2,-272.63 km2和-536.23 km2; 2010—2019年,林草地、水体和未利用地面积净变化量为减少; 1990—2019年,耕地、园地和未利用地净变化量最明显,分别为1 147.19 km2,674.19 km2和-1 931.84 km2。
图8
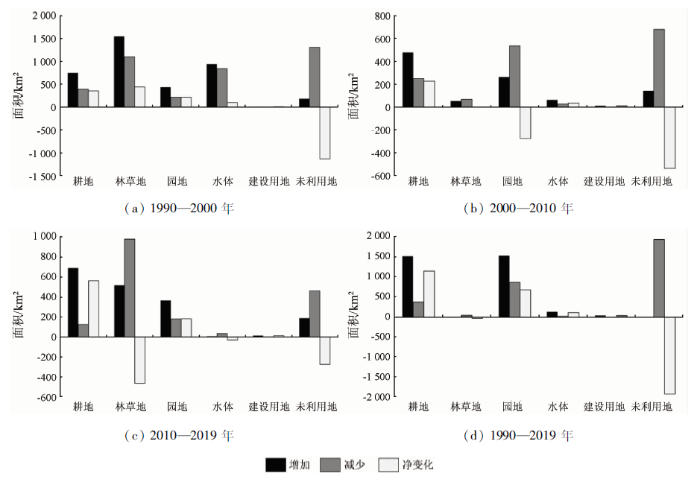
图8
阿拉尔垦区在不同时间段的土地利用变化特征
Fig.8
Characteristics of land use change in Alar reclamation area in different time periods
3.1.3 空间动态变化分析阿拉尔垦区不同时间段土地利用空间动态变化情况如图9所示。1990—2000年,未利用地发生了大面积开垦,主要分布在阿拉尔垦区中部; 2000—2010年,耕地、林草地和园地3种之间的相互转化主要分布在塔里木河沿岸区域; 2010—2019年,未利用地的开垦面积相对较少,主要分布在垦区东北和东南部; 1990—2019年,塔里木河沿岸区域主要发生的是耕地、林草地和园地之间的转化,沿岸区域之外的地方主要发生的是未利用地的开垦。
图9
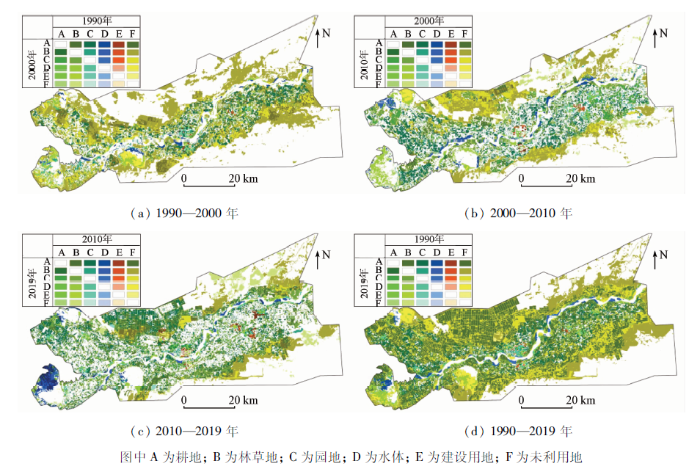
图9
阿拉尔垦区在不同时间段的土地利用动态变化
Fig.9
Dynamic changes of land use in Alar reclamation area in different time periods
3.2 阿拉尔垦区2010年土地利用模拟和精度检验
将阿拉尔垦区2010年实际情况和模拟后结果进行对比(图10),可以看出大部分区域一致,只有一些地区存在细微差异,如中心区域的建设用地、东北和东南部的林草地。
图10
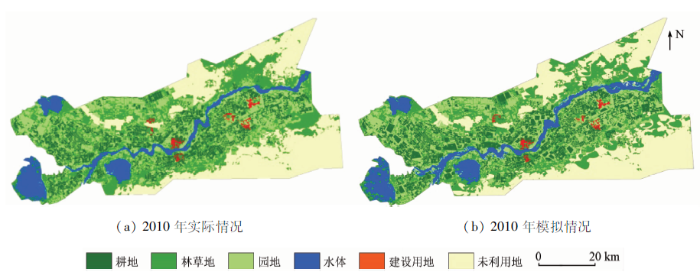
图10
2010年阿拉尔垦区土地利用的实际及模拟情况对比
Fig.10
Comparison of real and simulated situation of land use in Alar reclamation area in 2010
表4 阿拉尔垦区2010年土地利用模拟的精度评价
Tab.4
| 预测类别 | 合计 | 用户精度/% | ||||||
|---|---|---|---|---|---|---|---|---|
| 真实类别 | 耕地 | 林草地 | 园地 | 水体 | 建设用地 | 未利用地 | ||
| 耕地 | 54 617 | 750 | 923 | 0 | 867 | 2 667 | 59 824 | 91.30 |
| 林草地 | 858 | 182 058 | 3 536 | 10 328 | 1 939 | 13 453 | 212 172 | 85.81 |
| 园地 | 5 272 | 3 880 | 65 696 | 1 062 | 342 | 10 701 | 86 953 | 75.55 |
| 水体 | 0 | 5 | 94 | 184 256 | 0 | 40 170 | 224 525 | 82.06 |
| 建设用地 | 0 | 0 | 0 | 0 | 14 146 | 2 984 | 17 130 | 82.58 |
| 未利用地 | 0 | 8 189 | 0 | 208 | 161 | 457 741 | 466 299 | 98.16 |
| 合计 | 60 747 | 194 896 | 70 249 | 196 053 | 17 455 | 527735 | 1067 135 | — |
| 制图精度/% | 89.91 | 93.41 | 93.52 | 93.98 | 81.04 | 86.74 | — | — |
3.3 阿拉尔垦区2050年和2080年的土地利用模拟
图11
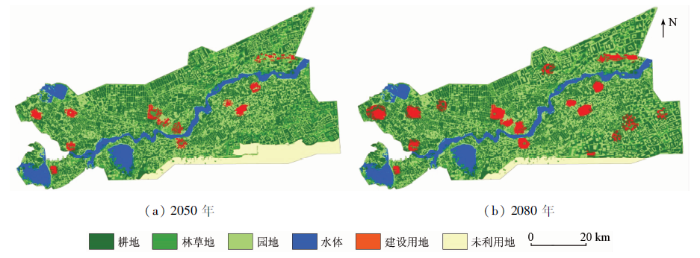
图11
阿拉尔垦区2050年和2080年的土地利用模拟情况
Fig.11
Land use simulation situation of Alar reclamation area in 2050 and 2080
表5 阿拉尔垦区2050年和2080年各土地利用类型的面积变化情况
Tab.5
| 年份 | 耕地 | 林草地 | 园地 | 水体 | 建设用地 | 未利用地 | ||||||
|---|---|---|---|---|---|---|---|---|---|---|---|---|
| 面积/km2 | 百分 比/% | 面积/km2 | 百分 比/% | 面积/km2 | 百分 比/% | 面积/km2 | 百分 比/% | 面积/km2 | 百分 比/% | 面积/km2 | 百分 比/% | |
| 2050年 | 1 679.32 | 40.90 | 388.42 | 9.46 | 1 285.56 | 31.31 | 345.31 | 8.41 | 104.29 | 2.54 | 303.02 | 7.38 |
| 2080年 | 1 727.77 | 42.08 | 330.94 | 8.06 | 1 368.50 | 33.33 | 349.82 | 8.52 | 207.76 | 5.06 | 121.12 | 2.95 |
4 讨论
4.1 阿拉尔垦区土地利用类型面积变化的突变情况
图12
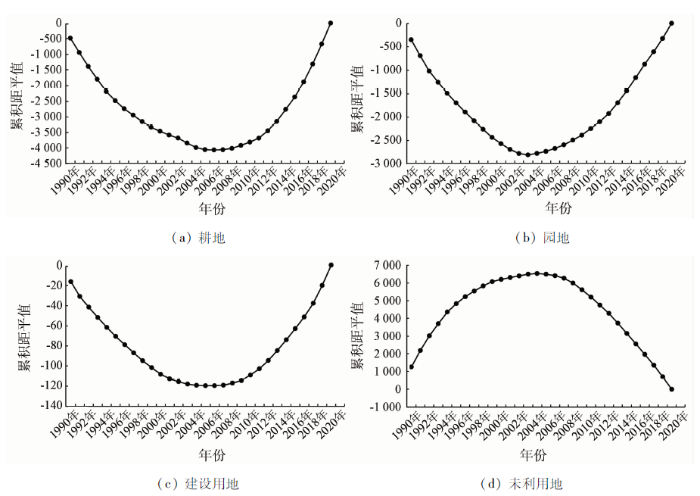
图12
阿拉尔垦区土地利用类型面积变化的突变情况分析
Fig.12
Analysis on the abrupt change of land use type area in Alar reclamation area
4.2 土地利用变化的驱动因素
对土地利用变化的驱动因素进行深入研究,有利于土地信息监测、合理利用并为土地资源可持续发展提供科学依据[28]。本研究是以西北典型的农垦区域为对象展开的土地利用变化分析,而多数研究则是以东部沿海经济较为发达的城市区域[29]为对象展开的土地利用变化分析,驱动土地利用变化的因素多为工业化[30]和城市化[31]带来的经济发展。本文利用高程、坡度等15种影响因素数据和土地利用数据,运用CA-Markov模型进行土地利用模拟,能够显示出各影响因素的驱动力大小,最终发现本文总人口、农业生产总值和棉花价格为主要驱动因素。这是由于随着人口增加,机械化作业水平提高,农业生产总值增加,棉花价格上涨,大量的土地资源被开发,导致研究区土地利用发生剧烈变化。
4.3 不同土地利用模拟模型的比较
本文以CA-Markov模型和多智能体ABM(agent-based model)模型[32]这2种最常用的土地利用模拟方法进行比较讨论,分析本文所用模型的优势。CA-Markov模型不仅能够通过简单的转化规则模拟出复杂的土地利用类型变化模型,为更高级的土地利用演化提供良好的过程分析环境,而且能与GIS和RS数据嵌合,提高GIS分析复杂自然现象和长时序动态建模的能力。ABM模型能够通过微观智能体及其与地理空间环境相互作用的方式进行模拟,从而反映土地利用变化过程中复杂的人地关系,主要呈现研究区的人为因素影响[33],缺乏对自然环境的考量。因此,CA-Markov模型是通过局部简单转换规则改变元胞状态,从宏观模拟土地利用变化结果,而ABM模型是通过智能体Agent交互作用,从微观模拟土地利用变化结果。这2种模型各具优势,但李少英等[34]分析近30 a相关土地利用与模拟的研究提出,CA-Markov模型结合了CA和Markov模型的优势,能够更精确地模拟土地利用变化情况。
5 结论
本文将每年各月份影像进行多时相合成后,运用支持向量机分类方法获得逐年土地利用分类图,从面积变化、类型转化、空间动态变化3方面展开土地利用变化分析,采用CA-Markov模型模拟2050年和2080年土地利用变化情况,探究土地利用类型面积变化的突变情况、驱动因素和不同模拟模型的优势,得出以下结论:
1)1990—2019年,阿拉尔垦区耕地、园地、水体和建设用地的面积呈增加趋势,林草地和未利用地的面积呈减少趋势; 耕地和园地面积的增加主要是由塔里木河沿岸区域之外的未利用地转换而来。
2)CA-Markov模型的总体分类精度可达89.82%,Kappa系数可达0.85,能够较好地模拟阿拉尔垦区土地利用变化情况; 模拟结果显示,至2080年垦区东北和东南部的未利用地将被逐渐开垦,耕地、园地和建设用地的面积将大幅增加。
3)土地利用类型面积在2005年发生转折性变化,耕地、园地和建设用地的面积急剧增加,未利用地面积急剧减少,这是由于阿拉尔垦区的政策导向所致; 垦区土地利用变化的主要驱动因素为总人口、农业生产总值和棉花价格。
(责任编辑: 李瑜)
参考文献
从土地利用规划到国土空间规划——科学理性规划的视角
[J].
From land-use planning to territorial space planning:A perspective of scientific and rational planning
[J].
基于高分辨率遥感影像的神农架大九湖湿地土地利用类型变化及其驱动力分析——来自长时间尺度多源遥感信息的约束
[J].DOI:10.6046/gtzyyg.2020100 [本文引用: 1]
An analysis of land use changes and driving forces of Dajiuhu wetland in Shennongjia based on high reso-lution remote sensing images:Constraints from the multi-source and long-term remote sensing information
[J].DOI:10.6046/gtzyyg.2020100 [本文引用: 1]
Landscape ecology development supported by geospatial technologies:A review
[J].DOI:10.1016/j.ecoinf.2019.03.006 URL [本文引用: 1]
矿区地物分类及土地利用/覆盖变化动态监测——以海流兔流域为例
[J].DOI:10.6046/gtzyyg.2020.03.30 [本文引用: 1]
Classification of objects and LUCC dynamic monitoring in mining area:A case study of Hailiutu watershed
[J].DOI:10.6046/gtzyyg.2020.03.30 [本文引用: 1]
Identifying how future climate and land use/cover changes impact streamflow in Xinanjiang Basin,East China
[J].DOI:10.1016/j.scitotenv.2019.136275 URL [本文引用: 1]
Pattern analysis in landscape ecolo-gy:Progress,challenges and outlook
[J].DOI:10.1016/S1872-2032(09)60011-1 URL [本文引用: 1]
基于GIS的城市土地利用研究进
[J].DOI:10.6046/gtzyyg.2018.03.02 [本文引用: 1]
An overview of urban land use research based on GIS
[J].DOI:10.6046/gtzyyg.2018.03.02 [本文引用: 1]
黄土高原土地利用变化对生态系统服务价值的影响
[J].DOI:10.6046/gtzyyg.2019.03.17 [本文引用: 1]
The impact of land use change on ecosystem services value in Loess Plateau
[J].DOI:10.6046/gtzyyg.2019.03.17 [本文引用: 1]
Land use/land cover change and the effects on ecosystem services in the Hengduan Mountain region,China
[J].DOI:10.1016/j.ecoser.2018.09.008 URL [本文引用: 1]
Land-use changes and policy dimension driving forces in China:Present,trend and future
[J].DOI:10.1016/j.landusepol.2011.11.010 URL [本文引用: 1]
The language of landscape ecologists and planners:A comparative content analysis of concepts used in landscape ecology
[J].DOI:10.1016/S0169-2046(01)00151-7 URL [本文引用: 1]
A comparative analysis of urban and rural construction land use change and driving forces:Implications for urbanerural coordination development in Wuhan
[J].
A multi-sensor and multi-temporal remote sensing approach to detect land cover change dynamics in heterogeneous urban landscapes
[J].
DOI:10.1016/j.ecolind.2018.12.033
[本文引用: 1]

With global changes such as climate change and urbanization, land cover is prone to changing rapidly in cities around the globe. Urban management and planning is challenged with development pressure to house increasing numbers of people. Most up-to date continuous land use and land cover change data are needed to make informed decisions on where to develop new residential areas while ensuring sufficient open and green spaces for a sustainable urban development. Optical remote sensing data provide important information to detect changes in heterogeneous urban landscapes over long time periods in contrast to conventional approaches such as cadastral and construction data. However, data from individual sensors may fail to provide useful images in the required temporal density, which is particularly the case in mid-latitudes due to relatively abundant cloud coverage. Furthermore, the data of a single sensor may be unavailable for an extended period of time or to the public at no cost. In this paper, we present an integrated, standardized approach that aims at combining remote sensing data in a high resolution that are provided by different sensors, are publicly available for a long-term period of more than ten years (2005-2017) and provide a high temporal resolution if combined. This multi-sensor and multi-temporal approach detects urban land cover changes within the highly dynamic city of Leipzig, Germany as a case. Landsat, Sentinel and RapidEye data are combined in a robust and normalized procedure to offset the variation and disturbances of different sensor characteristics. To apply the approach for detecting land cover changes, the Normalized Difference Vegetation Index (NDVI) is calculated and transferred into a classified NDVI (Classified Vegetation Cover-CVC). Small scale vegetation development in heterogeneous complex areas of a European compact city are highlighted. Results of this procedure show successfully that the presented approach is applicable with divers sensors' combinations for a longer time period and thus, provides an option for urban planning to update their land use and land cover information timely and on a small scale when using publicly available no cost data.
Land use/cover changes in the Oriental migratory locust area of China:Implications for ecological control and monitoring of locust area
[J].DOI:10.1016/j.agee.2020.107110 URL [本文引用: 1]
Quantitative assessment of land use dynamic variation using remote sensing data and landscape pattern in the Yangtze River delta,China
[J].DOI:10.1016/j.suscom.2019.07.006 URL [本文引用: 1]
Linking land use change,ecosystem services and human well-being:A case study of the Manas River basin of Xinjiang,China
[J].DOI:10.1016/j.ecoser.2017.08.013 URL [本文引用: 1]
Oasis land-use dynamics and its influence on the oasis environment in Xinjiang,China
[J].DOI:10.1016/S0140-1963(03)00002-8 URL [本文引用: 1]
Analysis of spatio-temporal dynamic pattern and driving forces of urban land in China in 1990s using TM images and GIS
[J].DOI:10.1016/j.cities.2005.05.009 URL [本文引用: 1]
基于CA-Markov模型的石羊河流域生态承载力时空格局预测
[J].
Spatio-temporal pattern prediction of the biocapacity in the Shiyang River basin on the basis of the CA-Markov model
[J].
基于CLUMondo模型的多情景土地利用变化动态模拟——以广西沿海城市为例
[J].DOI:10.6046/gtzyyg.2020.01.24 [本文引用: 1]
Dynamic simulation of multi-scenario land use change based on CLUMondo model:A case study of coastal cities in Guangxi
[J].DOI:10.6046/gtzyyg.2020.01.24 [本文引用: 1]
基于CA-Markov模型与ANUDEM内插法的崩岗侵蚀量预估
[J].
Estimation of erosion amount in collapsed gully based on CA-Markov model and ANUDEM interpolation
[J].
基于CA-Markov模型的城市生态分区构建研究——以晋中主城区为例
[J].
Construction of urban ecological zones based on CA-Markov model:A case study of the main urban of Jinzhong
[J].
A GIS and remote sensing aided assessment of land use/cover changes in resettlement areas:A case of ward 32 of Mazowe district,Zimbabwe
[J].
DOI:S0301-4797(20)31235-4
PMID:32927188
[本文引用: 1]
The research assessed land use/cover changes and their socio-economic impacts on local resident farmers in ward 32 of Mazowe District. A mixed method research design that combines both qualitative and quantitative approaches was adopted. Questionnaires, interviews and observations were employed to gather data from the field. GIS and Remote sensing techniques were used for land use/cover change detection and calculations. Data collected from the field was analyzed using Statistical Package for Social Sciences (SPSS) version 25.0 and Microsoft excel. Arc map 10.5 was used to analyze Remote sensing data. Four major land use/covers namely forest, grassland, water and cultivated were identified as baseline land covers of Mazowe ward 32 in 2000. The research revealed that there has been significant loss in forest, grassland and wetland/water cover and gain in cultivated and bare land cover between 2000 and 2018 in ward 32 of Mazowe District. Scarcity of high energy tree species, fruit trees, construction poles and extinction of wild animals are some of the observed impacts of forest cover loss. The study recommends that Mazowe EMA, RDC and Forestry Commission should cooperate in monitoring natural resources in Mazowe District to ensure sustainable utilization.Copyright © 2020 Elsevier Ltd. All rights reserved.
钱塘江流域气候变化及其对水文径流的影响
[D].
Climate change in the Qiantang River basin and its influence on local runoff
[D].
Monitoring land surface thermal environments under the background of landscape patterns in arid regions:A case study in Aksu River basin
[J].DOI:10.1016/j.scitotenv.2019.136336 URL [本文引用: 1]
2000—2015年长江上游NDVI时空变化及驱动力——以宜宾市为例
[J].
Analyzing the spatio-temporal variation and drivers of NDVI in upper reaches of the Yangtze River from 2000 to 2015:A case study of Yibin City
[J].
Landscape pattern changes at a county scale:A case study in Fengqiu,Henan Province,China from 1990 to 2013
[J].DOI:10.1016/j.catena.2015.09.012 URL [本文引用: 1]
高分五号高光谱遥感影像的城市土地利用景观格局分析
[J].
Analysis of landscape pattern on urban land use based on GF-5 hyperspectral data
[J].
基于HJ卫星数据与面向对象分类的土地利用/覆盖信息提取
[J].
Extract of land use/cover information based on HJ satellites data and object-oriented classification
[J].
1975—2018年白洋淀湿地变化分析
[J].
Analysis of changes of Baiyangdian wetland from 1975 to 2018 based on remote sensing
[J].
基于多智能体与CA结合模型分析的农村土地利用变化驱动机制
[J].
Driving mechanism of rural land use change based on multi-agent system and cellular automata
[J].
基于改进CA-Markov模型的山地城市边缘区土地利用变化模拟
[J].
Simulation of spatiotemporal variation of land use in mountainous-urban fringes based on improved CA-Markov model
[J].
