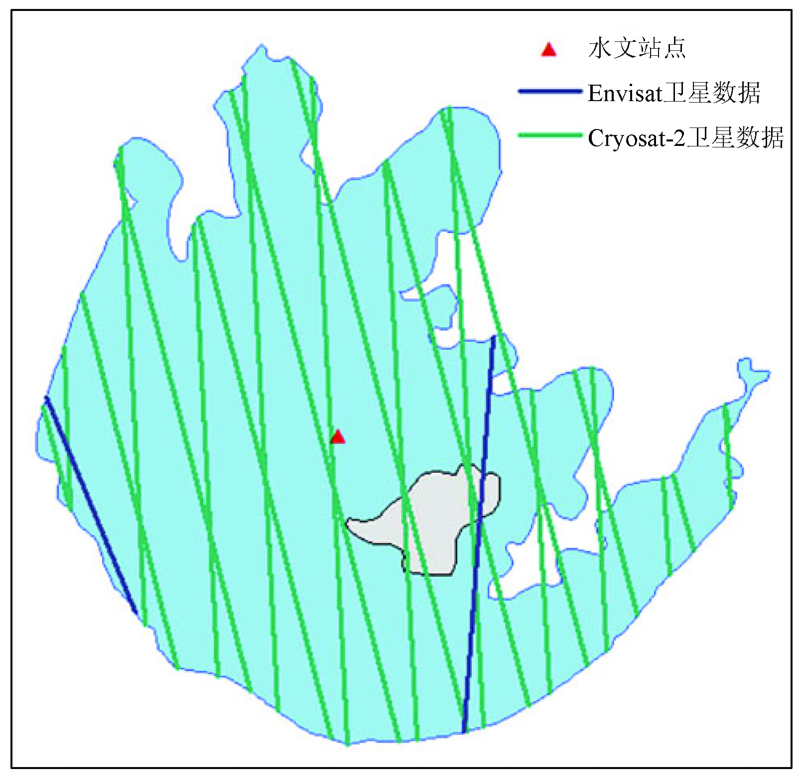
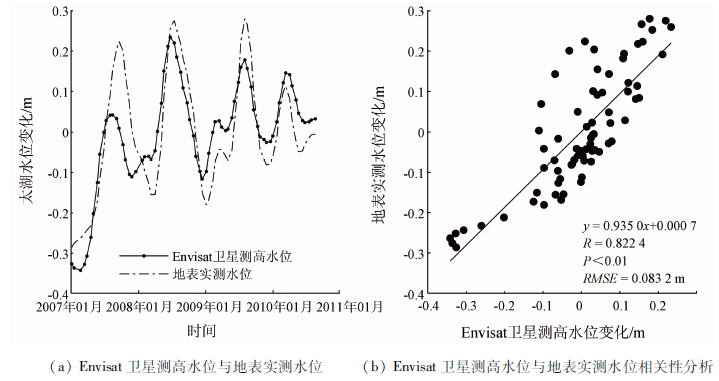
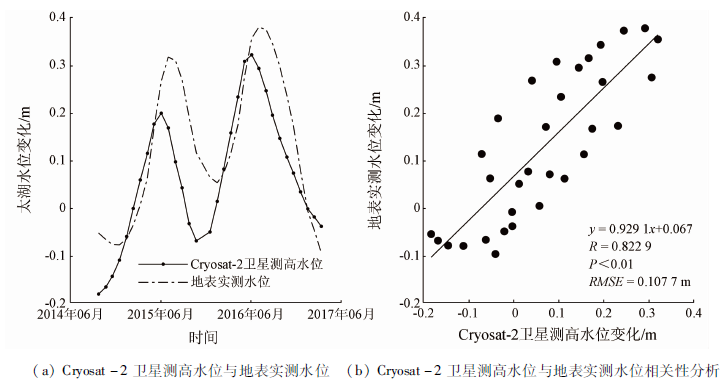
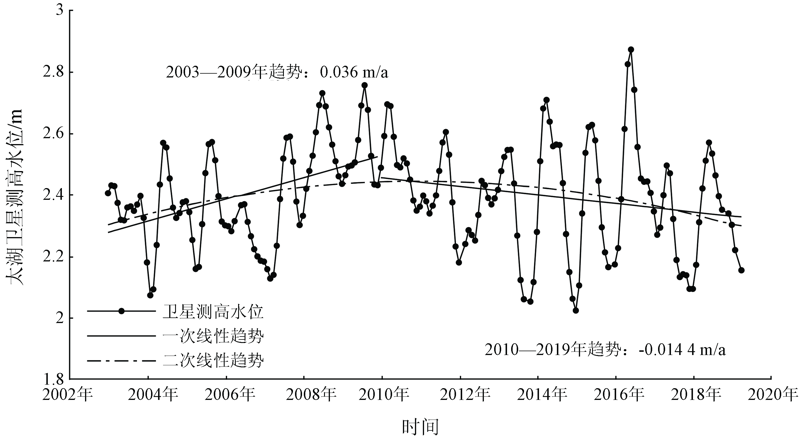
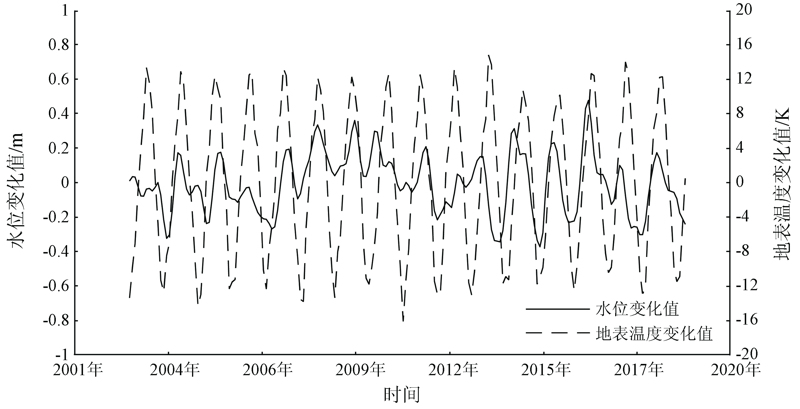
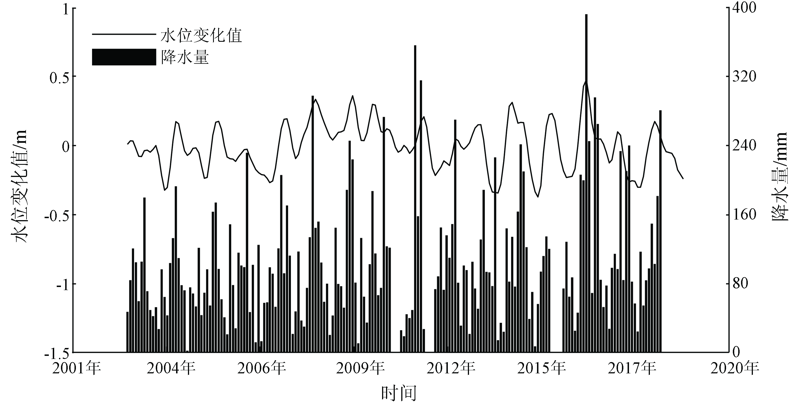
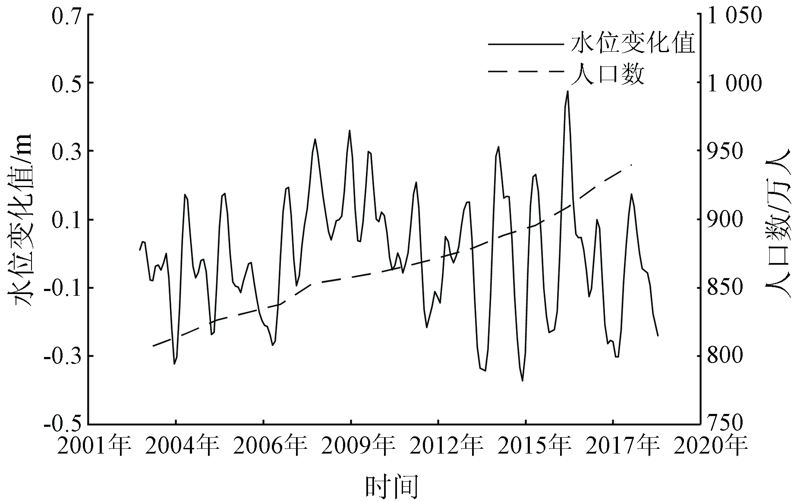
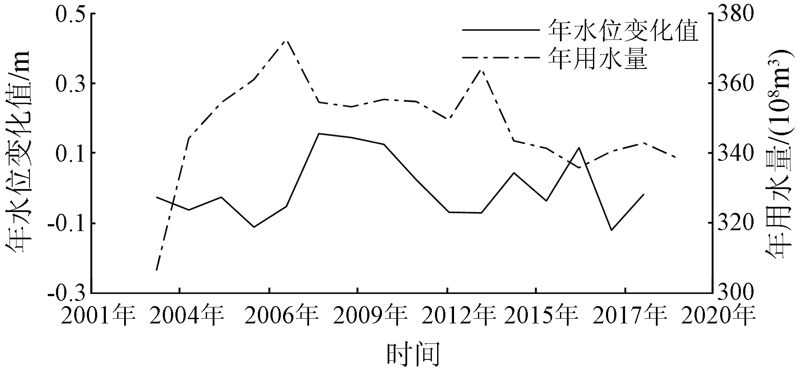
The water level of the Taihu Lake from January 2003 to April 2019 was monitored using the waveform retracking method based on the altimetry data of Envisat and Cryosat-2 satellites. Through gross error elimination and system error correction as well as the boundary extraction of Taihu Lake using MODIS remote sensing images, the long time series of the water level of the Taihu Lake were obtained. Based on these as well as weather observation data and the data on urban population changes, the variation pattern of the water level and its response to climate change and human activities were discussed. The results are as follows. The water level of the Taihu Lake showed an upward trend (0.036 m/a) during 2003—2009 and a downward trend (-0.014 4 m/a) during 2010—2019. It was affected by the ground surface temperature and precipitation in a periodic manner, especially the precipitation. In addition, as the urbanization in the cities around the Taihu Lake accelerated, the population growth rate in the cities had increased and the water demand had notably increased accordingly from 2009. This resulted in a distinct downward trend in the water level of the Taihu Lake since 2009, indicating that human activities affected the water level of the Taihu Lake over.
魏浩翰, 许仁杰, 杨强, 周权平. 多源卫星测高数据监测太湖水位变化及影响分析[J]. 自然资源遥感, 2021, 33(3): 130-137.
WEI Haohan, XU Renjie, YANG Qiang, ZHOU Quanping. Variation and effect analysis of the water level of the Taihu Lake based on multi-source satellite altimetry data. Remote Sensing for Natural Resources, 2021, 33(3): 130-137.
Wang Y F, Xu Y P, Zhang Q Y, et al. Influence of stream structure change on regulation capacity of river networks in Taihu Lake Basin[J]. Acta Geographica Sinica, 2016, 71(3):449-458.
Zhao Y, Liao J J, Shen G Z, et al. Monitoring the water level changes in Qinghai Lake with satellite altimetry data[J]. Journal of Remote Sensing, 2017, 21(4):633-644.
[3]
Sakaros B, Frédéric F, Fabien B, et al. Monitoring water levels and discharges using Radar altimetry in an ungauged river basin:The case of the Ogooué[J]. Remote Sensing, 2018, 10(3):350.
doi: 10.3390/rs10020350
Li J C, Chu Y H, Jiang W P, et al. Monitoring level fluctuation of lakes in Yangtze river basin by altimetry[J]. Geomatics and Information Science of Wuhan University, 2007, 32(2):144-147.
[5]
Jiang L G, Nielsen K, Andersen O B, et al. Monitoring recent lake level variations on the Tibetan Plateau using CryoSat-2 SARIn mode data[J]. Journal of Hydrology, 2017, 544:109-124.
doi: 10.1016/j.jhydrol.2016.11.024
[6]
Frappart F, Calmant S, Cauhopé M, et al. Preliminary results of ENVISAT RA-2-derived water levels validation over the Amazon basin[J]. Remote Sensing of Environment, 2006, 100(2):252-264.
doi: 10.1016/j.rse.2005.10.027
[7]
Song C S C, Ye Q Y Q, Sheng Y S Y, et al. Combined ICESat and CryoSat-2 altimetry for accessing water level dynamics of Tibetan lakes over 2003-2014[J]. Water, 2015, 7(9):4685-4700.
doi: 10.3390/w7094685
[8]
Song C, Ye Q, Cheng X. Shifts in water-level variation of Namco in the central Tibetan Plateau from ICESat and CryoSat-2 altimetry and station observations[J]. Science Bulletin, 2015(14):67-77.
[9]
Soussi B. Envisat altimetry level 2 user manual[EB/OL]. Paris:ESA, 2011,https://earth.esa.int/web/guest/home.
[10]
Frappart F, Calman T S, Cauhopé M, et al. Preliminary results of ENVISAT RA-2-derived water levels validation over the Amazon basin[J]. Remote Sensing of Environment, 2006, 100(2):252-264.
doi: 10.1016/j.rse.2005.10.027
Kamel Didan A B M R. MODIS vegetation index user’s guide[EB/OL]. Tucson:The University of Arizona, 2015,https://modis.gsfc.nasa.gov/data/dataprod/mod13.php.
Zhao Y F, Zhu J, Xu Y. et al. Surface climate changes per month grid 0.5[EB/OL]. Beijing:Data Service Room of National Meteorological Information Center, 2012. http://data.cma.cn.
[14]
Kuo H Y. Comparison of GPS radio occultation soundings with radiosondes[J]. Geophysical Research Letters, 2005, 32(5):L5817.
doi: 10.1029/2004GL021443
Department of Population and Employment Statistics National Bureau Statistics of Chian. China population statistics yearbook[M]. Beijing: China Statistics Press, 2003-2018.
[17]
文汉江, 金涛勇, 朱广彬. 卫星测高原理及应用[M]. 北京: 测绘出版社, 2017.
Wen H J, Jin T Y, Zhu G B, et al. Principle and application of satellite altimetry[M]. Beijing:The mapping publishing company, 2017.
[18]
Song C, Ye Q, Sheng Y, et al. Combined ICESat and CryoSat-2 altimetry for accessing water level dynamics of Tibetan lakes over 2003-2014[J]. Water, 2015, 7(9):4685-4700.
doi: 10.3390/w7094685
Yu H, Zhang S Q, Li X F, et al. Inland limnetic wetlands water body extraction using TM imagery[J]. Remote Sensing Technology and Application, 2008(3):310-315.
Wang D, Wang D, Qi S H. Uncertainty analysis of Poyang lake water level-flooded area relationship[J]. Resources and Environment in the Yangtze Basin, 2016, 25(s1):95-102.
Zhang K X, Zhang G Q. Monitoring area changes of Poyang lake by MODIS data (2000—2011)[J]. Journal of East China University of Technology (Social Science), 2013, 32(3):390-396.
Zhang Y. Method of monitoring water level change of main lakes in China with Radar altimeter data[D]. Beijing:The University of Chinese Academy of Sciences, 2017.
[23]
Gao L, Liao J J, Shen G Z. Monitoring lake-level changes in the Qinghai-Tibetan Plateau using radar altimeter data (2002—2012)[J]. Journal of Applied Remote Sensing, 2013, 7(1):073470.
doi: 10.1117/1.JRS.7.073470
Zhang X, Wu Y H, Zhang X. Zhari Namco water level change detection using multi-satellite altimetric data during 1992—2012[J]. Journal of Natural Resources, 2015, 30(7):1153-1162.
 2021, Vol. 33
  ), 许仁杰1, 杨强1, 周权平2