Estimating the surface mass balance of the Greenland Ice Sheet based on remote sensing data and ice flux divergence
WEI Jianing1(), LUO Kai1, CHEN Yourong1, LI Peigen1, YANG Kang1,2,3()
1. School of Geography and Ocean Science, Nanjing University, Nanjing 210023, China 2. Jiangsu Provincial Key Laboratory of Geographic Information Science and Technology, Nanjing 210023, China 3. Collaborative Innovation Center of South China Sea Studies, Nanjing 210023, China
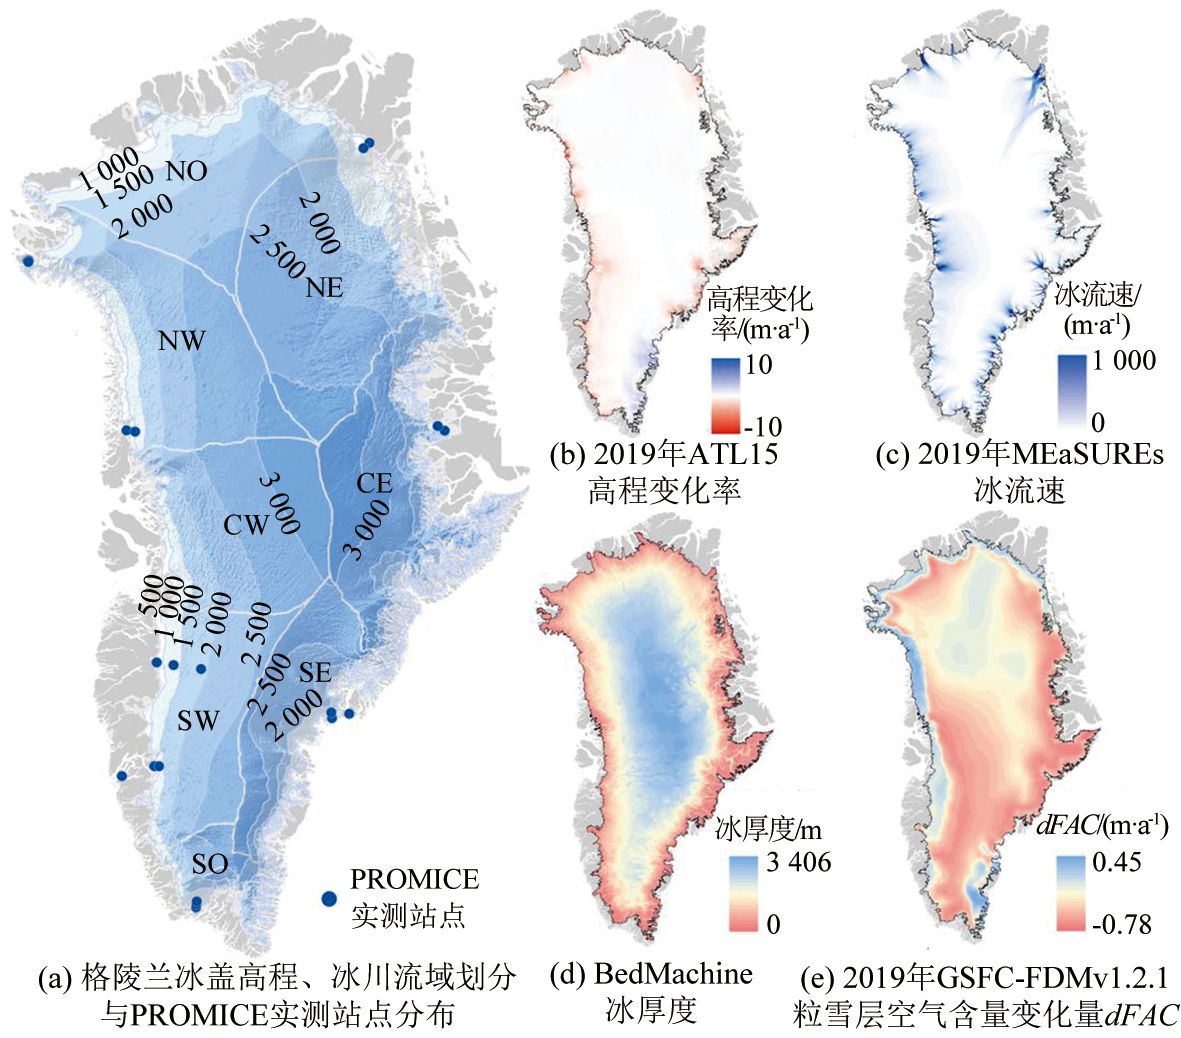
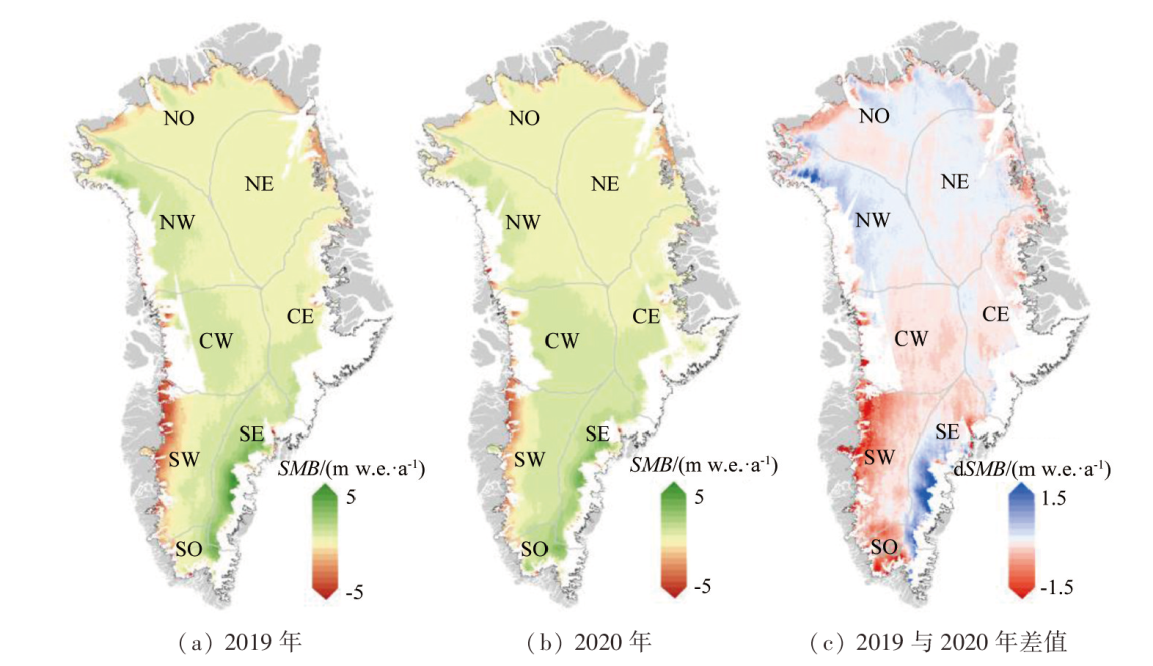
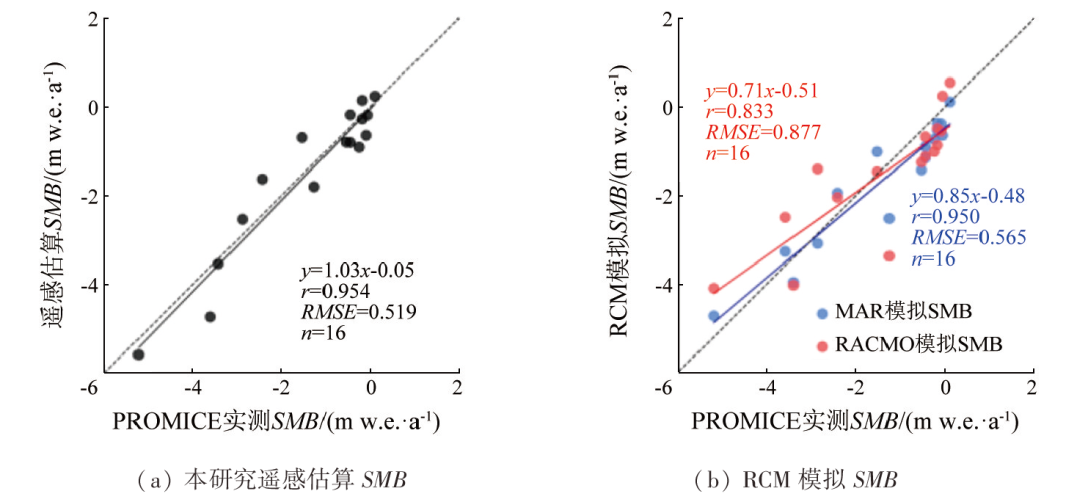
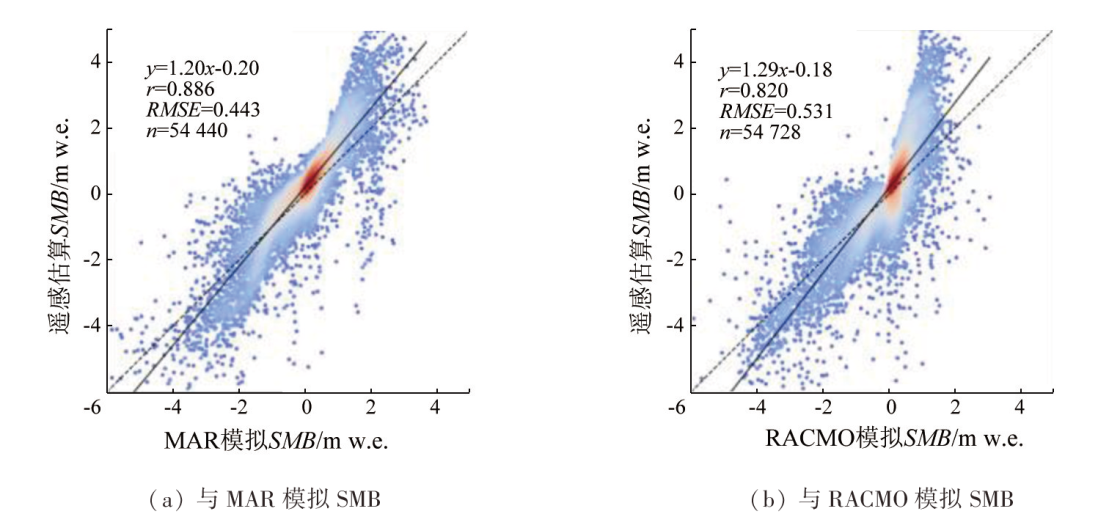
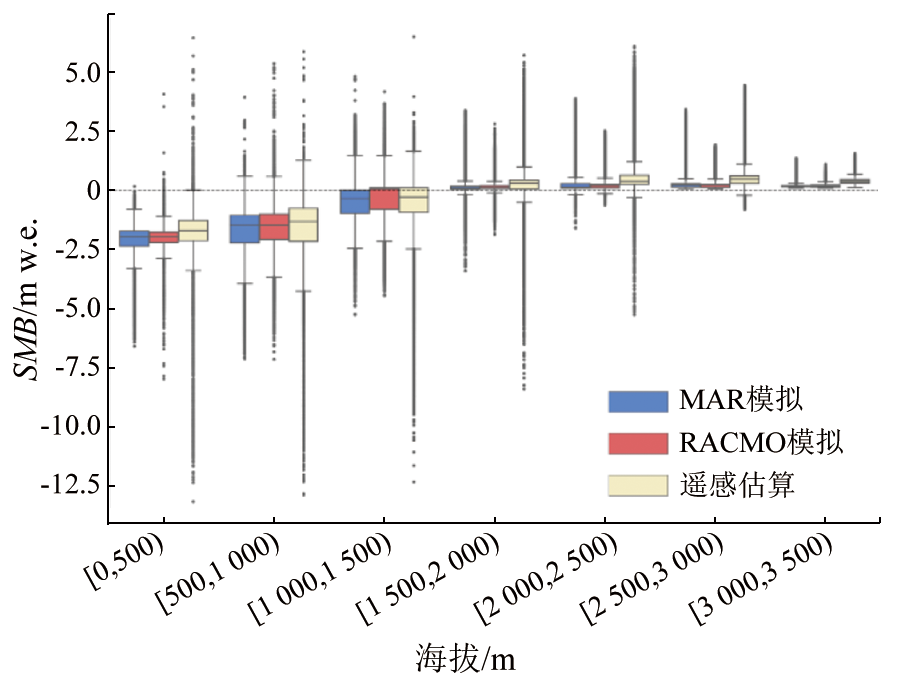
近几十年,格陵兰冰盖表面物质平衡(surface mass balance,SMB)和溢出冰川崩解造成冰盖物质损失加速,其中SMB的贡献近年来持续增大。因此,掌握SMB时空分布对于理解格陵兰冰盖物质平衡具有重要意义。然而,研究格陵兰冰盖SMB的2种主要手段中,区域气候模型模拟的SMB存在较大不确定性,溢出冰川通量门遥感观测仅能间接获得通量门上游流域整体的SMB值,难以反映SMB的空间分布。本研究提出了一种综合冰通量散度的格陵兰冰盖表面物质平衡遥感估算方法,能够较为准确地估算SMB空间分布: ①利用ICESat-2卫星激光测高数据获取格陵兰冰盖高程年际变化量; ②利用MEaSUREs冰流速遥感数据和BedMachine冰厚度数据,采用基于像元的有限差分法计算冰通量散度,估算冰流造成的冰盖高程变化,进而从ICESat-2冰盖高程变化中减去由冰流造成的冰盖高程变化,获得由SMB引起的冰盖高程变化; ③利用粒雪密实化模型将SMB引起的高程变化转换为质量变化,即可反映格陵兰冰盖年际SMB空间分布。研究采用该方法估算了2019年与2020年格陵兰冰盖SMB空间分布,通过与观测站点实测SMB对比分析,表明本方法估算SMB的精度较高(RMSE为0.519 m w.e.),优于区域气候模型(RMSE为0.565~0.877 m w.e.),是一种较为可靠的格陵兰冰盖表面物质平衡时空分布遥感估算方法。
In recent decades, the surface mass balance (SMB) and the calving of outlet glaciers have accelerated the mass loss of the Greenland Ice Sheet (GrIS), with SMB’s contribution continuing to increase. Therefore, determining SMB’s spatiotemporal distribution is critical for understanding the mass balance of the GrIS. Currently, the regional climate model and the remote sensing observation of outlet glacier flux gates serve as two primary calculation methods for the GrIS’s SMB. However, the former method results in large uncertainties in the SMB simulation. The latter method can only indirectly estimate the overall SMB value for the upper reaches of the flux gate, failing to reflect the spatial distribution of SMB. This study proposed a method for estimating the GrIS’s SMB based on remote sensing data and ice flux divergence, obtaining the relatively accurate spatial distribution of SMB. First, the interannual variation in the elevation of the GrIS was derived from ICESat-2 laser altimetry data. Second, based on MEaSUREs-derived glacier flow velocity data and BedMachine-derived ice thickness data, the ice flux divergence was calculated using the pixel-based finite difference method to estimate the GrIS’s elevation changes caused by glacier flow. The GrIS’s elevation changes caused by SMB were then obtained by subtracting the elevation changes caused by glacier flow from the ICESat-2 elevation data. Third, through the firn densification model, the elevation changes caused by SMB were converted into mass changes to reflect the interannual spatial distribution of the GrIS’s SMB. The proposed method was applied to estimate the spatial distribution of the GrIS’s SMB in 2019 and 2020, yielding relatively high accuracy (RMSE=0.519 m w.e.) in comparison with the measured SMB from the observation station, and outperforming the regional climate model (RMSE=0.565 m to 0.877 m w.e.), ultimately demonstrating its reliability.
魏佳宁, 罗凯, 陈又榕, 李培根, 杨康. 综合冰通量散度的格陵兰冰盖表面物质平衡遥感估算[J]. 自然资源遥感, 2025, 37(2): 80-87.
WEI Jianing, LUO Kai, CHEN Yourong, LI Peigen, YANG Kang. Estimating the surface mass balance of the Greenland Ice Sheet based on remote sensing data and ice flux divergence. Remote Sensing for Natural Resources, 2025, 37(2): 80-87.
Morlighem M, Williams C N, Rignot E, et al. BedMachine v3:Complete bed topography and ocean bathymetry mapping of Greenland from multibeam echo sounding combined with mass conservation[J]. Geophysical Research Letters, 2017, 44(21):11051-11061.
doi: 10.1002/2017GL074954
pmid: 29263561
[2]
Shepherd A, Ivins E, Rignot E, et al. Mass balance of the Greenland Ice Sheet from 1992 to 2018[J]. Nature, 2020, 579(7798):233-239.
[3]
Vaughan D G, Comiso J C, Allison I, et al. Observations:Cryosphere[J]. Climate Change, 2013, 2103:317-382.
[4]
Van den Broeke M R, Enderlin E M, Howat I M, et al. On the recent contribution of the Greenland ice sheet to sea level change[J]. The Cryosphere, 2016, 10(5):1933-1946.
[5]
Lenaerts J T M, Medley B, van den Broeke M R, et al. Observing and modeling ice sheet surface mass balance[J]. Reviews of Geophysics, 2019, 57(2):376-420.
doi: 10.1029/2018RG000622
pmid: 31598609
[6]
Hanna E, Mernild S H, Cappelen J, et al. Recent warming in Greenland in a long-term instrumental (1881—2012) climatic context:I.Evaluation of surface air temperature records[J]. Environmental Research Letters, 2012, 7(4):045404.
[7]
Ettema J, van den Broeke M R, van Meijgaard E, et al. Higher surface mass balance of the Greenland ice sheet revealed by high-re-solution climate modeling[J]. Geophysical Research Letters, 2009, 36(12):L12501.
[8]
Goelzer H, Huybrechts P, Fürst J J, et al. Sensitivity of Greenland ice sheet projections to model formulations[J]. Journal of Glaciology, 2013, 59(216):733-749.
[9]
Noël B, van de Berg W J, van Wessem J M, et al. Modelling the climate and surface mass balance of polar ice sheets using RACMO2-Part 1:Greenland (1958—2016)[J]. The Cryosphere, 2018, 12(3):811-831.
[10]
Fettweis X, Box J E, Agosta C, et al. Reconstructions of the 1900—2015 Greenland ice sheet surface mass balance using the regional climate MAR model[J]. The Cryosphere, 2017, 11(2):1015-1033.
[11]
Vernon C L, Bamber J L, Box J E, et al. Surface mass balance mo-del intercomparison for the Greenland ice sheet[J]. The Cryosphere, 2013, 7(2):599-614.
[12]
Fettweis X, Hofer S, Krebs-Kanzow U, et al. GrSMBMIP:Intercomparison of the modelled 1980—2012 surface mass balance over the Greenland Ice Sheet[J]. The Cryosphere, 2020, 14(11):3935-3958.
[13]
Kuipers M P, Ligtenberg S R M, Noël B P Y, et al. Elevation change of the Greenland Ice Sheet due to surface mass balance and firn processes,1960—2014[J]. The Cryosphere, 2015, 9(6):2009-2025.
[14]
Cooper M G, Smith L C. Satellite remote sensing of the Greenland ice sheet ablation zone:A review[J]. Remote Sensing, 2019, 11(20):2405.
[15]
Markus T, Neumann T, Martino A, et al. The ice,cloud,and land elevation satellite-2 (ICESat-2):Science requirements,concept,and implementation[J]. Remote Sensing of Environment, 2017, 190:260-273.
[16]
Smith B, Sutterley T, Dickinson S, et al. ATLAS/ICESat-2 L3B Gridded Antarctic and Arctic Land Ice Height Change,Version 2 [DS]. 2022.
[17]
Joughin I. MEaSUREs Greenland Annual Ice Sheet Velocity Mosaics from SAR and Landsat,Version 4 [DS]. 2022.
[18]
Morlighem M, Williams C, Rignot E, et al. IceBridge BedMachine Greenland,Version 5 [DS]. 2022.
[19]
Hamilton G S, Whillans I M. Local rates of ice-sheet thickness change in Greenland[J]. Annals of Glaciology, 2002, 35:79-83.
[20]
Medley B, Neumann T, Zwally H J, et al. NASA GSFC Firn Densification Model version 1.2.1 (GSFC-FDMv1.2.1) for the Greenland and Antarctic Ice Sheets:1980—2022 (1.2.1 release 2) [DS]. 2022.
[21]
Machguth H, Thomsen H H, Weidick A, et al. Greenland surface mass-balance observations from the ice-sheet ablation area and local glaciers[J]. Journal of Glaciology, 2016, 62(235):861-887.
[22]
Brinkerhoff D, Johnson J. A stabilized finite element method for calculating balance velocities in ice sheets[J]. Geoscientific Model Development, 2015, 8(5):1275-1283.
[23]
Van Tricht L, Huybrechts P, Van Breedam J, et al. Estimating surface mass balance patterns from unoccupied aerial vehicle measurements in the ablation area of the Morteratsch-Pers glacier complex (Switzerland)[J]. The Cryosphere, 2021, 15(9):4445-4464.
[24]
Sørensen L S, Simonsen S B, Nielsen K, et al. Mass balance of the Greenland ice sheet (2003—2008) from ICESat data - the impact of interpolation,sampling and firn density[J]. The Cryosphere, 2011, 5(1):173-186.
[25]
Sutterley T C, Velicogna I, Fettweis X, et al. Evaluation of reconstructions of snow/Ice melt in Greenland by regional atmospheric climate models using laser altimetry data[J]. Geophysical Research Letters, 2018, 45(16):8324-8333.
[26]
Le Brocq A M, Payne A J, Siegert M J. West Antarctic balance calculations:Impact of flux-routing algorithm,smoothing algorithm and topography[J]. Computers & Geosciences, 2006, 32(10):1780-1795.
[27]
Miles E, McCarthy M, Dehecq A, et al. Health and sustainability of glaciers in high Mountain Asia[J]. Nature Communications, 2021, 12(1):2868.
doi: 10.1038/s41467-021-23073-4
pmid: 34001875
[28]
Cuffey K M, Paterson W S B. The Physics of Glaciers[M]. Newyork: Academic Press, 2010.
[29]
Zekollari H, Huybrechts P, Fürst J J, et al. Calibration of a higher-order 3-D ice-flow model of the Morteratsch glacier complex,Engadin,Switzerland[J]. Annals of Glaciology, 2013, 54(63):343-351.
[30]
Bons P D, Kleiner T, Llorens M G, et al. Greenland ice sheet:Higher nonlinearity of ice flow significantly reduces estimated basal motion[J]. Geophysical Research Letters, 2018, 45(13):6542-6548.
[31]
Reeh N, Mohr J J, Madsen S N, et al. Three-dimensional surface velocities of Storstrømmen glacier,Greenland,derived from radar interferometry and ice-sounding radar measurements[J]. Journal of Glaciology, 2003, 49(165):201-209.
[32]
Meierbachtol T, Harper J, Humphrey N. Basal drainage system response to increasing surface melt on the greenland ice sheet[J]. Science, 2013, 341(6147):777-779.
doi: 10.1126/science.1235905
pmid: 23950535
[33]
Mankoff K D, Colgan W, Solgaard A, et al. Greenland Ice Sheet solid ice discharge from 1986 through 2017[J]. Earth System Science Data, 2019, 11(2):769-786.
doi: 10.5194/essd-11-769-2019
[34]
Medley B, Neumann T A, Zwally H J, et al. Simulations of firn processes over the Greenland and Antarctic ice sheets:1980—2021[J]. The Cryosphere, 2022, 16(10):3971-4011.
[35]
Ligtenberg S R M, Kuipers Munneke P, van den Broeke M R. Present and future variations in Antarctic firn air content[J]. The Cryosphere, 2014, 8(5):1711-1723.
 2025, Vol. 37
  ), 罗凯1, 陈又榕1, 李培根1, 杨康1,2,3(