Gaussian mixture model and its application in remote sensing identification of industrial heat sources
LI Lelin1,2(), WANG Wenxi3, YANG Wentao1, CHEN Hao2, PENG Huanhua2, ZHAO Qian3
1. National-Local Joint Engineering Laboratory of Geo-Spatial Information Technology, Hunan University of Science and Technology, Xiangtan 411201, China 2. Institute for Local Sustainable Development Goals, Hunan University of Science and Technology, Xiangtan 411201, China 3. School of Earth Sciences and Spatial Information Engineering, Hunan University of Science and Technology, Xiangtan 411201, China
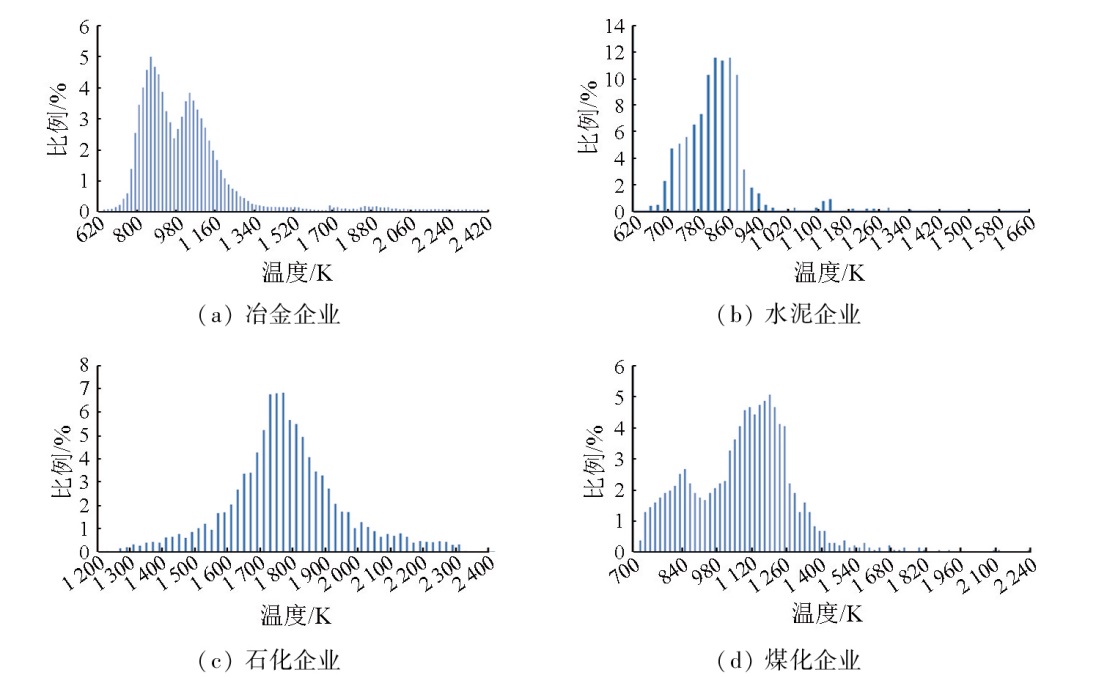
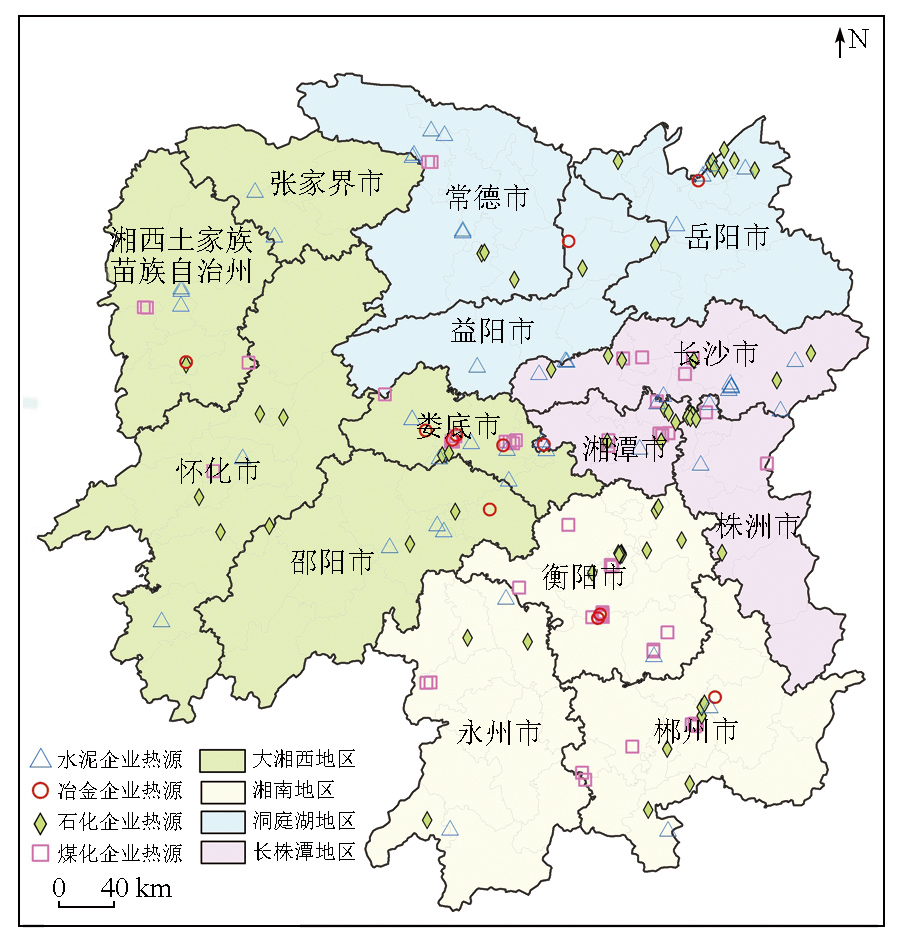
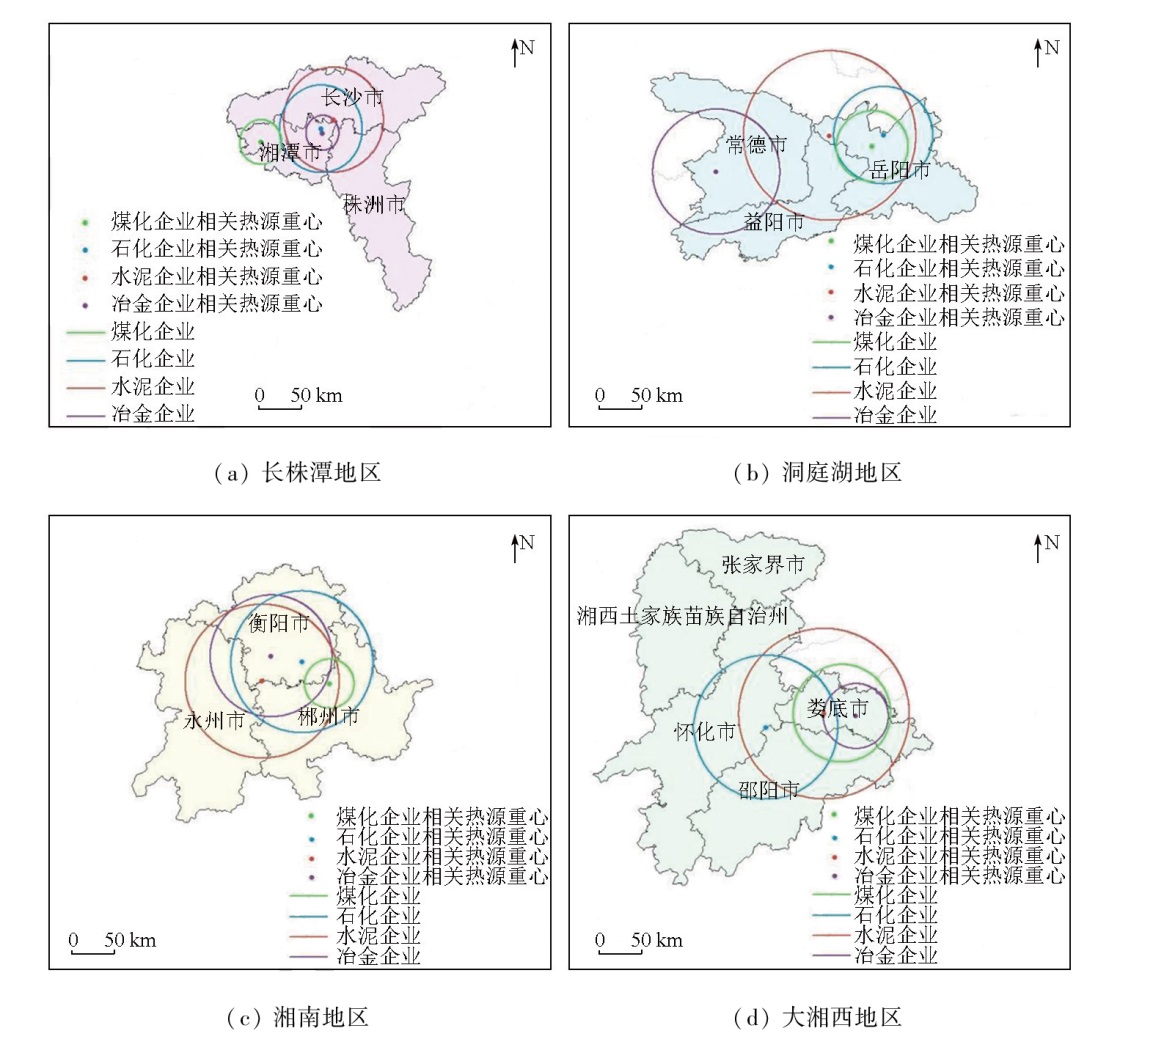
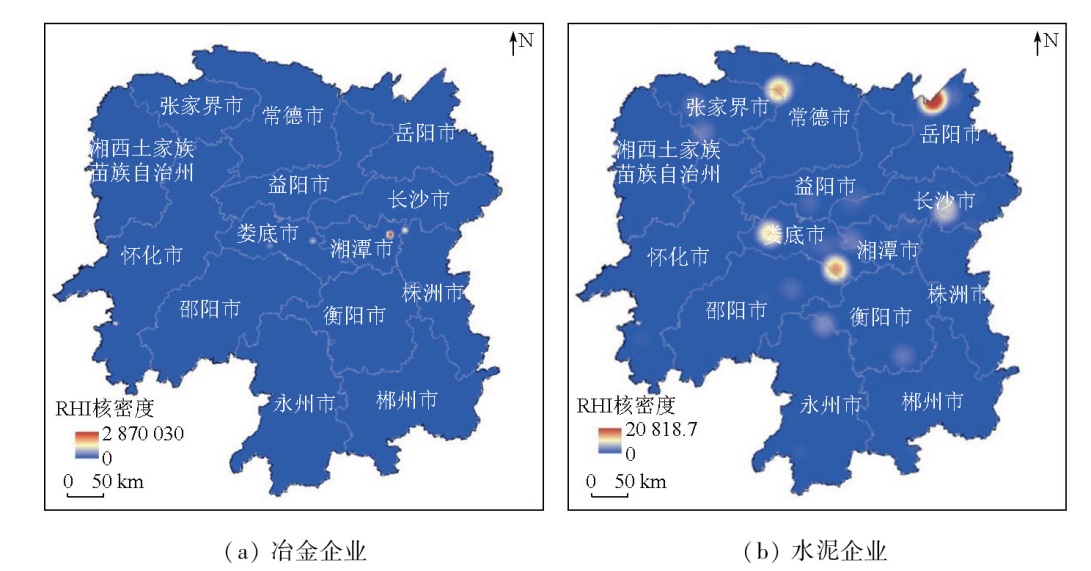
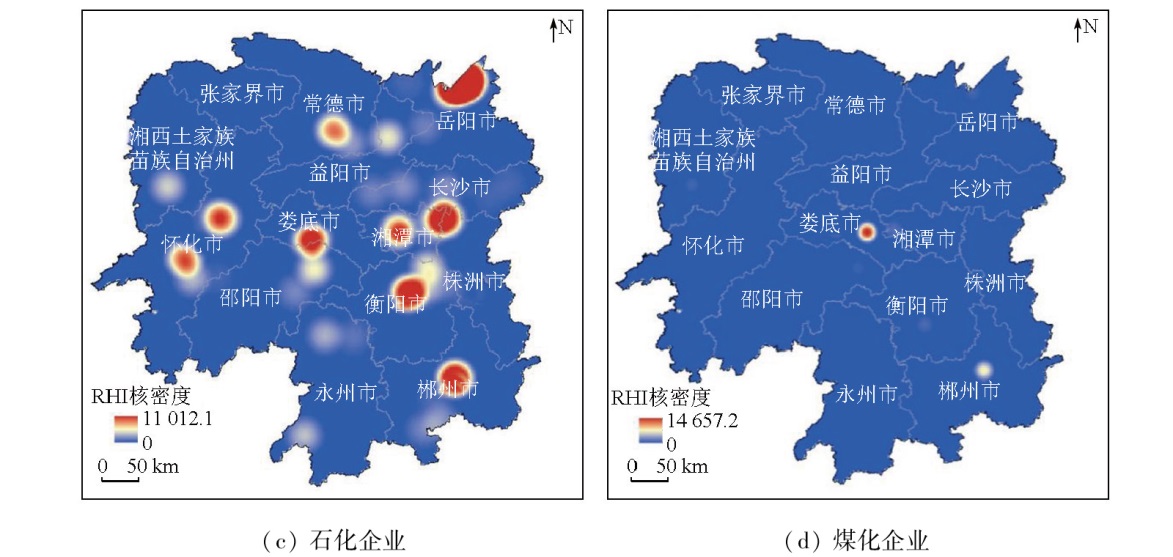
Precisely extracting the information of industrial heat source activities serves as a significant prerequisite for the prevention and control of air pollution and the prediction of industrial economy in China. However, due to unclear heat source characteristics and inaccurate type determination, the remote sensing monitoring of industrial heat sources fails to be widely applied. This study investigated Hunan Province based on the Suomi-NPP VIIRS Nightfire data from 2015 to 2021. First, this study extracted nighttime industrial heat sources from the data using spatial filtering and the hierarchical density-based spatial clustering of applications with noise (HDBSCAN) algorithm. Second, this study constructed temperature characteristic template functions for different industrial heat sources using the Gaussian mixture model. Third, this study determined the subcategories of industrial heat sources according to temperature similarity of the same categories, achieving an overall classification accuracy of 86.31 %. Finally, this study obtained the layout of industrial heat sources in Hunan Province. The results indicate that the industry in Hunan Province was dominated by petrochemical plants, with the smallest number of coal-to-chemical plants. Metallurgical enterprises, showing the highest heat radiation intensity, were primarily distributed in the Loudi-Xiangtan-Zhuzhou area. From 2015 to 2019, industrial heat sources in Hunan Province showed a decreasing trend, indicating that relevant government departments effectively rectified the scattered, non-compliant, and polluting factories in Hunan Province during the 13th Five-Year Plan period. During the COVID-19 pandemic, the number of heat sources changed slightly since work and production were gradually resumed under the effective regulation of the government. This study analyzed the grey relational degrees between the heat radiation emission intensity and the relevant indicators of energy consumption and industrial pollutant emissions. Based on the comprehensive industrial energy consumption, industrial sulfur dioxide emissions, and heat radiation emission intensity, this study explored the relevant situation of energy consumption, pollution, and heat emissions in Hunan Province, dividing the cities and prefectures into seven types accordingly. Overall, this study provides information sources and data support for local governments to dynamically monitor the production activities of local key industrial enterprises. Ascertaining the spatial distribution patterns and evolutionary trends of different industrial enterprises will contribute to the formulation of industrial transformation policies by the government and relevant departments and the practice of sustainable development.
李乐林, 王文曦, 杨文涛, 陈浩, 彭焕华, 赵茜. 高斯混合模型及其在工业热源遥感识别中的应用[J]. 自然资源遥感, 2025, 37(4): 173-183.
LI Lelin, WANG Wenxi, YANG Wentao, CHEN Hao, PENG Huanhua, ZHAO Qian. Gaussian mixture model and its application in remote sensing identification of industrial heat sources. Remote Sensing for Natural Resources, 2025, 37(4): 173-183.
Li Y J. The enterprise environmental responsibility from the perspective of ecological civilization:A case study on illegal pollution discharge in Tengger Desert[J]. Journal of Hangzhou Normal University (Humanities and Social Sciences), 2015, 37(6):119-125.
He H Y, Yang Q Y, Bi G H, et al. Spatio-temporal characteristics of industrial land supply in Chongqing from 2009 to 2018[J]. Resources and Environment in the Yangtze Basin, 2021, 30(4):808-817.
Gao B Y, Luo H L, Huang Z J, et al. Research on the spatial layout of and factors affecting the price of industrial land in China[J]. Journal of Geo-Information Science, 2020, 22(6):1189-1201.
Shi Y W, Li X J, Meng D Y. Evaluation of county industrialization process and analysis of spatial and temporal evolution in typical agricultural areas:A case study of Henan Province[J]. Economic Geography, 2020, 40(10):118-126,153.
Ren S G, Zhang R B, Yuan B L. Industrial eco-efficiency evaluation and regional differences of Yangtze River Economic Belt[J]. Acta Ecologica Sinica, 2018, 38(15):5485-5497.
[7]
赖建波. 重工业热源的遥感识别及空间分布格局研究[D]. 兰州: 西北师范大学, 2020.
Lai J B. Study on remote sensing identification and spatial distribution pattern of heat source in heavy industry[D]. Lanzhou: Northwest Normal University, 2020.
Chen P F, Lu L, Zhu H Z, et al. Research on the suitability of different resolutions of image for identification of the cement enterprise using remote sensing[J]. Environmental Pollution and Control, 2015, 37(9):20-28.
Chen P F, Lu L, Zhu H Z, et al. Research on the suitability of image at different resolutions for the identification of steel enterprise using remote sensing[J]. Journal of Geo-Information Science, 2015, 17(9):1119-1127.
Yu Y F, Pan J, Xing L X, et al. Feasibility analysis of shortwave infrared band for recognition of high temperature target[J]. Remote Sensing for Land and Resources, 2014, 26(1):25-30.doi:10.6046/gtzyyg.2014.01.05.
[11]
Zhou Y, Zhao F, Wang S X, et al. A method for monitoring iron and steel factory economic activity based on satellites[J]. Sustainability, 2018, 10(6):1935.
Sun S, Jiang L, Liu B X, et al. Method development for device-le-vel industrial heat source identification using medium and high-reso-lution satellite images[J]. National Remote Sensing Bulletin, 2024, 28(8):2101-2112.
[13]
Elvidge C D, Zhizhin M, Baugh K, et al. Methods for global survey of natural gas flaring from visible infrared imaging radiometer suite data[J]. Energies, 2016, 9(1):14.
Sun J Q, Liu Y X, Dong Y Z, et al. Classification of urban industrial heat sources based on Suomi-NPP VIIRS nighttime thermal anomaly products:A case study of the Beijing-Tianjin-Hebei Region[J]. Geography and Geo-Information Science, 2018, 34(3):13-19.
Li B, Fan J F, Han L S, et al. Classification extraction and variation characteristics analysis of industrial heat sources in Shandong Province based on VIIRS nightfire data[J]. Remote Sensing Technology and Application, 2022, 37(4):919-928.
Zhang Q T, Zou B, Liu N, et al. Satellite-based ANN identification and spatiotemporal evolution analysis of industrial heat sources coupled with temperature characteristics[J]. National Remote Sensing Bulletin, 2024, 28(4):956-968.
[17]
Ma Y, Ma C H, Liu P, et al. Spatial-temporal distribution analysis of industrial heat sources in the US with geocoded,tree-based,large-scale clustering[J]. Remote Sensing, 2020, 12(18):3069.
[18]
Ma C H, Niu Z, Ma Y, et al. Assessing the distribution of heavy industrial heat sources in India between 2012 and 2018[J]. ISPRS International Journal of Geo-Information, 2019, 8(12):568.
Ji X Y. Evaluation of the industrial heat sources activities over Jing-Jin-Ji region and their impact on the air pollution based on satellite data[D]. Qingdao: Shandong University of Science and Technology, 2019.
Tao J H, Fan M, Gu J B, et al. Satellite observations of the return-to-work over China during the period of COVID-19[J]. Journal of Remote Sensing, 2020, 24(7):824-836.
Sun S, Li L J, Zhao W J, et al. Industrial pollution emissions based on thermal anomaly remote sensing monitoring:A case study of southern Hebei urban agglomerations,China[J]. China Environmental Science, 2019, 39(7):3120-3129.
Hao L C, Meng Q Y, Ge X S, et al. Extraction method of industrial heat pollution area based on octave method[J]. Remote Sensing Technology and Application, 2020, 35(2):469-477.
[23]
Elvidge C D, Zhizhin M, Hsu F C, et al. VIIRS nightfire:Satellite pyrometry at night[J]. Remote Sensing, 2013, 5(9):4423-4449.
[24]
Elvidge C D, Zhizhin M, Baugh K, et al. Extending nighttime combustion source detection limits with short wavelength VIIRS data[J]. Remote Sensing, 2019, 11(4):395.
[25]
Cherifa S, Messaoud R. New technique to use the GMM in speaker recognition system (SRS)[C]// 2013 International Conference on Computer Applications Technology (ICCAT).IEEE, 2013: 1-5.
[26]
Silverman B W. Density estimation in action[M]// Density Estimation for Statistics and Data Analysis.London:Routledge, 2018: 120-158.
Jiang S R, Wang Y, Wang M, et al. Industrial sectors and pollution in China based on the regional perspective[J]. China Environmental Science, 2017, 37(11):4380-4387.
 2025, Vol. 37
  ), 王文曦3, 杨文涛1, 陈浩2, 彭焕华2, 赵茜3