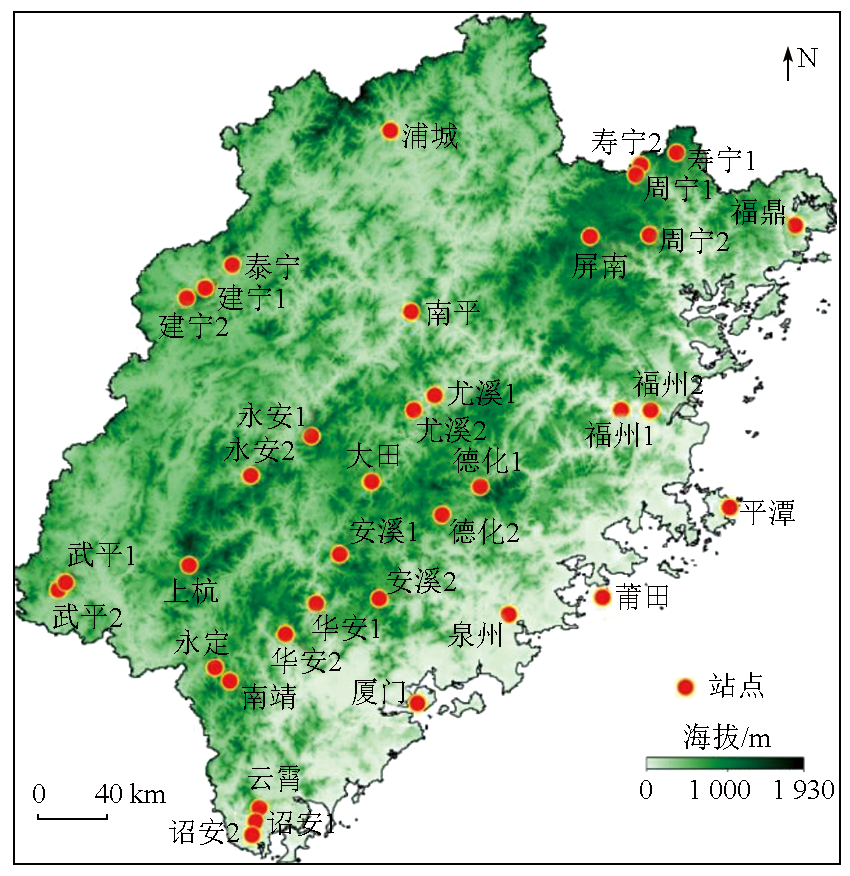
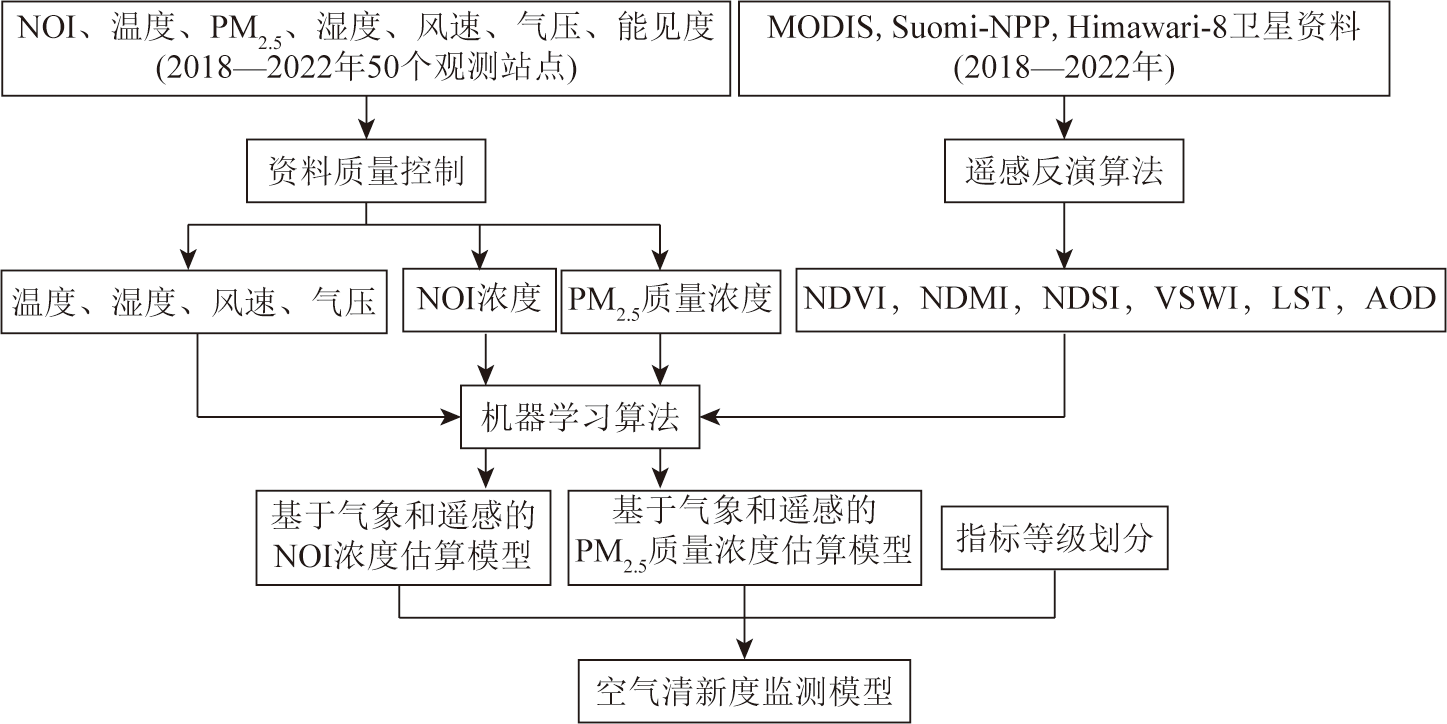
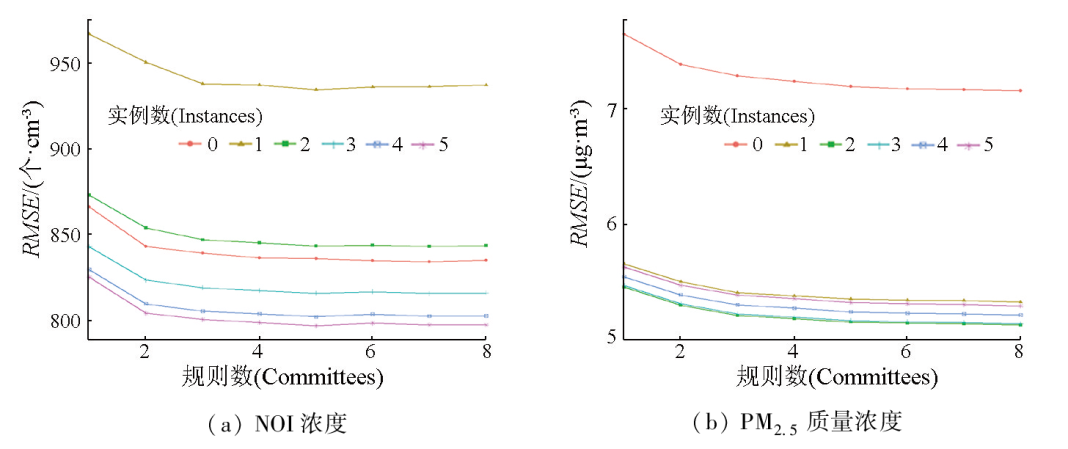
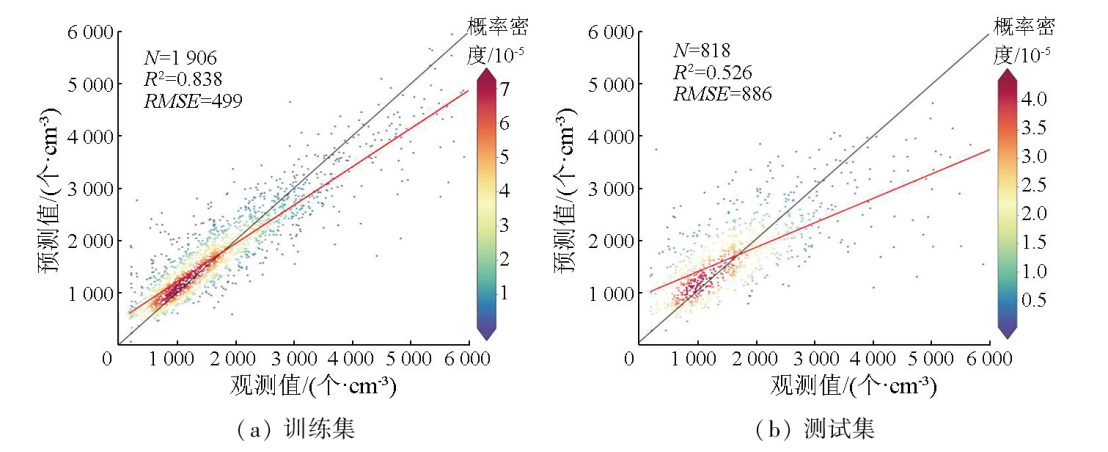
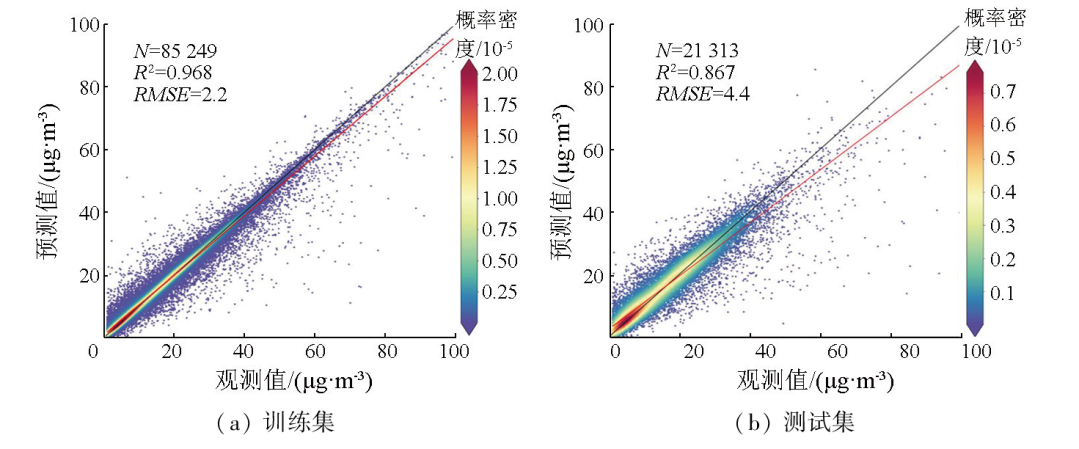
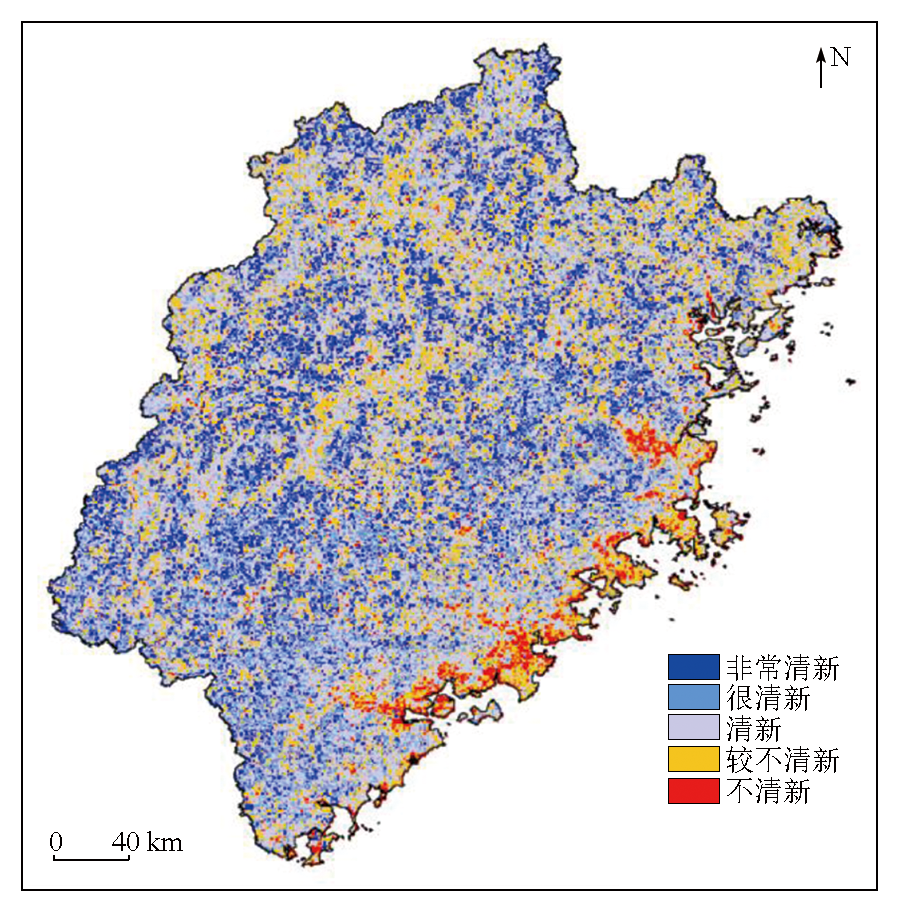
The concentrations of negative oxygen ions and particulate matter 2.5 (PM2.5) serve as important indicators in the assessment of the degrees of air freshness and cleanliness. Based on 2018-2022 data from 50 negative oxygen ion observation stations affiliated with the Fujian meteorological departments, along with the ecological parameters such as aerosol, vegetation index, and surface brightness temperature obtained by satellite-based remote sensing inversion, this study built estimation models for the concentrations of negative oxygen ions and PM2.5 using the Cubist machine learning method. Accordingly, it developed an air freshness index (AFI), and the fine-scale mesh-based monitoring of regional air freshness was achieved. The results show that the estimation model for the negative oxygen ion concentration yielded goodness of fit of 0.838 and 0.526 for the training and test sets, respectively. In comparison, the estimation model for the PM2.5 concentration exhibited goodness of fit of 0.968 and 0.867 for the training and test sets, respectively. Then, this study developed the AFI by comprehensively considering negative oxygen ions and PM2.5. Then, this study graded the AFI using the frequency quartiles of the statistical data series combined with the spatiotemporal changes in negative oxygen ions. The results indicate that the AFI monitoring results based on meteorology, remote sensing, and machine learning algorithms are consistent with the actual conditions.
Tab.3 Annual average NOI concentration at different elevations of 10 typical landscapes in study area (个/cm3)
百分位数 (部分)
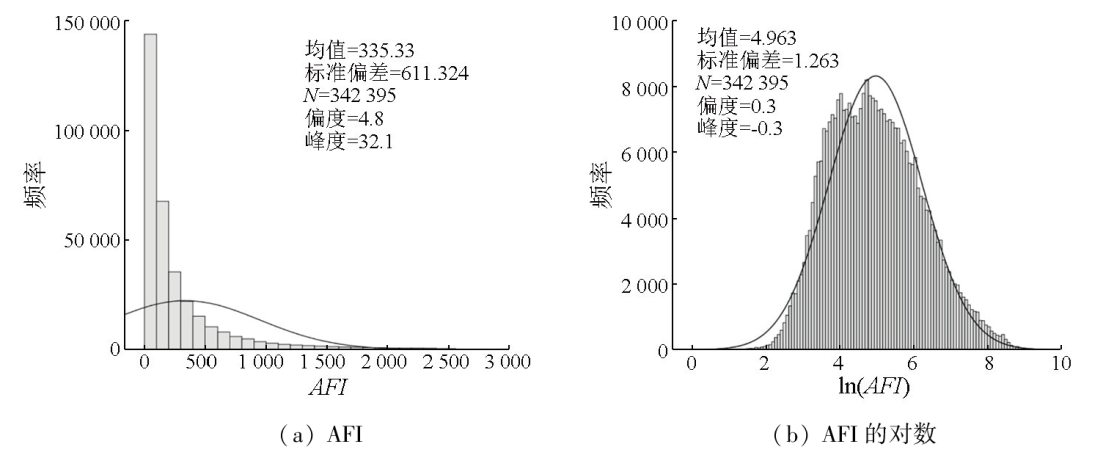
ln(AFI)
AFI
NOI浓度/ (个·cm-3)
PM2.5质量浓 度/(μg·m-3)
15%
3.6
37
993
26.8
20%
3.8
45
1 198
26.6
25%
4.0
54
1 347
24.9
30%
4.2
65
1 422
21.9
35%
4.3
77
1 491
19.4
40%
4.5
93
1 595
17.2
45%
4.7
111
1 628
14.7
50%
4.9
131
1 656
12.6
55%
5.0
156
1 741
11.2
60%
5.2
187
1 780
9.5
65%
5.4
226
1 925
8.5
70%
5.6
275
2 171
7.9
75%
5.8
339
2 221
6.3
80%
6.1
426
2 511
5.9
85%
6.3
561
2 802
5.0
90%
6.8
791
3 644
4.6
91%
6.8
856
4 040
4.5
95%
7.2
1343
4 935
3.7
Tab.4 AFI及其对数的百分位数
等级
等级说明
NOI浓度界限值/ (个·cm-3)
AFI界限值/ (μg·m-3)
1
非常清新
≥2 800
≥561
2
很清新
[2 000,2 800)
[226,561)
3
清新
[1 600,2 000)
[93,226)
4
较不清新
[1 200,1 600)
[45,93)
5
不清新
<1200
<45
Tab.5 基于气象和遥感因子的AFI等级
Fig.7 福建省空气清新度精细化网格监测
气候康养福地
空气清新度监测模型
气候康养福地
空气清新度监测模型
AFI等级
NOI浓度估算值/ (个·cm-3)
AFI等级
NOI浓度估算值/ (个·cm-3)
福州市闽清县七叠温泉
1级
3 165
龙岩市新罗区培斜村
1级
3 007
福州市福清市大山村
2级
2 298
三明市漳平市永福镇
2级
2 115
厦门市同安区顶村村
1级
3 525
三明市大田县屏山乡
2级
2 064
厦门市海沧区森林公园
2级
2 284
三明市明溪县夏阳乡
1级
2 937
莆田市仙游县西苑乡
1级
3 092
三明市尤溪县度假区
2级
2 525
泉州市德化县国宝乡
1级
3 410
南平市政和县杨源乡
3级
1 867
泉州市永春县牛姆林区
1级
3 134
南平市建阳区黄坑镇
2级
2 530
泉州市永春县苏坑镇
1级
3 021
南平市延平区上洋村
2级
2 088
泉州市南安市向阳乡
1级
3 159
宁德市福安市白云山
1级
2 834
漳州市南靖县土楼景区
1级
2 904
宁德市屏南县寿山乡
2级
2 567
漳州市龙海区鹭凯庄园
2级
2 163
宁德市屏南县龙潭村
1级
2 812
龙岩市武平县城厢镇
2级
2 567
宁德市古田县泮洋乡
1级
3 167
Tab.6 福建省24个“气候康养福地”空气清新度等级和NOI浓度估算值
[1]
刘国庭. 北戴河疗养环境对健康的影响[J]. 中国疗养医学, 2004, 13(1):7-10.
Liu G T. Effect of convalescent and health in environment of Beidaihe[J]. Chinese Journal of Convalescent Medicine, 2004, 13(1):7-10.
[2]
Jiang S Y, Ma A, Ramachandran S. Negative air ions and their effects on human health and air quality improvement[J]. International Journal of Molecular Sciences, 2018, 19(10):2966.
[3]
Chu C H, Chen S R, Wu C H, et al. The effects of negative air ions on cognitive function:An event-related potential (ERP) study[J]. International Journal of Biometeorology, 2019, 63(10):1309-1317.
Peng W, Li M W, Wang H, et al. A review of the research progress of negative air ion at home and abroad and its positive role in forest health[J]. Journal of Temperate Forestry Research, 2020, 3(3):11-14,54.
[6]
Li T, Hu R, Chen Z, et al. Fine particulate matter (PM2.5):The culprit for chronic lung diseases in China[J]. Chronic Diseases and Translational Medicine, 2018, 4(3):176-186.
Wang W, Che C L. Effect of exposure of atmospheric fine particles on the pathogenesis of idiopathic pulmonary interstitial fibrosis[J]. Journal of Clinical Pulmonary Medicine, 2021, 26(11):1759-1762.
[9]
夏廉博. 有益于人体健康的负离子[J]. 大众医学, 1981,(7):36-37.
Xia L B. The negative ions beneficial to human health[J]. Popular Medicine, 1981,(7):36-37.
Rao X J. Discussion on the present situation and practical significance of negative oxygen ion research[J]. Sci-Tech & Development of Enterprise, 2015(16):27-28,31.
Li S N, Han S W, Shang T Y, et al. Research progress on aero-anion’s monitoring and evaluation at home and abroad[J]. Journal of Anhui Agricultural Sciences, 2009, 37(8):3736-3738.
Ye H M, Zheng M Z, Jiang J Q, et al. Distribution of negative oxygen ions concentration and assessment of air quality in campus[J]. Journal of Jixi University, 2015, 15(4):153-156.
Kong J J, Lin J M, Zhang J S. Construction and application of attribute assessment model of air anion[J]. Environmental Science Survey, 2008, 27(5):84-86.
Jiang C H, Wu X S, Wang W Q, et al. Analysis of related meteorological factors change and negative oxygen ion concentration in Suqian City[J]. Environmental Protection and Circular Economy, 2011, 31(8):55-58.
Zhou D P, Tong W H, Wen R H, et al. Air negative ions distribution and air quality assessment in Dachaoyang scenic of Yiwulushan,Liaoning,China[J]. Journal of Arid Land Resources and Environment, 2015, 29(3):181-187.
Wang B, Xie F Y, Zhang Z X, et al. Forecast model establishment of air negative oxygenion in Yuxi[J]. Plateau Meteorology, 2015, 34(1):251-257.
doi: 10.7522/j.issn.1000-0534.2014.00131
Cong J, Sun L J. Distribution of negative oxygen ion concentration and its forecast model in Dalian,Liaoning Province[J]. Journal of Meteorology and Environment, 2010, 26(4):44-47.
Jin M. The study on the time-space change of air anion and the influential factors in different ecological environment in Hefei city[D]. Hefei: Anhui Agricultural University, 2005.
Wu J Y, Cheng Z H, Long Y Z, et al. The variation of aero-anion concentration on landscape forest[J]. Journal of Nanjing Forestry University, 2003, 27(4):78-80.
Jin Q, Yan J, Yang Z B, et al. Spatial-temporal characteristics of spring air negative oxygen ions and its relationship with environmental factors in Hubei[J]. Meteorological Science and Technology, 2015, 43(4):728-733.
Zhao L, Wu K T, Chen M. Study on the distribution of negative oxygen ion concentration and forecast equation of main scenic spots in Hainan Province[J]. Journal of Anhui Agricultural Sciences, 2016, 44(29):189-191,208.
Chen Z H, Lin Z L, Lin J B. Distribution of negative oxygen ion concentration in Dehua atmosphere and establishment of prediction equation[J]. Straits Science, 2021(2):45-48,69.
Zhu D M, Zeng L, Liu C S. Application of air negative oxygen ion concentration prediction model in tourism meteorology[J]. China Resources Comprehensive Utilization, 2021, 39(8):73-75,86.
Gu X L, Qian Y Z, Bao Y J, et al. The distribution of oxygen anion concentration,forecasting model in Ningbo and its application in tourism meteorology[J]. Journal of Meteorology and Environment, 2013, 29(6):128-133.
Zhang Y, Chen L Y, Liu T, et al. Change characteristics and prediction model about concentration of anions in the Emei Mountain scenic spot[J]. Journal of Meteorology and Environment, 2018, 34(2):61-68.
Ding L H, Gu Z H, Wu D, et al. Establishment of prediction model of negative oxygen ion concentration in Kaihua County[J]. Journal of Zhejiang Agricultural Sciences, 2017, 58(11):1957-1960.
Chen L F, Tao J H, Wang Z F, et al. Review of satellite remote sensing of air quality[J]. Journal of Atmospheric and Environmental Optics, 2015, 10(2):117.
Xiang J, Tao M H, Guo L, et al. Progress of near-surface PM2.5 concentration retrieve based on satellite remote sensing[J]. National Remote Sensing Bulletin, 2022, 26(9):1757-1776.
[35]
Lee H J, Chatfield R B, Strawa A W. Enhancing the applicability of satellite remote sensing for PM2.5 estimation using MODIS deep blue AOD and land use regression in California,United States[J]. Environmental Science & Technology, 2016, 50(12):6546-6555.
Li Y H, Wang Y, Yi Q C, et al. The study on air quality change of Nanchang City from 2004 to 2015 years based on satellite remote sensing MODIS data[J]. Journal of Jiangxi Normal University (Natural Science Edition), 2019, 43(2):214-220.
[37]
Yang Z, Zdanski C, Farkas D, et al. Evaluation of aerosol optical depth (AOD) and PM2.5 associations for air quality assessment[J]. Remote Sensing Applications:Society and Environment, 2020, 20:100396.
[38]
Wei J, Huang W, Li Z, et al. Estimating 1-km-resolution PM2.5 concentrations across China using the space-time random forest approach[J]. Remote Sensing of Environment, 2019, 231:111221.
[39]
Zeng Z, Gui K, Wang Z, et al. Estimating hourly surface PM2.5 concentrations across China from high-density meteorological observations by machine learning[J]. Atmospheric Research, 2021, 254:105516.
Fujian Provincial Department of Ecology and Environment. Fujian ecological environment status Bulletin.(1995—2022)[EB/OL]. [2024-06-06]. https://sthjt.fujian.gov.cn/zwgk/sjfb/hjsj/qshjzkgb/.
Pan Q, Shi H Y, Zhang W Q, et al. Spatiotemporal distribution of rat population density in grassland on the north slope of Tianshan Mountains based on Cubist model[J]. Arid Land Geography, 2022, 45(4):1200-1211.
Wen G F. Research on downscaling of GPM satellite precipitation data based on Cubist algorithm in Linfen city[J]. Technical Supervision in Water Resources, 2023, 31(11):59-61,78.
Quan S, Liu Y H, Liu M H, et al. Spatial and temporal characteristics and correlation analysis of meteorological factors on PM2.5 concentration in Henan Province from 2014 to 2020[J]. Environmental Monitoring in China, 2023, 39(1):69-80.
Wei X J, Zhao X M, Wang Q, et al. The analysis of the influence of meteorological factors on PM2.5 concentration based on characteristic index[J]. Environmental Monitoring in China, 2022, 38(6):90-100.
Zhou M D, Kuang Y Q, Yun G L. Analysis of driving factors of atmospheric PM2.5 concentration in Guangzhou city based on geo-detector[J]. Research of Environmental Sciences, 2020, 33(2):271-279.
Wang Y R, Zhang X X, Zhao J Y, et al. Temporal and spatial distribution of PM2.5 and its relationship with vegetation coverage in Beijing during the period of 2013─2014[J]. Ecology and Environmental Sciences, 2016, 25(1):103-111.
Yang Y L, Yang K, Luo Y, et al. Effect of vegetation coverage on the temporal and spatial distribution of PM2.5 concentration in China’s eight major economic regions from 1998 to 2016[J]. Environmental Science, 2021, 42(11):5100-5108.
Li Y. Distribution pattern of negative oxygen ions and PM2.5:A case study of comparison between forest areas and urban areas in Xi’an City[J]. Technology Innovation and Application, 2016(22):178.
 2024, Vol. 36
  ), 彭继达1,2