Spatiotemporal evolution of sea surface temperature in the East China Sea
WANG Ping1(), MAO Kebiao2(), MENG Fei1, YUAN Zijin2
1. School of Surveying and Geo-Informatics, Shandong Jianzhu University, Jinan 250101, China 2. Institute of Agricultural Resources and Regional Planning, Chinese Academy of Agricultural Sciences, Beijing 100081, China
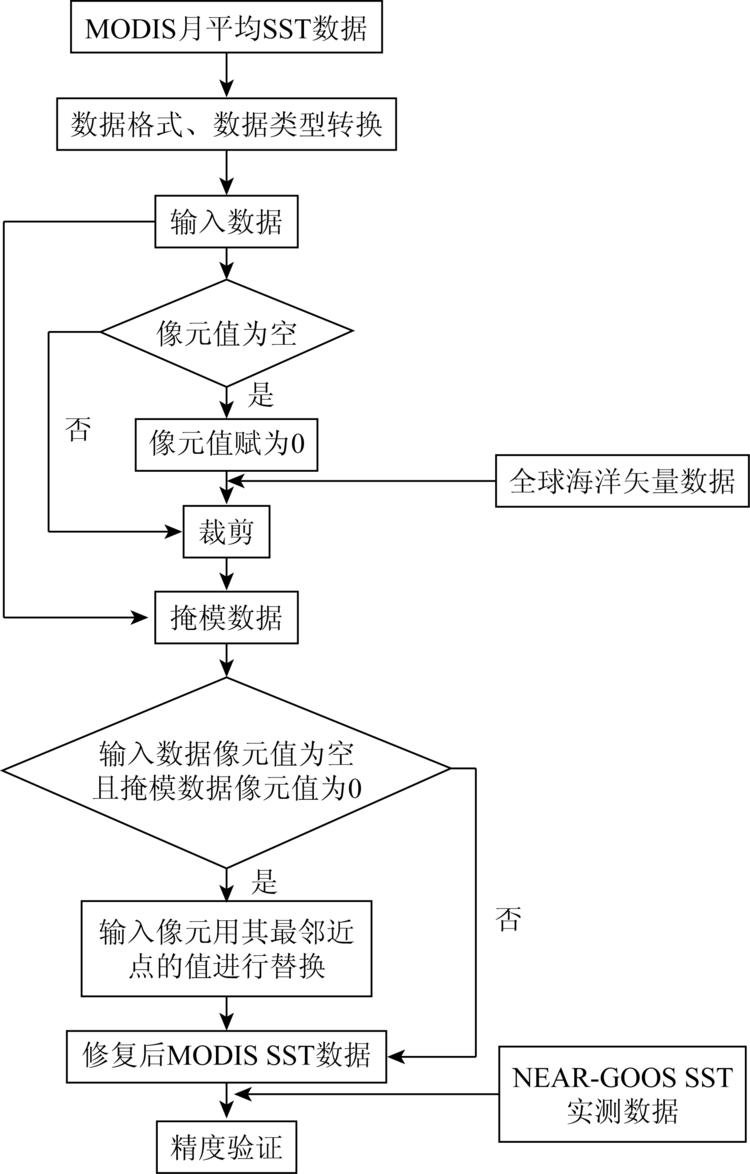
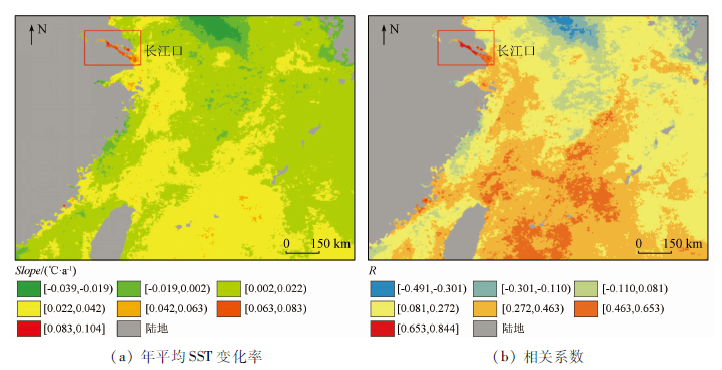
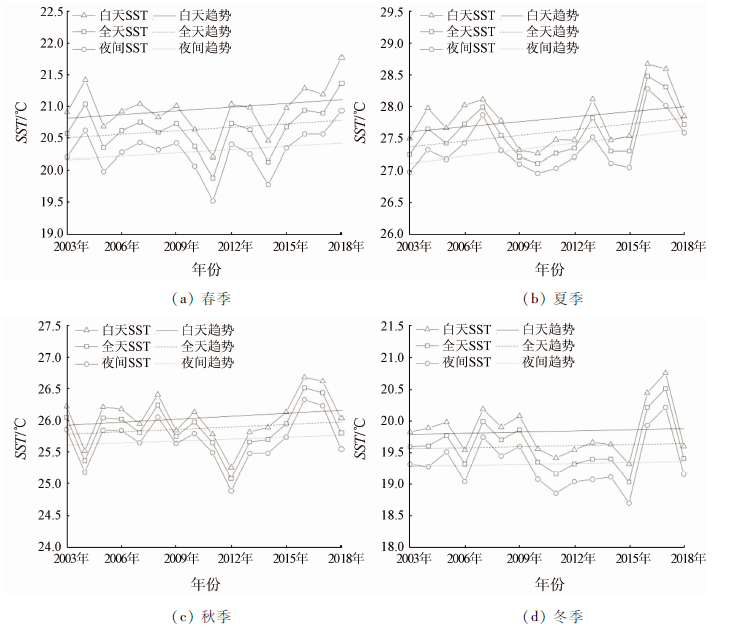
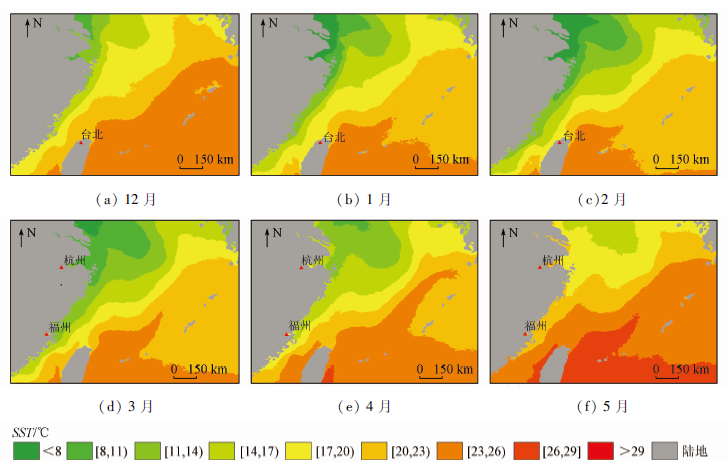
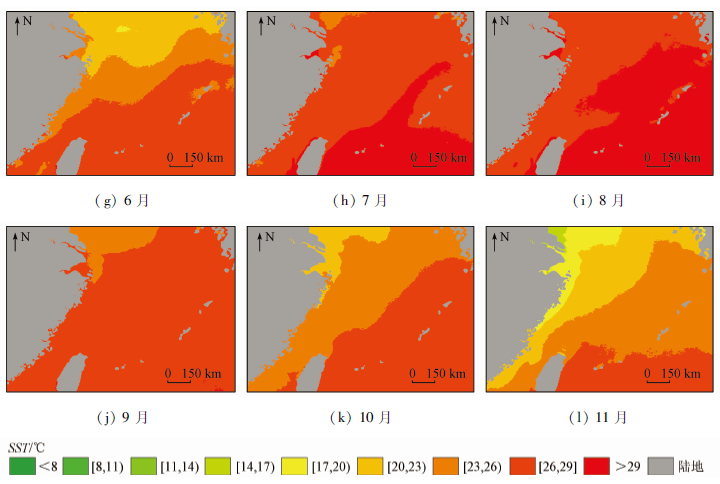
In order to grasp the law of sea surface temperature (SST) change in the East China Sea from 2003 to 2018, the authors analyzed the relationship between SST changes and climate anomalies, and used remote sensing data to monitor the temporal and spatial evolution of SST in the East China Sea for 16 years. With the 2003—2018 MODIS SST product as the data source, the data were first repaired by the nearest neighbor point value replacement method, and the measured data were used to verify the accuracy. The least square method and Pearson correlation coefficient were used to analyze the SST change trend. Through cross-correlation analysis, the correlation between sea surface temperature anomaly (SSTA) and southern oscillation index (SOI) was studied. The results are as follows: ① SST in the East China Sea generally showed an upward trend from 2003 to 2018, and the temperature rise in summer was more obvious. The temperature rise rate in the Yangtze River estuary could reach above 0.042 ℃/a; ② SST in the East China Sea showed a SE—NW distribution, and at the same latitude, SST near the mainland was usually lower than the eastern sea area, but the SST of Hangzhou Bay area from April to September was higher than that of the eastern area; ③ SOI was basically not related to the East China Sea SSTA that was 15 months behind it, but it had a strong negative correlation with the East China Sea SSTA that was 21~39 months behind with correlation coefficient exceeding -0.2. The research results can provide a reference for grasping the laws of climate change and predicting extreme weather.
王平, 毛克彪, 孟飞, 袁紫晋. 中国东海海表温度时空演化分析[J]. 国土资源遥感, 2020, 32(4): 227-235.
WANG Ping, MAO Kebiao, MENG Fei, YUAN Zijin. Spatiotemporal evolution of sea surface temperature in the East China Sea. Remote Sensing for Land & Resources, 2020, 32(4): 227-235.
Qiu H. Characteristics of sea temperature changes in the East China Sea and the adjacent Northwest Pacific over the past 140 years[D]. Shanghai:Shanghai Normal University, 2017.
Sun N N. Variations of sea surface temperature over Kuroshio in the East Sea and its relationship with El-Niño and global warming[D]. Qingdao:Ocean University of China, 2009.
Wang Z Z, Zuo J C, Chen M X, et al. Relationship between El Niño and sea surface temperature variation in coastal region of Yellow Sea and East China Sea[J]. Journal of Hohai University (Natural Sciences), 2012,40(4):461-468.
[4]
张琪. 中国近海海表温度的年代际变化及其对全球变暖的响应[D]. 青岛:中国海洋大学, 2014.
Zhang Q. The interdecadal variation of SST in the coastal China Seas and its response to global warming[D]. Qingdao:Ocean University of China, 2014.
[5]
Li G, Li C Y, Tan Y K, et al. The interdecadal changes of South Pacific Sea surface temperature in the mid-1990s and their connections with ENSO[J]. Advances in Atmospheric Sciences, 2014,31(1):66-84.
doi: 10.1007/s00376-013-2280-3
[6]
Robles-Tamayo C M, Valdez-Holguín J E, García-Morales R, et al. Sea surface temperature (SST) variability of the eastern coastal zone of the gulf of California[J]. Remote Sensing, 2018,10(9):1434-1456.
Tan H J, Cai R S, Huang R H. Enhanced responses of sea surface temperature over offshore China to global warming and hiatus[J]. Climate Change Research, 2016,12(6):500-507.
Hua C J, Wu Y M, Zhang H, et al. Analysis on the seasonal variability of sea surface temperature in the East the Yellow Sea in 2014[J]. Fishery Information and Strategy, 2016,31(3):193-205.
Zhang C G. Study on the utilization of satellite remote sensing for sea surface temperature of coastal area in Fujian Province[J]. Remote Sensing for Land and Resources, 1999,11(1):25-28.doi: 10.6046/gtzyyg.1999.01.06.
Chen X D, Cui X S. Application study on relationship between bigeye tuna fishing grounds and environment in the eastern and central Pacific Ocean by satellite remote sensing[J]. Remote Sensing Information, 2006(1):25-28.
[16]
Haines S L, Jedlovec G J, Lazarus S M. A MODIS sea surface temperature composite for regional applications[J]. Geoscience and Remote Sensing, 2007,45(9):2919-2927.
Sun F Q, Zhang C Y, Shang S P, et al. Primary validation of AVHRR/MODIS/TMI SST for part of the northwest Pacific[J]. Journal of Xiamen University(Natural Science), 2007,46(1):1-5.
Li X D. Primary validation of moderate resolution imaging spectroradiometer (MODIS) sea surface temperature in the Taiwan Strait[J]. Journal of Oceanography in Taiwan Strait, 2011,30(3):336-340.
Ding Y Z. Data reconstruction and assimilation experiment of satellite sea surface temperature and suspended sediment concentration[D]. Nanjing:Nanjing University of Science and Technology, 2009.
Ma Z P, Jing A Q. Dynamic interpolation and its application in data assimilation[J]. Journal of Hebei University (Natural Science Edition), 2004,24(6):574-580.
Tan J G, Zhou H M, Lu X, et al. Research and establishment in operation system of cloud detection and rehabilitation applied to NOAA satellite[J]. Remote Sensing Technology and Application, 2000,15(4):228-231.
Mao Z H, Zhu Q K, Pan D L, et al. Method of satellite-measured sea surface temperature charts for north Pacific fishery grounds[J]. Journal of Fishery Sciences of China, 2003,10(6):502-506.
Zhao H L, Zhang D D, Huang S, et al. Analysis on the relation between cloud-to-ground lightning density and lightning trip rate in Hainan Province based on Pearson correlation coefficient[J]. High Voltage Apparatus, 2019,55(8):186-192.
Xu B, Chen X J, Tian S Q, et al. Effects of El Niño/La Niña on distribution of fishing ground of Dosidicus gigas off Peru waters[J]. Journal of Fisheries of China, 2012,36(5):696-707.
Wang W X, Lin Y D, Xu G X, et al. Impact of El Niño or La Niño on the typhoon landed in South China from 1951 to 2016[J]. Subtropical Soil and Water Conservation, 2018,30(2):13-19.
Liu S F, Chen H, Lin Z H. Numerical simulation of the impact of sea surface temperature anomalies on the climate anomalies over China in January 2008[J]. Climatic and Environmental Research, 2008,13(4):500-509.
 2020, Vol. 32
  ), 毛克彪2(