Please wait a minute...
 
Remote Sensing for Natural Resources    2024, Vol. 36 Issue (1) : 250-266     DOI: 10.6046/zrzyyg.2022389
|
Post-flood recovery assessment based on multi-source remote sensing data:A case study of the “7·20” rainstorm in Henan
LI Mengqi(), LI Gongquan(), XIE Zhihui
School of Geoscience, Changjiang University,Wuhan 430100, China
Download: PDF(32274 KB)   HTML
Export: BibTeX | EndNote | Reference Manager | ProCite | RefWorks    
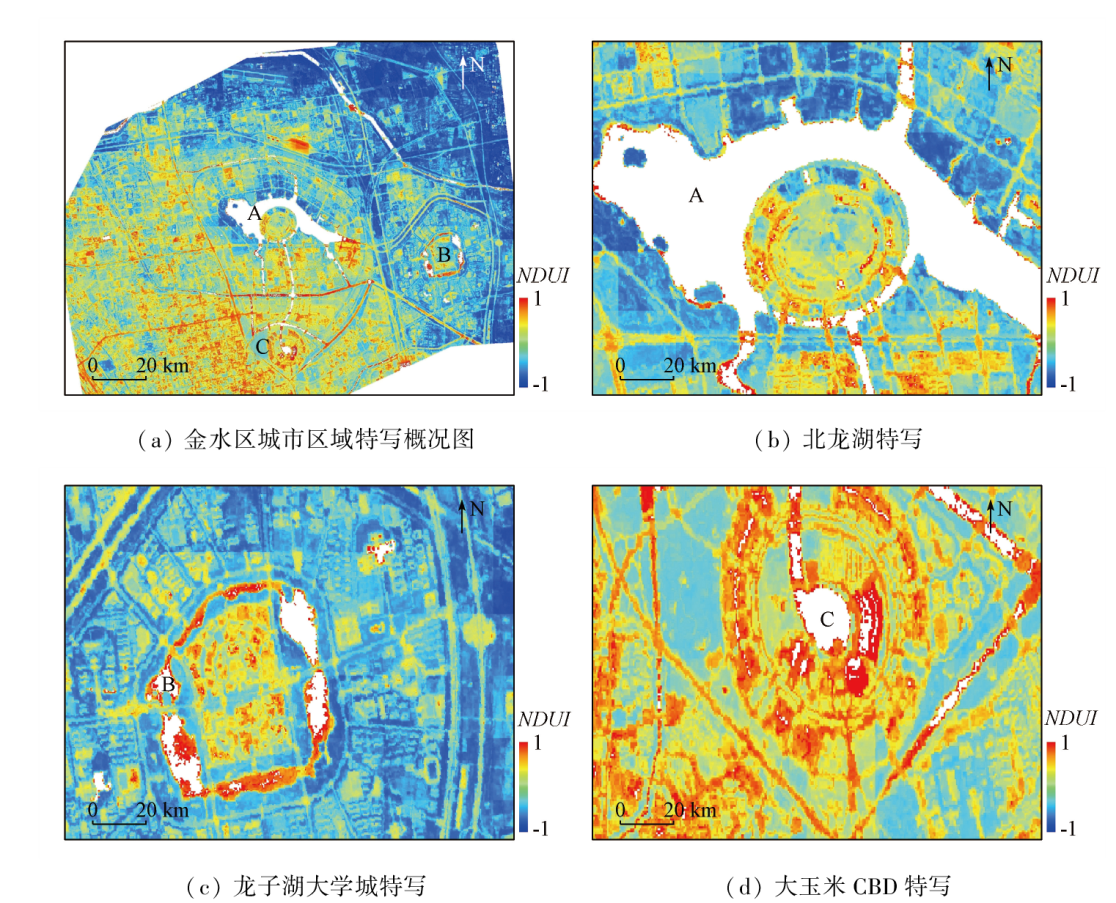
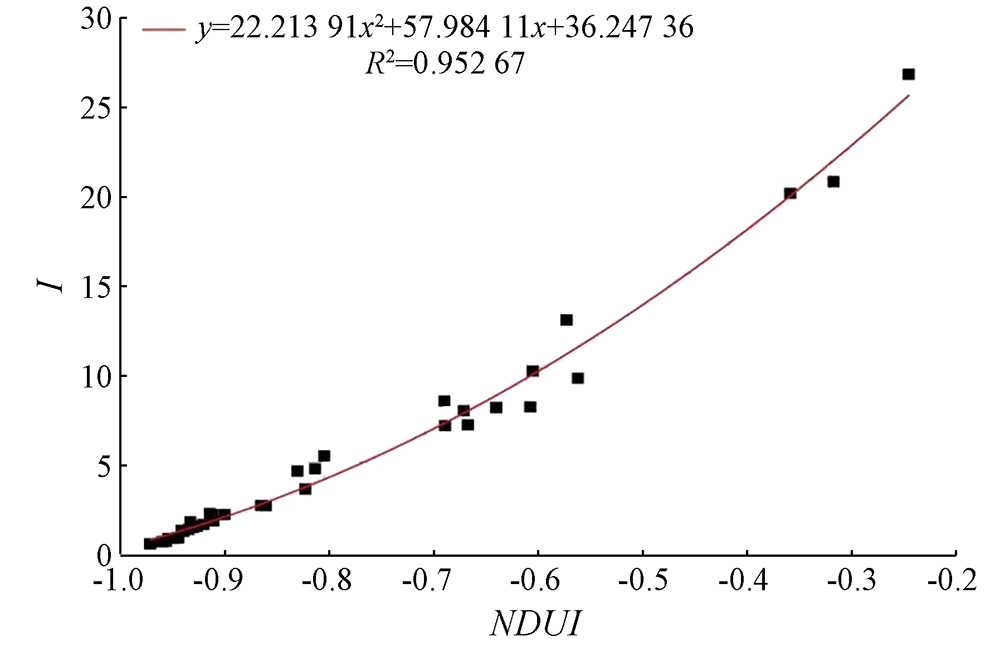
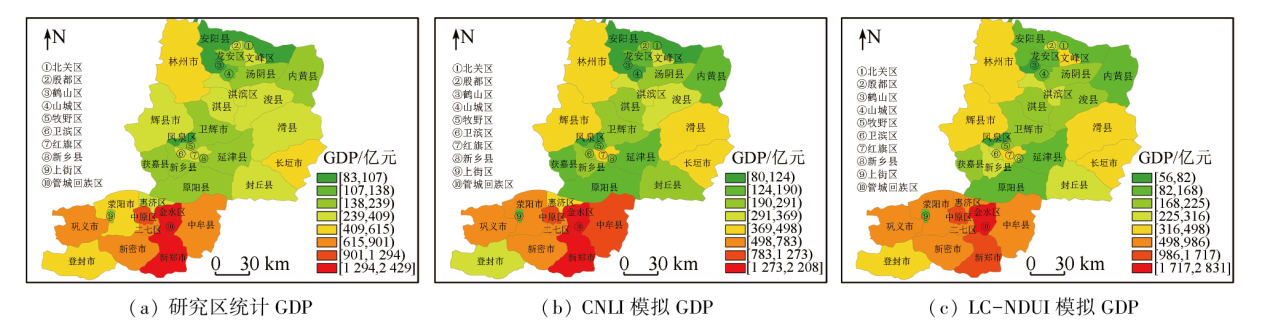
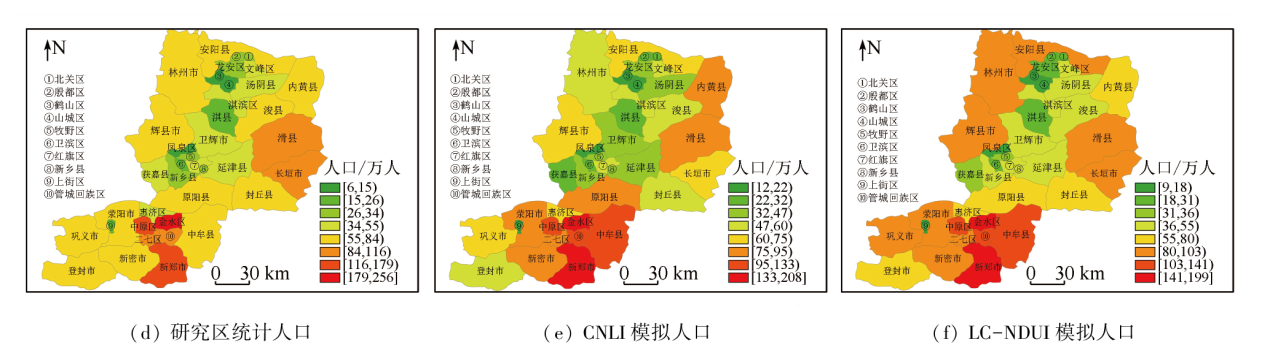
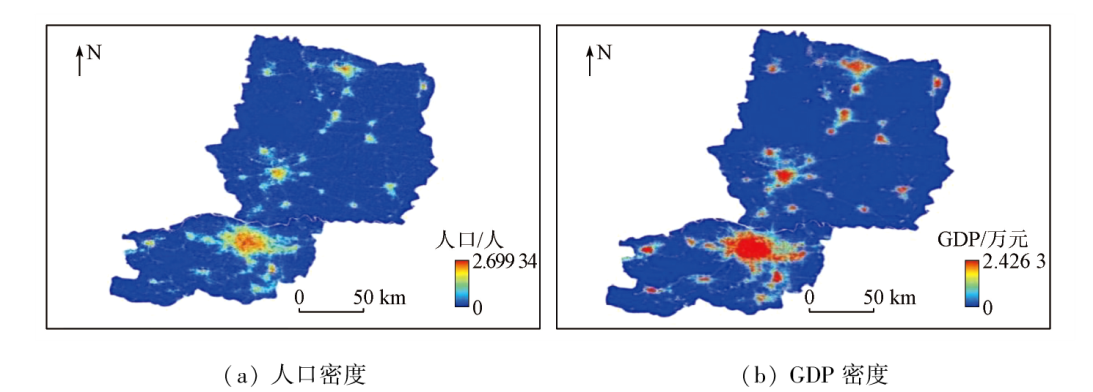
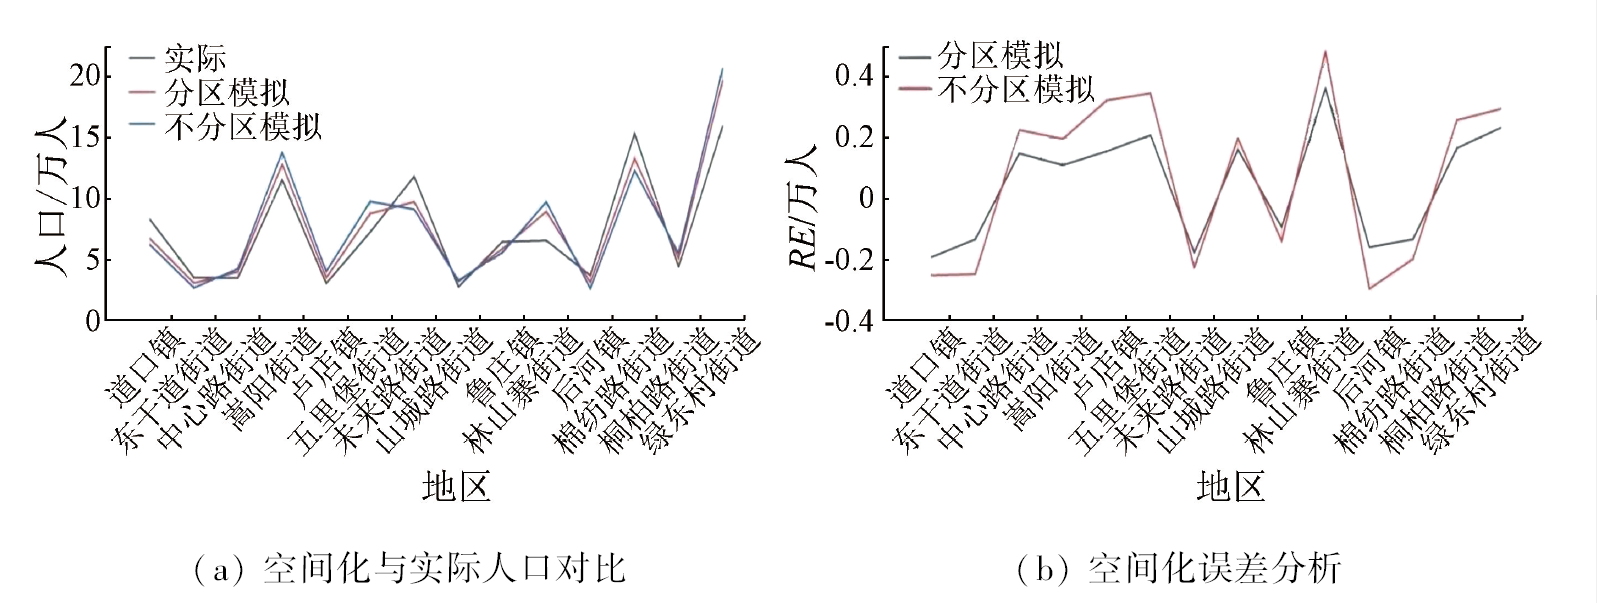
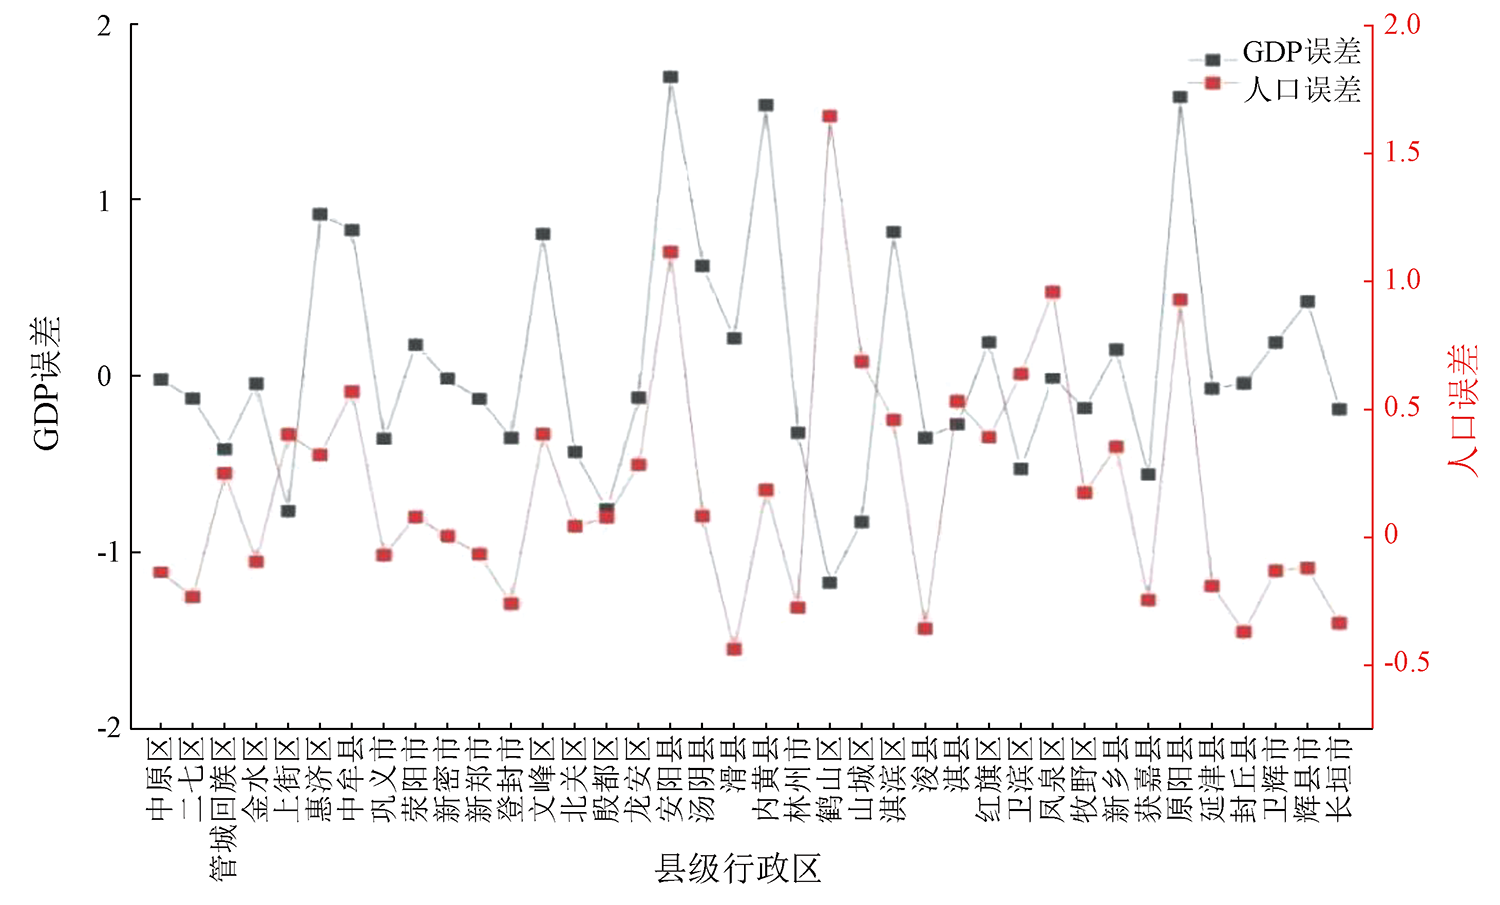
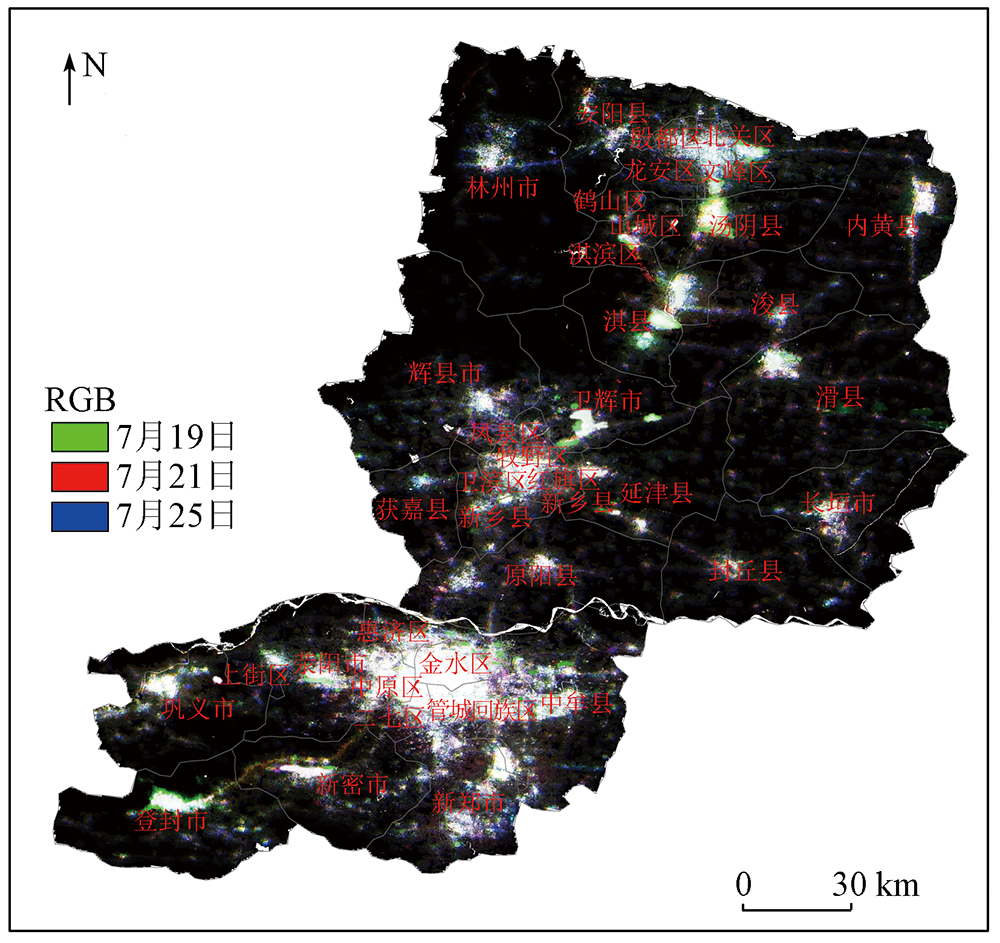
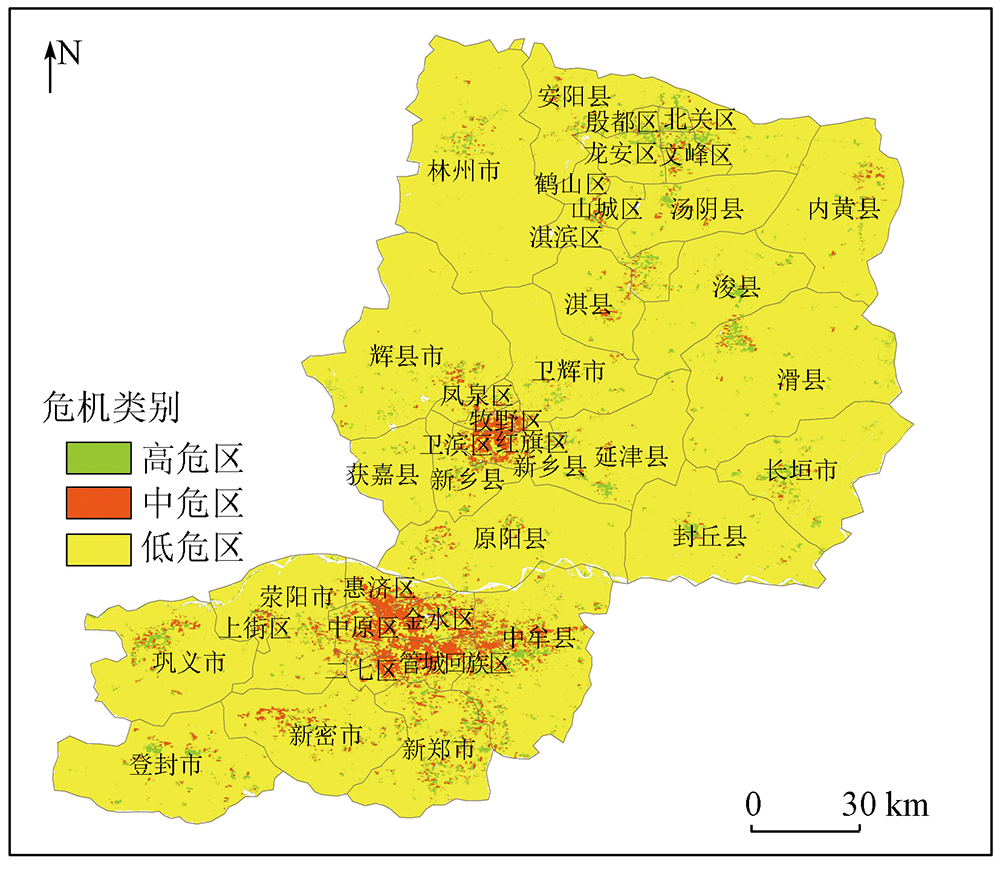
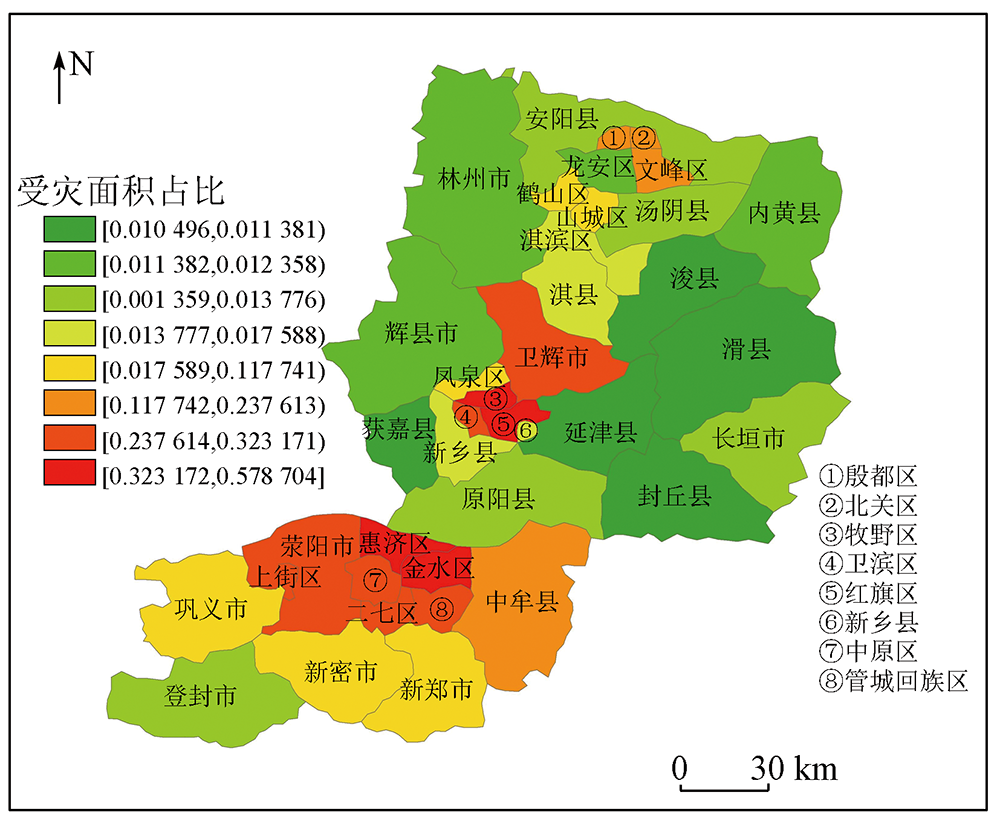
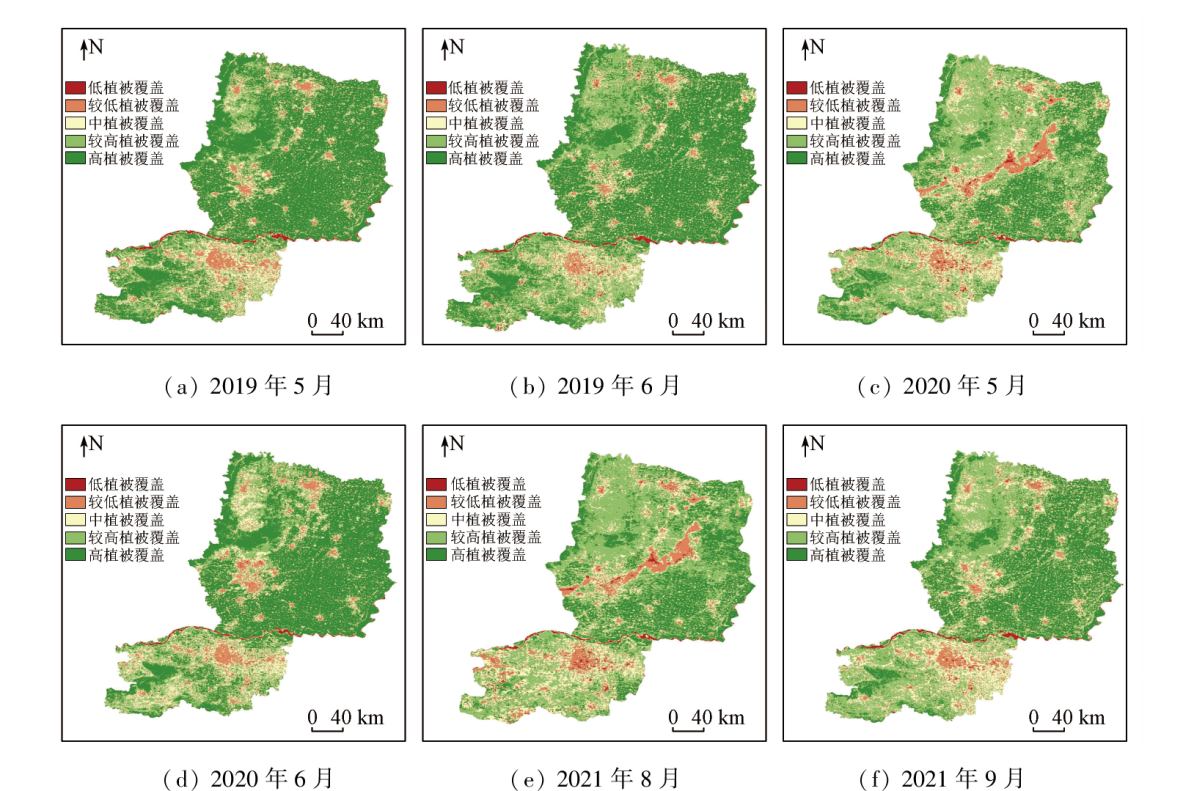
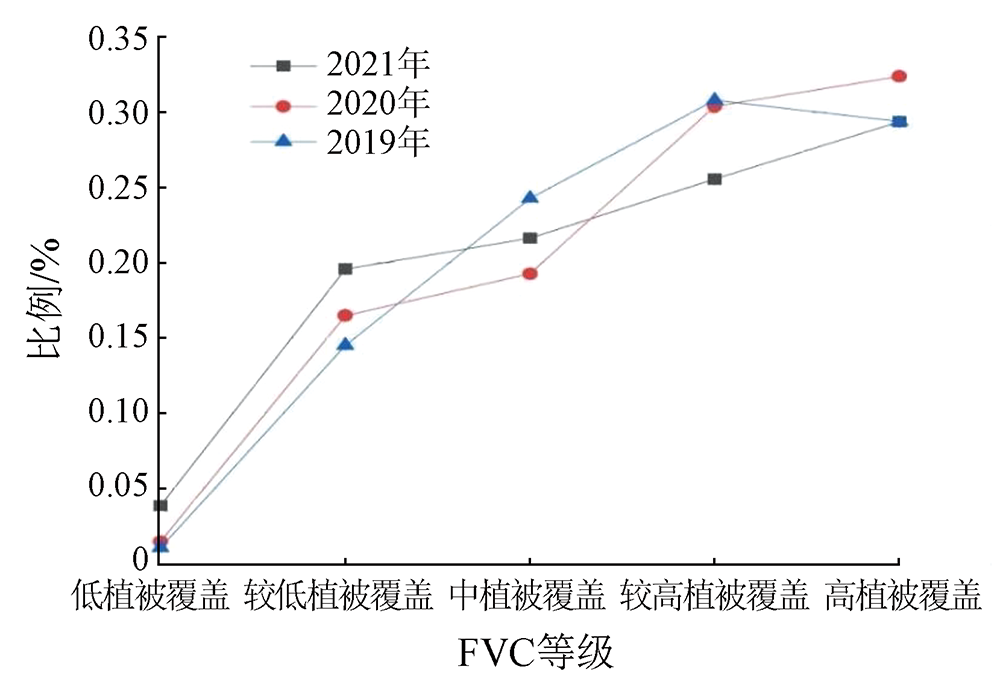
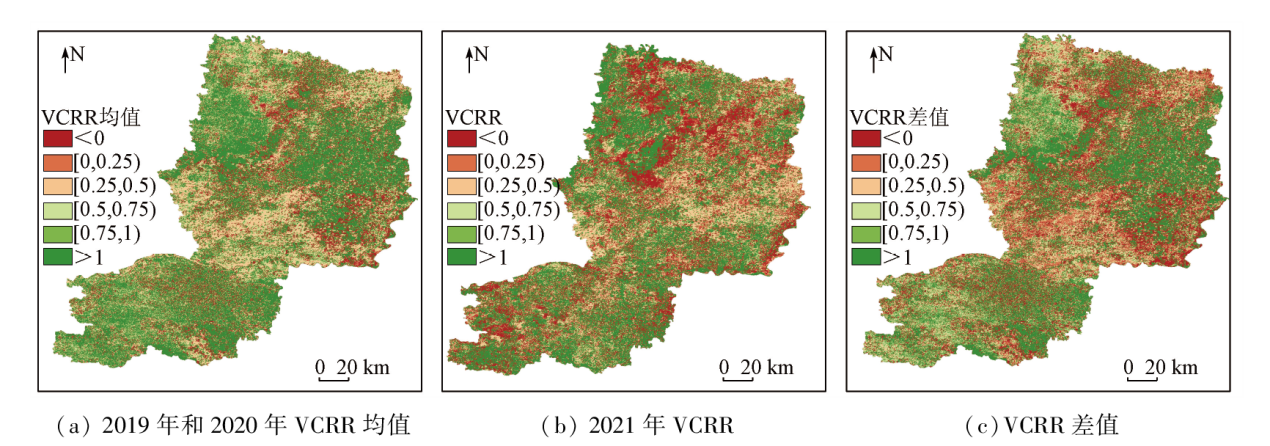
Abstract  

Quantitative post-flood recovery assessment based on vegetation and lighting indices is critical for assessing economic reconstruction and ecological restoration in afflicted areas. This study investigated the “7.20” rainstorm disaster area in Henan. Based on the daily and monthly NPP-VIIRS data, Sentinel-NDVI and MODIS-EVI data, and statistical yearbook data, this study characterized the spatial intricacies within urban areas by constructing a normalized difference urban index (NDUI). Then, it simulated the population and GDP distributions by employing a regression model. Finally, this study assessed the post-flood recovery from two distinct aspects: nighttime light data and vegetation cover data. The results are as follows: ① High- and medium-risk zones covered an area of 1 429.04 km2, accounting for 6.06% of the total study area. High-risk zones were primarily distributed in western Zhengzhou, eastern Xinxiang, eastern Anyang, and northern Hebi, with Zhengzhou suffering the most severe impact; ② In terms of the vegetation cover recovery rate (VCRR), low overall vegetation recovery was observed in Weihui and Linzhou cities and Qixian and Huaxian counties, with VCRRs mostly below 0. This indicates a deteriorating vegetation cover trend; ③ The fitting between NDUI and socio-economic statistical data yielded accuracy exceeding 0.8, suggesting that the NDUI can be applied to precise location-based rescue and targeted post-disaster reconstruction in the aftermath of floods. Additionally, the assessment results based on NPP-VIIRS and MODIS-EVI data were highly complementary, implying that the flood research based on the integration of the two types of data enjoys high application value for post-disaster rescue and recovery assessment.

Keywords “7·20” rainstorm in Henan      NDUI      NPP-VIIRS      lighting index      fractional vegetation cover      vegetation cover recovery rate     
ZTFLH:  TP315  
Issue Date: 13 March 2024
Service
E-mail this article
E-mail Alert
RSS
Articles by authors
Mengqi LI
Gongquan LI
Zhihui XIE
Cite this article:   
Mengqi LI,Gongquan LI,Zhihui XIE. Post-flood recovery assessment based on multi-source remote sensing data:A case study of the “7·20” rainstorm in Henan[J]. Remote Sensing for Natural Resources, 2024, 36(1): 250-266.
URL:  
https://www.gtzyyg.com/EN/10.6046/zrzyyg.2022389     OR     https://www.gtzyyg.com/EN/Y2024/V36/I1/250
Fig.1  Density map of river network in the study area
Fig.2  Main technical process
Fig.3  Changes in the total amount of EVI by cities from 2019 to 2021
Fig.4  NDVI, TNL, NDUI and GlobeLand30 in Jinshui District in 2021
Fig.5  Close-up of the urban area of Jinshui District
Fig.6  Fitting diagram of NDUI and I
模型 TNL I CNLI LC-NDUI
GDP GDPD GDP GDPD GDP GDPD GDP GDPD
线性 0.766 36 0.274 23 0.518 53 0.856 71 0.484 62 0.863 24 0.379 81 0.846 29
非线性 0.785 79 0.360 36 0.591 03 0.857 87 0.588 71 0.863 77 0.582 02 0.878 43
指数 0.684 27 0.314 87 0.577 43 0.735 23 0.571 82 0.804 52 0.596 28 0.814 53
对数 0.315 47 0.226 76 0.304 05 0.592 51 0.482 48 0.780 23 0.340 15 0.842 35
Tab.1  Correlation coefficients R2 of the light index and LC-NDUI with GDP
模型 TNL I CNLI LC-NDUI
TP PD TP PD TP PD TP PD
线性 0.815 72 0.241 83 0.311 64 0.892 19 0.311 84 0.900 62 0.179 99 0.871 39
非线性 0.815 79 0.367 55 0.558 36 0.892 67 0.494 14 0.900 97 0.486 25 0.881 12
指数 0.714 58 0.302 14 0.544 39 0.814 63 0.474 88 0.836 71 0.535 61 0.795 42
对数 0.352 41 0.183 55 0.164 63 0.712 65 0.269 89 0.843 25 0.181 97 0.764 82
Tab.2  Correlation coefficient R2 of the light index and LC with population
Fig.7-1  Statistical and simulated graphs of GDP and population in the study area
Fig.7-2  Statistical and simulated graphs of GDP and population in the study area
Fig.8  10-meter spatial resolution population and GDP density map of the study area in 2021
类型 要素 人口 GDP
地表覆盖 耕地像元数 -0.021 -0.027
林地像元数 -0.087 -0.103
草地像元数 -0.142 -0.102
人造地表像元数 0.604** 0.581
LC-NDUI 耕地LC-NDUI总量 0.434** 0.436**
林地LC-NDUI总量 0.342** 0.231**
草地LC-NDUI总量 0.579** 0.760**
人造地表LC-NDUI
总量
0.824** 0.813**
Tab.3  Correlation coefficients between the statistical values of GDP and population with each factor in each district and county
Fig.9  Population spatialization error statistics
Fig.10  Errors in GDP and population in different regions
模型 CNLI LC-NDUI
TRE MRE MAE RRMSE TRE MRE MAE RRMSE
线性 23.18 0.61 5 960.2 6.32 20.43 0.64 6 032.1 6.24
非线性 18.46 0.57 5 234.2 6.14 17.58 0.51 5 021.6 6.08
指数 31.52 0.73 6 243.5 7.59 34.29 0.68 6 148.9 7.95
对数 48.71 0.84 7 012.6 7.96 43.84 0.89 7 156.3 8.62
Tab.4  Error analysis of different indices and models
Fig.11  False color composite image of NPP-VIIRS DNB before and after the flood disaster
Fig.12  Distribution map of flood disaster crisis areas of the study area
Fig.13  Proportion of disaster-affected areas in each district and county
区名 区域面积/
km2
受灾面积/
km2
受灾面积
比例/%
区域人口/
万人
受灾人口/
万人
受灾人口
比例/%
区域GDP/
亿元
受灾GDP/
亿元
受灾经济
比例/%
中原区 192.34 29.46 10.32 150.88 22.88 15.16 1 294.42 248.46 19.19
二七区 147.76 22.95 11.54 106.13 17.71 16.69 784.23 192.40 24.53
管城回族区 196.10 37.88 12.32 114.82 23.35 20.34 2 429.88 253.67 10.44
金水区 225.55 55.83 16.75 230.27 27.61 21.99 2 300.76 300.11 23.04
上街区 50.36 8.38 16.73 19.74 5.59 28.34 176.80 60.63 24.29
惠济区 201.41 29.36 14.58 55.50 24.12 23.45 306.85 261.81 18.32
中牟县 1 337.81 34.55 2.58 96.24 15.75 16.36 830.56 165.27 19.90
巩义市 973.15 70.53 10.77 78.25 11.98 15.30 901.88 123.05 13.64
荥阳市 875.73 131.94 15.04 73.01 16.90 23.15 554.23 108.10 19.51
新密市 957.73 100.77 10.12 82.60 10.23 12.38 713.25 116.61 16.35
新郑市 853.87 110.88 10.39 179.36 9.24 5.15 1 966.14 103.59 5.27
登封市 1 173.37 40.43 3.38 72.93 12.54 17.19 548.20 140.60 25.65
文峰区 171.25 20.98 12.25 45.10 18.84 31.77 259.25 204.03 78.70
北关区 51.08 5.50 12.98 31.03 5.56 17.91 171.76 60.14 35.02
殷都区 58.31 2.44 4.19 28.70 6.30 21.96 327.87 68.20 20.80
龙安区 231.81 8.49 3.66 29.26 14.29 18.84 182.12 77.70 42.66
安阳县 1 065.92 49.02 4.60 84.56 12.62 14.93 107.47 137.20 27.67
汤阴县 619.19 19.74 3.19 44.31 6.53 14.74 175.36 131.29 14.87
滑县 1 758.17 20.39 1.16 116.91 11.45 9.80 409.77 207.91 12.74
内黄县 1 112.56 35.20 3.16 66.89 12.85 19.21 186.63 133.29 10.42
林州市 1 762.11 47.03 2.67 81.57 17.84 21.87 615.34 239.82 24.97
鹤山区 114.82 7.58 6.61 6.27 14.26 27.35 92.61 154.42 16.74
山城区 124.59 9.52 7.64 15.54 13.79 28.73 138.35 149.30 20.92
淇滨区 288.61 21.01 7.28 46.08 7.65 16.60 283.27 107.79 18.05
浚县 940.97 26.47 2.81 62.47 10.38 16.62 293.82 110.57 17.63
淇县 478.57 32.63 6.82 26.23 6.57 25.06 262.65 166.99 13.58
红旗区 150.76 26.87 17.82 45.74 10.82 23.64 395.74 193.49 18.89
卫滨区 70.36 6.68 9.50 22.57 8.26 36.58 322.03 89.64 17.83
凤泉区 115.35 7.49 6.49 15.86 13.02 32.09 83.14 141.15 16.78
牧野区 90.68 16.21 17.87 34.09 11.03 32.36 231.70 119.93 21.76
新乡县 372.93 24.29 6.51 34.86 7.08 20.30 239.40 145.03 11.58
获嘉县 457.85 15.23 3.33 41.48 8.78 21.18 192.11 127.86 20.56
原阳县 1 221.67 43.43 3.56 65.12 13.12 20.14 186.50 147.15 19.90
延津县 885.08 52.86 5.97 45.79 9.78 21.36 166.15 104.30 16.77
封丘县 1 152.53 88.59 7.69 71.86 12.64 17.59 264.05 138.14 19.31
卫辉市 713.36 89.27 12.51 49.14 9.21 38.74 186.25 103.45 32.54
辉县市 1420.82 94.35 6.64 75.99 11.99 15.78 359.04 193.46 16.88
长垣市 980.74 61.78 6.30 90.54 10.25 11.33 529.59 116.82 13.06
Tab.5  Simulation of the affected population, economy, area and the proportion of each affected
等级 FVC范围 植被情况
1 [0,0.2) 低植被覆盖
2 [0.2,0.4) 较低植被覆盖
3 [0.4,0.6) 中植被覆盖
4 [0.6,0.8) 较高植被覆盖
5 [0.8,1.0] 高植被覆盖
Tab.6  Classification of fractional vegetation cover
Fig.14  Spatial distribution of fractional vegetation cover in different years
Fig.15  Classification statistics of fractional vegetation cover in different years
等级 VCRR范围 植被恢复情况
1 <0 植被恢复差
2 [0,0.25) 植被恢复较差
3 [0.25,0.5) 植被恢复一般
4 [0.5,0.75) 植被恢复较好
5 [0.75,1.0] 植被恢复好
6 >1.0 植被完全恢复
Tab.7  Classification of vegetation cover recovery rate grades
Fig.16  Spatial distribution of vegetation cover recovery rate
VCRR分级 研究区 郑州市 新乡市 安阳市 鹤壁市
6.54 6.53 3.93 8.18 7.58
较差 14.74 11.43 11.30 20.65 15.27
一般 17.25 13.98 13.67 18.51 22.94
较好 9.95 9.15 8.68 11.34 10.63
16.19 17.36 18.91 14.41 14.09
完全恢复 35.36 41.55 43.51 26.91 29.50
Tab.8  Classification statistics of vegetation cover recovery rate (%)
Fig.17  Histogram of interannual variation of vegetation cover recovery rate at each grade
[1] 邱粲, 刘焕彬, 万程程, 等. 1984—2019年山东省暴雨洪涝灾害时空变化特征及其成因分析[J]. 灾害学, 2022, 37(4):57-63.
[1] Qiu C, Liu H B, Wan C C, et al. Tempo-spatial variation and cause analysis of rainstorms and related flood disasters in Shandong from 1984 to 2019[J]. Journal of Catastrophology, 2022, 37(4): 57-63.
[2] Pandey B, Joshi P K, Seto K C. Monitoring urbanization dynamics in India using DMSP/OLS night time lights and SPOT-VGT data[J]. International Journal of Applied Earth Observation and Geoinformation, 2013, 23:49-61.
doi: 10.1016/j.jag.2012.11.005 url: https://linkinghub.elsevier.com/retrieve/pii/S0303243412002383
[3] Joshi P K, Bairwa B M, Sharma R, et al. Assessing urbanization patterns over India using temporal DMSP-OLS night-time satellite data[J]. Current science, 2011, 100(10):1479-1482.
[4] 李斌, 燕琴, 张丽, 等. 长江中游洪涝灾害特征的MODIS时序监测与分析[J]. 武汉大学学报(信息科学版), 2013, 38(7):789-793,883-884.
[4] Li B, Yan Q, Zhang L, et al. Flood monitoring and analysis over the middle reaches of Yangtze River basin with MODIS time-series imagery[J]. Geomatics and Information Science of Wuhan University, 2013, 38(7):789-793,883-884.
[5] 许超, 蒋卫国, 万立冬, 等. 基于MODIS时间序列数据的洞庭湖区洪水淹没频率研究[J]. 灾害学, 2016, 31(1):96-101.
[5] Xu C, Jiang W G, Wan L D, et al. Research of flood submerged frequency in Dongting Lake region based on time series dataset of MODIS[J]. Journal of Catastrophology, 2016, 31(1):96-101.
[6] 张娜, 王萍, 桑会勇, 等. MODIS数据的洪水淹没亚像元制图研究[J]. 测绘科学, 2019, 44(2):164-170.
[6] Zhang N, Wang P, Sang H Y, et al. Study of sub-pixel mapping flood submerged range based on MODIS data[J]. Science of Surveying and Mapping, 2019, 44(2):164-170.
[7] 饶品增, 蒋卫国, 王晓雅, 等. 基于MODIS数据的洪涝灾害分析研究——以2017年洞庭湖区洪水为例[J]. 灾害学, 2019, 34(1):203-207.
[7] Rao P Z, Jiang W G, Wang X Y, et al. Flood disaster analysis disasters based on MODIS data:Taking the flood in Dongting Lake area in 2017 as an example[J]. Journal of Catastrophology, 2019, 34(1):203-207.
[8] 田玉刚, 廖小露, 张长兴. 基于时间序列MODIS影像的暴雨后作物淹没历时提取方法[J]. 遥感技术与应用, 2012, 27(5):778-783.
[8] Tian Y G, Liao X L, Zhang C X. Method on crop inundated time extraction after rainstorm using time series MODIS images[J]. Remote Sensing Technology and Application, 2012, 27(5):778-783.
[9] 李峰, 米晓楠, 刘军, 等. 基于NPP-VIIRS夜间灯光数据的北京市GDP空间化方法[J]. 国土资源遥感, 2016, 28(3):19-24. doi: 10.6046/gtzyyg.2016.03.04.
[9] Li F, Mi X N, Liu J, et al. Spatialization of GDP in Beijing using NPP-VIIRS data[J]. Land and resources remote sensing, 2016, 28(3):19-24.doi: 10.6046/gtzyyg.2016.03.04.
[10] 潘竟虎, 胡艳兴. 基于夜间灯光数据的中国多维贫困空间识别[J]. 经济地理, 2016, 36(11):124-131.
[10] Pan J H, Hu Y X. Spatial identification of multidimensional poverty in China based on nighttime light remote sensing data[J]. Economic Geography, 2016, 36 (11):124-131.
[11] 李钢. GIS支持下的浙江省台风灾害直接经济损失评估[D]. 南京: 南京信息工程大学, 2014.
[11] Li G. GIS assisted on assessment of direct economic losses from typhoon in Zhejiang Province[D]. Nanjing: Nanjing University of Information Science and Technology, 2014.
[12] Li S, Goldberg M D, Sjoberg W, et al. Assessment of the catastrophic Asia floods and potentially affected population in summer 2020 using VIIRS flood products[J]. Remote Sensing, 2020, 12(19):3176.
doi: 10.3390/rs12193176 url: https://www.mdpi.com/2072-4292/12/19/3176
[13] Sun D, Li S, Zheng W, et al. Mapping floods due to Hurricane Sandy using NPP VIIRS and ATMS data and geotagged Flickr imagery[J]. International Journal of Digital Earth, 2016, 9(5): 427-441.
doi: 10.1080/17538947.2015.1040474 url: https://www.tandfonline.com/doi/full/10.1080/17538947.2015.1040474
[14] 何原荣, 王晓荣, 柴春芳, 等. 基于NPP-VIIRS夜光遥感的洪水灾损评估及可视化[J]. 自然灾害学报, 2022, 31(3):93-105.
[14] He Y R, Wang X R, Chai C F, et al. Flood damage assessment and visualization based on NPP-VIIRS nighttime light remote sensing[J]. Journal of Natural Disasters, 2022, 31(3):93-105.
[15] 张宝军. 2003—2013年汶川地震极重灾区夜间灯光年际变化分析[J]. 灾害学, 2018, 33(1):12-18,22.
[15] Zhang B J. Analysis of the inter-annual variation of nighttime lights in the most affected area of Wenchuan earthquake from 2003 to 2013[J]. Journal of Catastrophology, 2018, 33 (1): 12-18,22.
[16] 关靖云, 李东, 王亚菲, 等. 中国区域DMSP-OLS与NPP-VIIRS夜间灯光影像校正[J]. 测绘通报, 2021(9):1-8.
doi: 10.13474/j.cnki.11-2246.2021.0264
[16] Guan J Y, Li D, Wang Y F, et al. DMSP-OLS and NPP-VIIRS night light image correction in China[J]. Bulletin of Surveying and Mapping, 2021(9):1-8.
doi: 10.13474/j.cnki.11-2246.2021.0264
[17] Jakubauskas M E, Legates D R, Kastens J H. Harmonic analysis of time-series AVHRR NDVI data[J]. Photogrammetric Engineering and Remote Sensing, 2001, 67(4):461-470.
[18] 王晓蕾, 石守海. 基于GEE的黄河流域植被时空变化及其地形效应研究[J]. 地球信息科学学报, 2022, 24(6):1087-1098.
doi: 10.12082/dqxxkx.2022.210685
[18] Wang X L, Shi S H. Spatio-temporal changes of vegetation in the Yellow River Basin and related effect of landform based on GEE[J]. Journal of Geo-Information Science, 2022, 24(6):1087-1098.
[19] 韩涛, 王大为. 2000—2014年石羊河流域植被覆盖变化研究[J]. 中国农学通报, 2017, 33(13):66-74.
doi: 10.11924/j.issn.1000-6850.casb17010105
[19] Han T, Wang D W. Change of vegetation coverage in Shiyang River Basin from 2000 to 2014[J]. Chinese Agricultural Bulletin, 2017, 33(13): 66-74.
[20] 洪艳, 赵银兵, 王运生, 等. 基于MODIS-NDVI汶川震中区域十年后植被恢复的时空变化特征分析[J]. 科学技术与工程, 2019, 19(16):64-74.
[20] Hong Y, Zhao Y B, Wang Y S, et al. Temporal and spatial variation characteristics of vegetation restoration based on MODIS-NDVI Wenchuan earthquake region in ten years[J]. Science Technology and Engineering, 2019, 19(16):64-74.
[21] Zhao M, Cheng W, Zhou C, et al. GDP spatialization and economic differences in South China based on NPP-VIIRS nighttime light imagery[J]. Remote Sensing, 2017, 9(7): 673.
doi: 10.3390/rs9070673 url: http://www.mdpi.com/2072-4292/9/7/673
[1] WANG Zheng, JIA Gongxu, ZHANG Qingling, HUANG Yue. Impacts of COVID-19 epidemic on the spatial distribution of GDP contributed by secondary and tertiary industries in Guangdong Province in the first quarter of 2020[J]. Remote Sensing for Natural Resources, 2021, 33(3): 184-193.
[2] LIU Yongmei, FAN Hongjian, GE Xinghua, LIU Jianhong, WANG Lei. Estimation accuracy of fractional vegetation cover based on normalized difference vegetation index and UAV hyperspectral images[J]. Remote Sensing for Natural Resources, 2021, 33(3): 11-17.
[3] CHEN Hong, GUO Zhaocheng, HE Peng. Spatial and temporal change characteristics of vegetation coverage in Erhai Lake basin during 1988—2018[J]. Remote Sensing for Land & Resources, 2021, 33(2): 116-123.
[4] Dan SHEN, Liang ZHOU, Peian WANG. Identification of poverty based on nighttime light remote sensing data: A case study on contiguous special poverty-stricken areas in Liupan Mountains[J]. Remote Sensing for Land & Resources, 2019, 31(2): 157-163.
[5] ZHANG Chengcai, LUO Weiran, DOU Xiaonan, WANG Jinxin. Research on the method of using Landsat8 data to improve FCD model[J]. REMOTE SENSING FOR LAND & RESOURCES, 2017, 29(4): 33-38.
[6] ZHENG Zhaoju, ZENG Yuan, ZHAO Yujin, ZHAO Dan, WU Bingfang. Monitoring and dynamic analysis of fractional vegetation cover in southwestern China over the past 15 years based on MODIS data[J]. REMOTE SENSING FOR LAND & RESOURCES, 2017, 29(3): 128-136.
[7] LIU Ying, HOU Enke, YUE Hui. Dynamic monitoring and trend analysis of vegetation change in Shendong mining area based on MODIS[J]. REMOTE SENSING FOR LAND & RESOURCES, 2017, 29(2): 132-137.
[8] LI Feng, MI Xiaonan, LIU Jun, LIU Xiaoyang. Spatialization of GDP in Beijing using NPP-VIIRS data[J]. REMOTE SENSING FOR LAND & RESOURCES, 2016, 28(3): 19-24.
[9] HE Haiyan, LING Feilong, WANG Xiaoqin, LIANG Zhifeng. Estimation of fractional vegetation coverage in water and soil loss area based on Radar vegetation index[J]. REMOTE SENSING FOR LAND & RESOURCES, 2015, 27(4): 165-170.
[10] LI Yuwei, JIA Kun, WEI Xiangqin, YAO Yunjun, SUN Jun, MOU Liqiu. Fractional vegetation cover estimation in northern China and its change analysis[J]. REMOTE SENSING FOR LAND & RESOURCES, 2015, 27(2): 112-117.
[11] ZHENG Zongsheng, ZHOU Yunxuan, TIAN Bo, WANG Jian, LIU Zhiguo. Effects of vegetation on the dynamic of tidal creeks based on quantitative satellite remote sensing:A case study of Dongtan in Chongming[J]. REMOTE SENSING FOR LAND & RESOURCES, 2014, 26(3): 117-124.
[12] ZHOU Zhi-qiang, ZENG Yuan, ZHANG Lei, DU Xin, WU Bing-fang. Remote Sensing Monitoring and Analysis of Fractional Vegetation Cover in the Water Source Area of the Middle Route of Projects to Divert Water from the South to the North[J]. REMOTE SENSING FOR LAND & RESOURCES, 2012, 24(1): 70-76.
Viewed
Full text


Abstract

Cited

  Shared   
  Discussed   
京ICP备05055290号-2
Copyright © 2017 Remote Sensing for Natural Resources
Support by Beijing Magtech