|
|
|
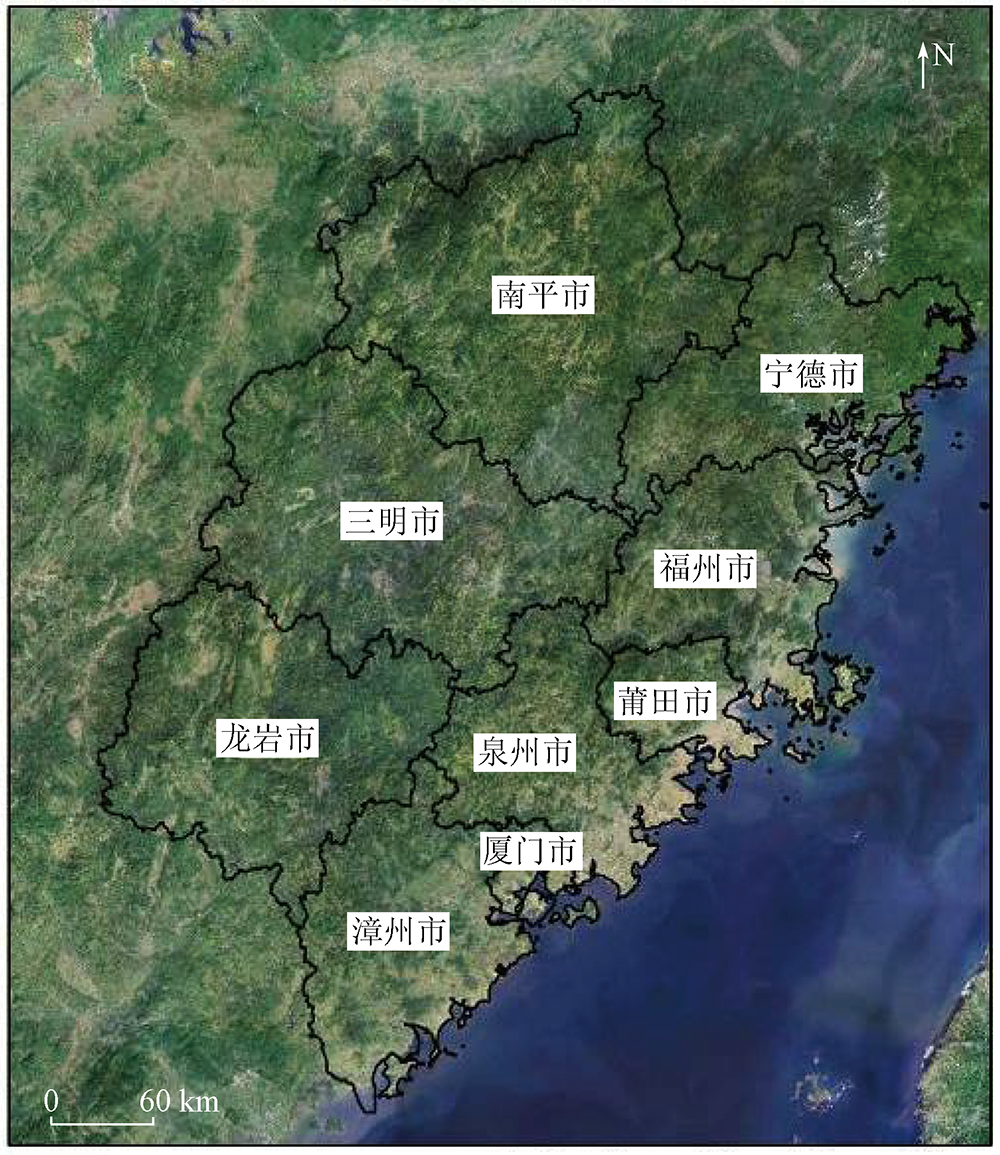
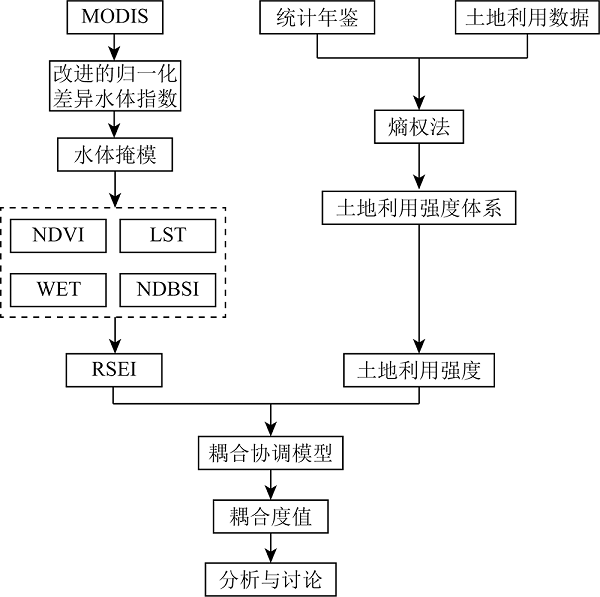
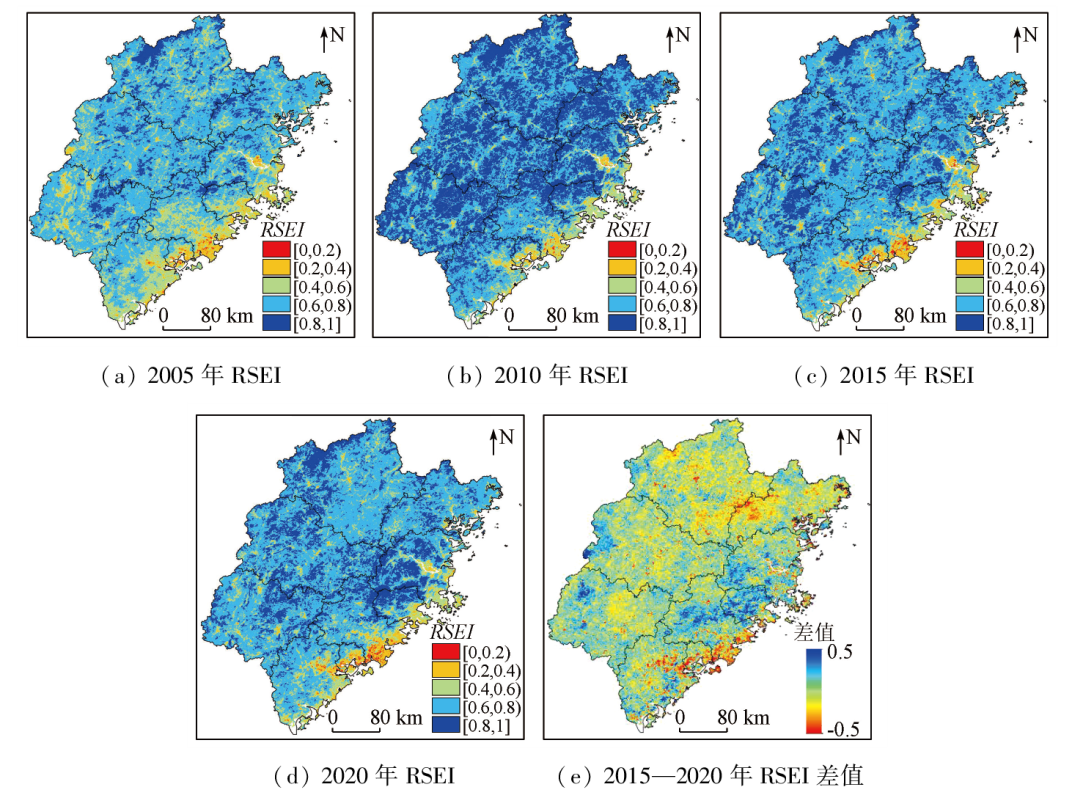
Abstract This study aims to explore the origin of the excellent ecology in Fujian Province in the past 15 years. First, a land use intensity system with a five-year time interval was constructed using the 2005—2020 MODIS images and land use data of Fujian as data sources. Then, the coupling relationship between the remote sensing ecological index (RSEI) and land use intensity was analyzed based on a coupled coordination model. Finally, the spatio-temporal evolution analysis was conducted for the ecological health of Fujian from 2005 to 2020. The results show that: ① The ecological environment of Fujian manifested an improvement-degradation-degradation trend, with an average RSEI value of 0.704 8 in 2020, suggesting a sound ecological environment; ② The land use intensity of Fujian displayed an increasing trend, with a growth rate of 26.00%. Most especially, Sanming City demonstrated a maximum increase of 160.91% in land use intensity; ③ The coupled coordination degree of Fujian increased by 0.729 0, suggesting high coordination. All cities in Fujian exhibited increased coupled coordination degrees, except for Xiamen City, where the coupled coordination degree decreased by 0.131 0, implying a slight imbalance. This study fills the gap in the research on the interactions between ecosystem health and land use intensity. It also provides a new perspective for ecological civilization construction and ecosystem health assessment in Fujian and even China.
|
| Keywords
Fujian
land use intensity
ecosystem health
coupled coordination
|
|
|
|
Issue Date: 13 March 2024
|
|
|
| [1] |
左璐, 孙雷刚, 鲁军景, 等. 基于MODIS的京津冀地区生态质量综合评价及其时空变化监测[J]. 自然资源遥感, 2022, 34(2):203-214.doi:10.6046/zrzyyg.2021224.
|
| [1] |
Zuo L, Sun L G, Lu J J, et al.. MODIS-based comprehensive assessment and spatial-temporal change monitoring of ecological quality in Beijing-Tianjin-Hebei region[J]. Remote Sensing for Natural Resources, 2022, 34(2):203-214.doi:10.6046/zrzyyg.2021224.
|
| [2] |
陈梦芸, 林广思. 基于自然的解决方案:一个容易被误解的新术语[J]. 南方建筑, 2019(3):40-44.
doi: 10.3969/j.issn.1000-0232.2019.03.040
|
| [2] |
Chen M Y, Lin G S. Nature-based solutions:A new term that is easily misunderstood[J]. South Architecture, 2019(3):40-44.
|
| [3] |
Morgan J A, LeCain D R, Pendall E, et al. C4 grasses prosper as carbon dioxide eliminates desiccation in warmed semi-arid grassland[J]. Nature, 2011, 476(7359):202-205.
doi: 10.1038/nature10274
|
| [4] |
Dong S, Shang Z, Gao J, et al. Enhancing sustainability of grassland ecosystems through ecological restoration and grazing management in an era of climate change on Qinghai-Tibetan Plateau[J]. Agriculture,Ecosystems and Environment, 2020, 287:106684.
doi: 10.1016/j.agee.2019.106684
url: https://linkinghub.elsevier.com/retrieve/pii/S0167880919303007
|
| [5] |
刘咏梅, 范鸿建, 盖星华, 等. 基于无人机高光谱影像的NDVI估算植被盖度精度分析[J]. 自然资源遥感, 2021, 33(3):11-17.doi:10.6046/zrzyyg.2020406.
|
| [5] |
Liu Y M, Fan H J, Ge X H, et al. Estimation accuracy of fractional vegetation cover based on normalized difference vegetation index and UAV hyperspectral images[J]. Remote Sensing for Natural Resources, 2021, 33(3):11-17.doi:10.6046/zrzyyg.2020406.
|
| [6] |
张彦敏, 张征云, 江文渊, 等. 天津市重要生态空间的生态变化遥感监测分析[J]. 环境生态学, 2020, 2(6):7-12.
|
| [6] |
Zhang Y M, Zhang Z Y, Jiang W Y, et al. Remote sensing monitoring and analysis of ecological changes in important ecological spaces in Tianjin[J]. Environmental Ecology, 2020, 2(6):7-12.
|
| [7] |
Wang G X, Li Y S, Wang Y B, et al. Effects of permafrost thawing on vegetation and soil carbon pool losses on the Qinghai-Tibet Plateau,China[J]. Geoderma, 2008, 143(1):143-152.
doi: 10.1016/j.geoderma.2007.10.023
url: https://linkinghub.elsevier.com/retrieve/pii/S0016706107003126
|
| [8] |
王雅婷, 朱长明, 张涛, 等. 2002—2020年秦岭—黄淮平原交界带植被物候特征遥感监测分析[J]. 自然资源遥感, 2022, 34(4):225-234.doi:10.6046/zrzyyg.2021400.
|
| [8] |
Wang Y T, Zhu C M, Zhang T, et al. Remote sensing monitoring and analysis of the vegetation phenological characteristics of the Qinling Mountains-Huanghuai Plain ecotone from 2002 to 2020[J]. Remote Sensing for Natural Resources, 2022, 34(4):225-234.doi:10.6046/zrzyyg.2021400.
|
| [9] |
胡小飞, 唐宪, 胡月明, 等. 广州市城市森林净初级生产力遥感估算[J]. 中南林业科技大学学报, 2016, 36(5):19-25.
|
| [9] |
Hu X F, Tang X, Hu Y M, et al. Estimation of net primary productivity of urban forest ecological system in Guangzhou City[J]. Journal of Central South University of Forestry and Technology, 2016, 36(5):19-25.
|
| [10] |
Bosch A, Dörfer C, He J S, et al. Predicting soil respiration for the Qinghai-Tibet Plateau:An empirical comparison of regression models[J]. Pedobiologia, 2016, 59(1):41-49.
doi: 10.1016/j.pedobi.2016.01.002
url: https://linkinghub.elsevier.com/retrieve/pii/S0031405616300026
|
| [11] |
Veldhuis M P, Ritchie M E, Ogutu J O, et al. Cross-boundary human impacts compromise the Serengeti-Mara ecosystem[J]. Science (American Association for the Advancement of Science), 2019, 363(6434):1424-1428.
|
| [12] |
van Klink R, van der Plas F, van Noordwijk C G E T, et al. Effects of large herbivores on grassland arthropod diversity[J]. Biological Reviews of the Cambridge Philosophical Society, 2015, 90(2):347-366.
doi: 10.1111/brv.12113
pmid: 24837856
|
| [13] |
程军, 李云祯, 邹渝. 新疆干旱时空动态及其对气候变化的响应[J]. 自然资源遥感, 2022, 34(4):216-224.doi:10.6046/zrzyyg.2021389.
|
| [13] |
Cheng J, Li Y Z, Zou Y. Spatial and temporal dynamics of drought in Xinjiang and its response to climate change[J]. Remote Sensing for Natural Resources, 2022, 34(4):216-224.doi:10.6046/zrzyyg.2021389.
|
| [14] |
冯丹阳, 张强, 周美华. 生态文明视野下可持续发展的未来路径[J]. 生态经济, 2022, 38(5):215-221.
|
| [14] |
Feng D Y, Zhang Q, Zhou M H. The future path of sustainable development from the perspective of ecological civilization[J]. Ecological Economy, 2022, 38(5):215-221.
|
| [15] |
宋爽, 田大方, 毛靓. 国家湿地公园社会功能评价指标体系构建及应用——以白渔泡国家湿地公园为例[J]. 湿地科学, 2019, 17(2):237-243.
|
| [15] |
Song S, Tian D F, Mao L. Construction and application of evaluation index system of social functions of national wetland park:A case study of Baiyupao National Wetland Park[J]. Wetland Science, 2019, 17(2):237-243.
|
| [16] |
李红星, 黄解军, 梁友嘉, 等. 基于遥感生态指数的武汉市生态环境质量评估[J]. 云南大学学报(自然科学版), 2020, 42(1):81-90.
|
| [16] |
Li H X, Huang J J, Liang Y J, et al. Evaluating the quality of ecological environment in Wuhan based on remote sensing ecological index[J]. Journal of Yunnan University (Natural Sciences Edition), 2020, 42(1):81-90.
|
| [17] |
吴双. 煤矿沉陷区生态环境遥感监测与评价——以马泰壕矿区为例[D]. 徐州: 中国矿业大学, 2021.
|
| [17] |
Wu S. Remote sensing monitoring and evaluation of ecological environment in coal mine subsidence area[D]. Xuzhou: China University of Mining and Technology, 2021.
|
| [18] |
方贺, 张育慧, 何月, 等. 浙江省植被生态质量时空变化及其驱动因素分析[J]. 自然资源遥感, 2023, 35(2):245-254.doi:10.6046/zrzyyg.2022070.
|
| [18] |
Fang H, Zhang Y H, He Y, et al. Spatio-temporal variations of vegetation ecological quality in Zhejiang Province and their driving factors[J]. Remote Sensing for Natural Resources, 2023, 35(2):245-254.doi:10.6046/zrzyyg.2022070.
|
| [19] |
王丽春, 焦黎, 来风兵, 等. 基于遥感生态指数的新疆玛纳斯湖湿地生态变化评价[J]. 生态学报, 2019, 39(8):2963-2972.
|
| [19] |
Wang L C, Jiao L, Lai F B, et al. Evaluation of ecological changes based on a remote sensing ecological index in a Manas Lake wetland,Xinjiang[J]. Acta Ecologica Sinica, 2019, 39(8):2963-2972.
|
| [20] |
鲁钰, 赵银娣, 董霁红. 西北地区三维生态足迹生态安全评价及驱动力分析[J]. 生态学报, 2022, 42(4):1354-1367.
|
| [20] |
Lu Y, Zhao Y D, Dong J H. Ecological security evaluation and driving force analysis of three-dimensional ecological footprint in Northwestern China[J]. Acta Ecologica Sinica, 2022, 42(4):1354-1367.
|
| [21] |
熊曦. 基于DPSIR模型的国家级生态文明先行示范区生态文明建设分析评价——以湘江源头为例[J]. 生态学报, 2020, 40(14):5081-5091.
|
| [21] |
Xiong X. Analysis and evaluation of ecological civilization construction in national ecological civilization pilot area based on DPSIR model:Taking the source of Xiangjiang River as an example[J]. Acta Ecologica Sinica, 2020, 40(14):5081-5091.
|
| [22] |
Gao X, Shen J, He W, et al. Spatial-temporal analysis of ecosystem services value and research on ecological compensation in Taihu Lake basin of Jiangsu Province in China from 2005 to 2018[J]. Journal of Cleaner Production, 2021, 317:128241.
doi: 10.1016/j.jclepro.2021.128241
url: https://linkinghub.elsevier.com/retrieve/pii/S0959652621024586
|
| [23] |
牛晓楠, 倪欢, 陈国光, 等. 福建省生态保护重要性评价[J]. 生态学报, 2022, 42(3):1130-1141.
|
| [23] |
Niu X N, Ni H, Chen G G, et al. Evaluation of ecological conservation importance of Fujian Province[J]. Acta Ecologica Sinica, 2022, 42(3):1130-1141.
|
| [24] |
刘业轩, 石晓丽, 史文娇. 福建省森林生态系统水源涵养服务评估:InVEST模型与meta分析对比[J]. 生态学报, 2021, 41(4):1349-1361.
|
| [24] |
Liu Y X, Shi X L, Shi W J. Evaluation of water retention services of forest ecosystems in Fujian Province:Comparison between results from the InVEST model and meta-analysis[J]. Acta Ecologica Sinica, 2021, 41(4):1349-1361.
|
| [25] |
柴哲彬, 孙阳, 付长超, 等. 习近平的绿色发展理念:完善“顶层设计”加固“四梁八柱”[J]. 中国环境监察, 2017(6):9-13.
|
| [25] |
Chai Z B, Sun Y, Fu C C, et al. Xi Jinping’s green development concept:Improving the “top-level design” and strengthening the “four pillars”[J]. China Environment Supervision, 2017(6):9-13.
|
| [26] |
福建省人民政府发展研究中心课题组, 卓祖航, 李立敏, 等. 福建省生态文明建设的历程与启示[J]. 发展研究, 2018(10):46-54.
|
| [26] |
Fujian provincial people’s government development research center subject group, Zhuo Z H, Li L M, et al. The history and inspiration of ecological civilization in Fujian Province[J]. Development Research, 2018(10):46-54.
|
| [27] |
王小娜, 田金炎, 李小娟, 等. Google Earth Engine云平台对遥感发展的改变[J]. 遥感学报, 2022, 26(2):299-309.
|
| [27] |
Wang X N, Tian J Y, Li X J, et al. Benefits of Google Earth Engine in remote sensing[J]. National Remote Sensing Bulletin, 2022, 26(2):299-309.
doi: 10.11834/jrs.20211317
url: http://www.ygxb.ac.cn/zh/article/doi/10.11834/jrs.20211317/
|
| [28] |
Yang J, Huang X. The 30 m annual land cover dataset and its dynamics in China from 1990 to 2019[J]. Earth System Science Data, 2021, 13(8):3907-3925.
doi: 10.5194/essd-13-3907-2021
url: https://essd.copernicus.org/articles/13/3907/2021/
|
| [29] |
陈晓辉, 曾晓莹, 赵超超, 等. 基于遥感生态指数的道路网络生态效应分析——以福州市为例[J]. 生态学报, 2021, 41(12):4732-4745.
|
| [29] |
Chen X H, Zeng X Y, Zhao C C, et al. The ecological effect of road network based on remote sensing ecological index:A case study of Fuzhou City,Fujian Province[J]. Acta Ecologica Sinica, 2021, 41(12):4732-4745.
|
| [30] |
孔玲玲, 冯险峰, 武爽, 等. 拉萨城市圈1994—2017年生态质量的时空动态监测及驱动力分析[J]. 地理科学进展, 2022, 41(3):437-450.
doi: 10.18306/dlkxjz.2022.03.007
|
| [30] |
Kong L L, Feng X F, Wu S, et al. Spatiotemporal dynamics and driving factor analysis of ecological quality change in the Lasa urban circle from 1994 to 2017[J]. Progress in Geography, 2022, 41(3):437-450.
|
| [31] |
徐涵秋. 水体遥感指数研究进展[J]. 福州大学学报(自然科学版), 2021, 49(5):613-625.
|
| [31] |
Xu H Q. Development of remote sensing water indices:A review[J]. Journal of Fuzhou University(Natural Science Edition), 2021, 49(5):613-625.
|
| [32] |
李霞, 朱万泽, 舒树淼, 等. 基于主成分分析的大渡河中游干暖河谷草地土壤质量评价[J]. 生态学报, 2021, 41(10):3891-3900.
|
| [32] |
Li X, Zhu W Z, Shu S M, et al. Soil quality assessment of grassland in dry and warm valley of Dadu River based on principal component analysis[J]. Acta Ecologica Sinica, 2021, 41(10):3891-3900.
|
| [33] |
Oehl F, Sieverding E, Ineichen K, et al. Impact of land use intensity on the species diversity of Arbuscular Mycorrhizal Fungi in agroecosystems of central Europe[J]. Applied and Environmental Microbiology, 2003, 69(5):2816-2824.
doi: 10.1128/AEM.69.5.2816-2824.2003
pmid: 12732553
|
| [34] |
Abecker A, Bernardi A, Maus H, et al. Information supply for business processes:Coupling workflow with document analysis and information retrieval[J]. Knowledge-Based Systems, 2000, 13(5):271-284.
doi: 10.1016/S0950-7051(00)00087-3
url: https://linkinghub.elsevier.com/retrieve/pii/S0950705100000873
|
|
Viewed |
|
|
|
Full text
|
|
|
|
|
Abstract
|
|
|
|
|
Cited |
|
|
|
|
| |
Shared |
|
|
|
|
| |
Discussed |
|
|
|
|
 2024,
Vol. 36
2024,
Vol. 36
 ), TANG Tingyuan2, LIN Zhen1(