|
|
|
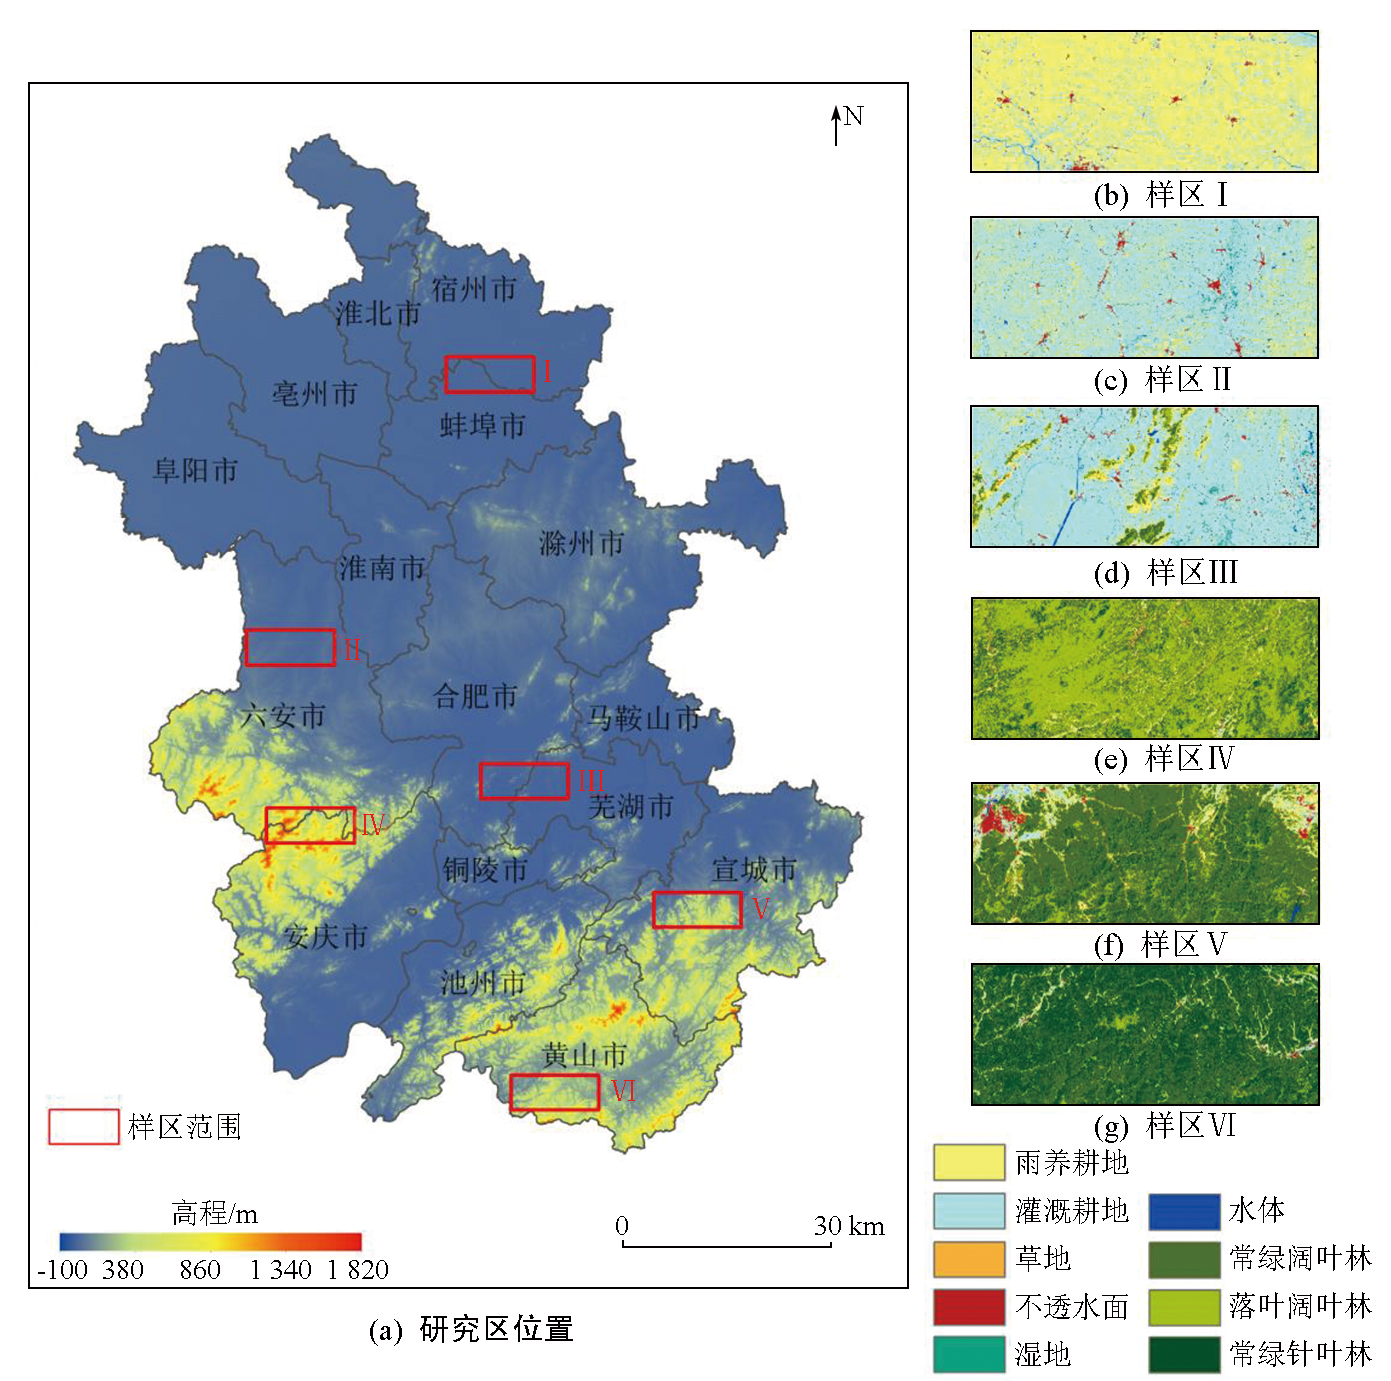
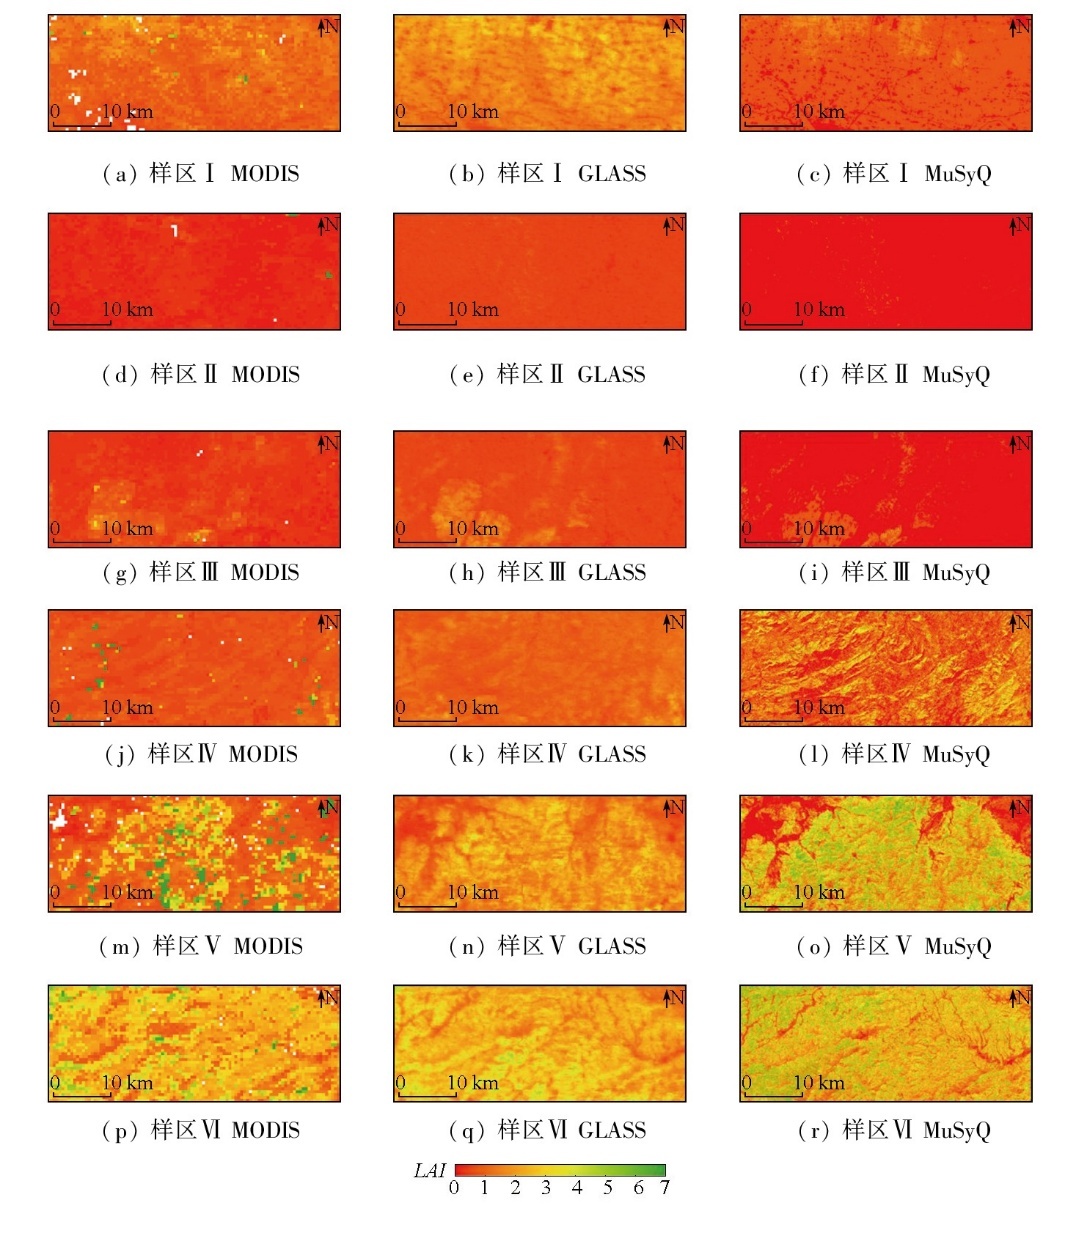
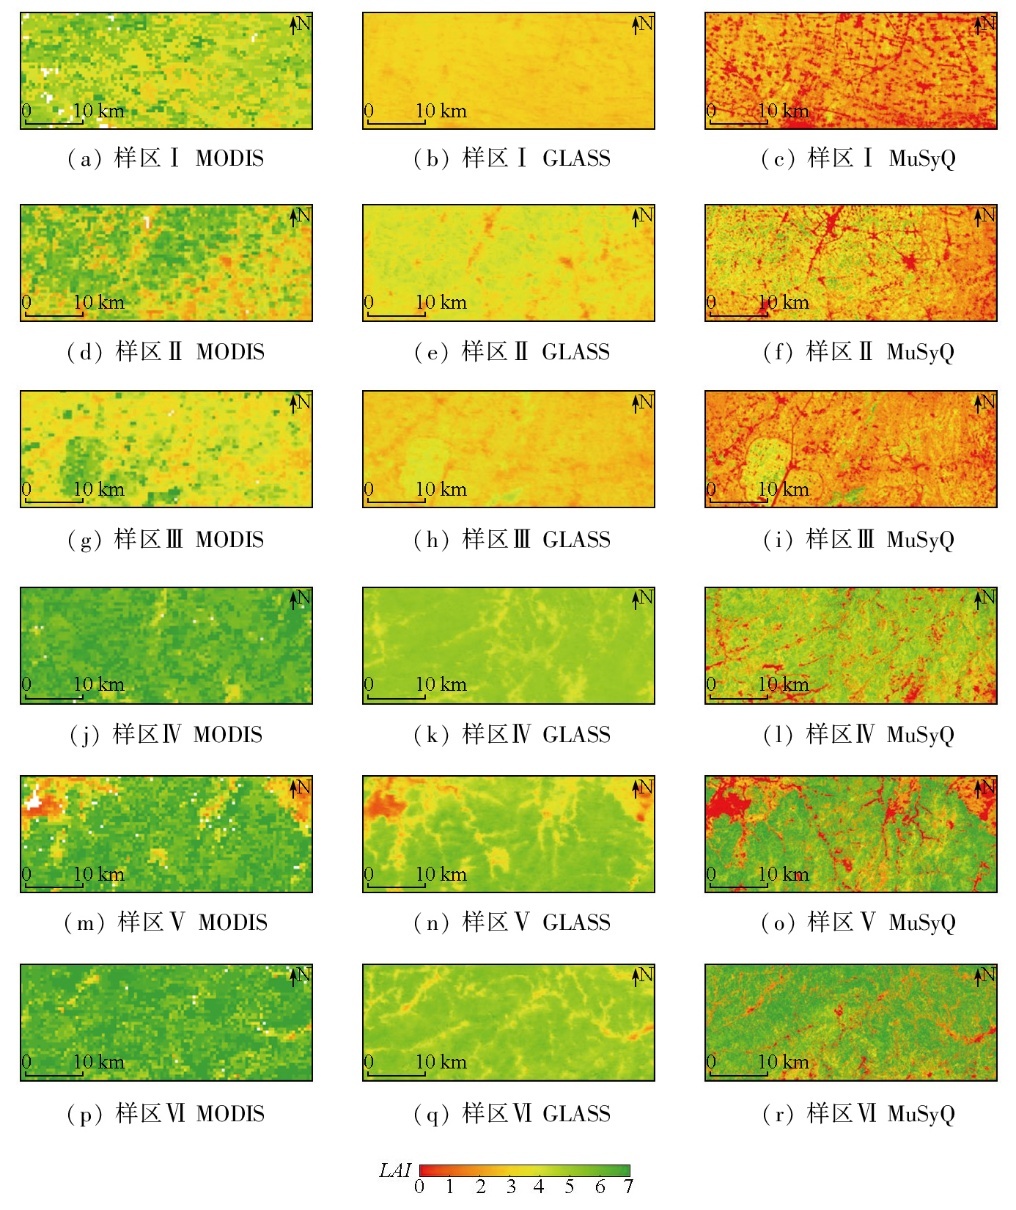
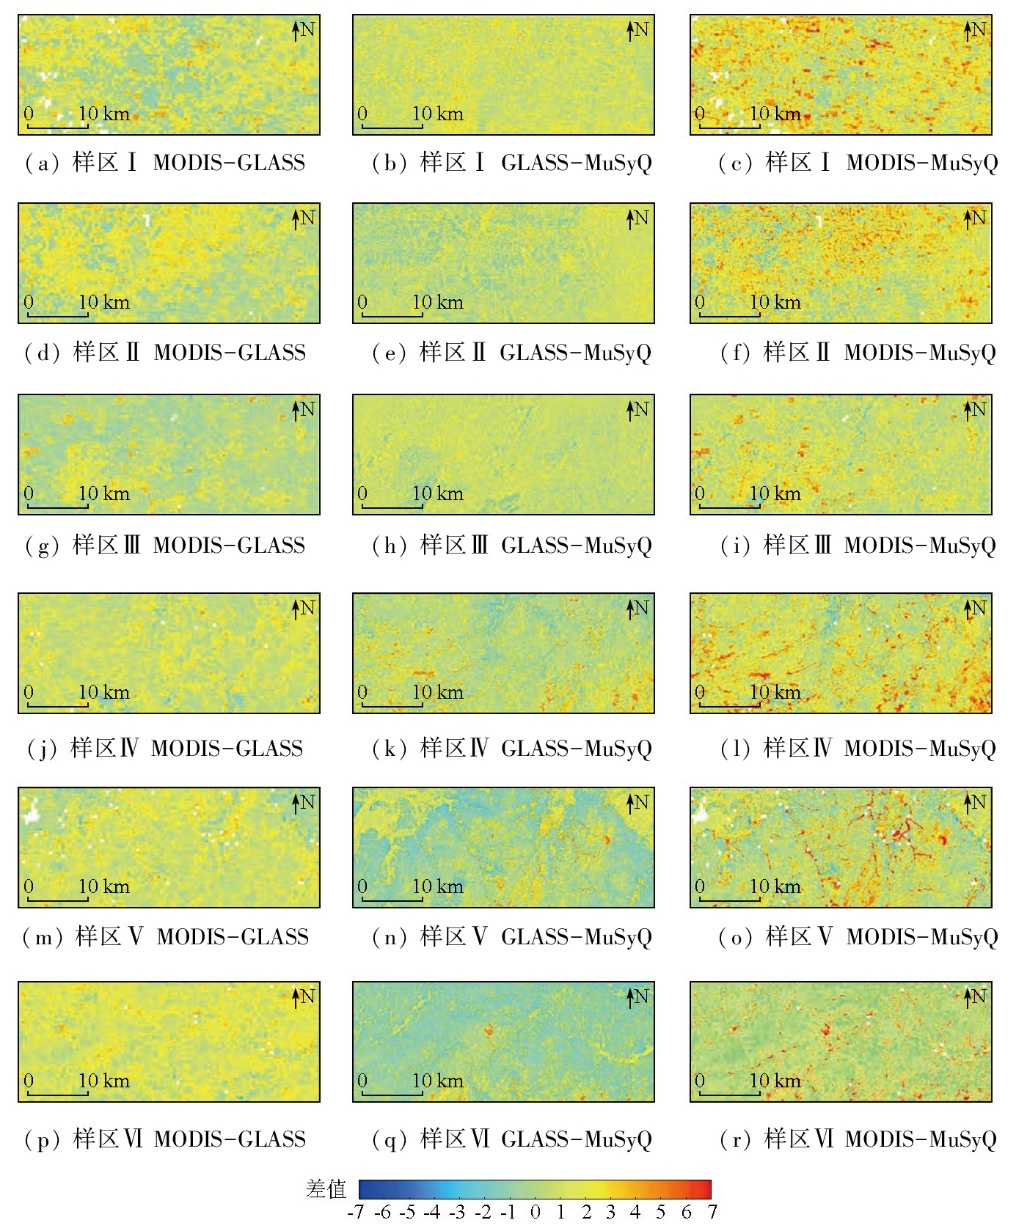
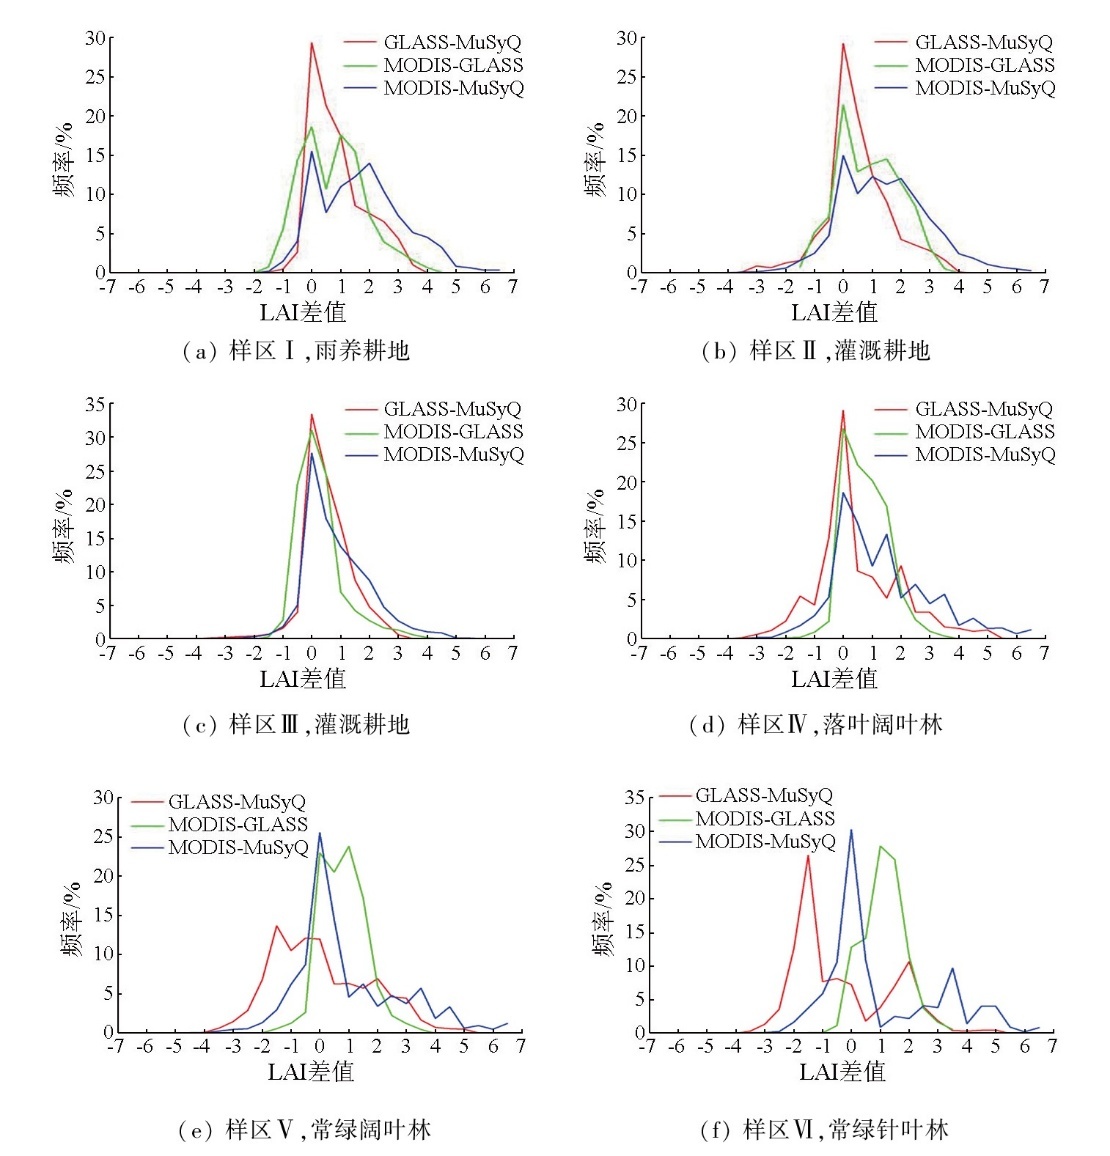
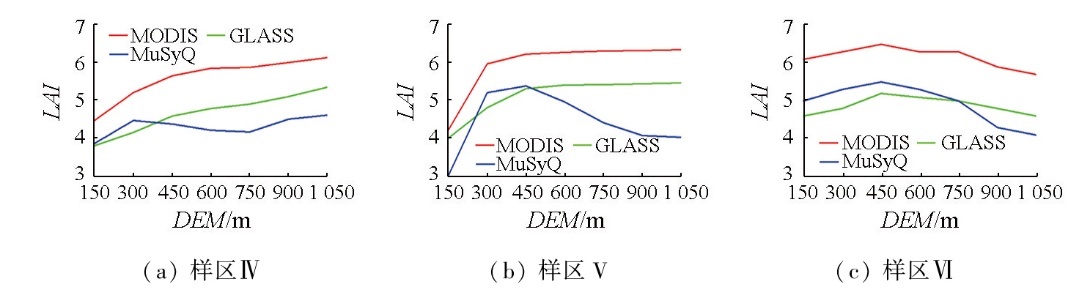
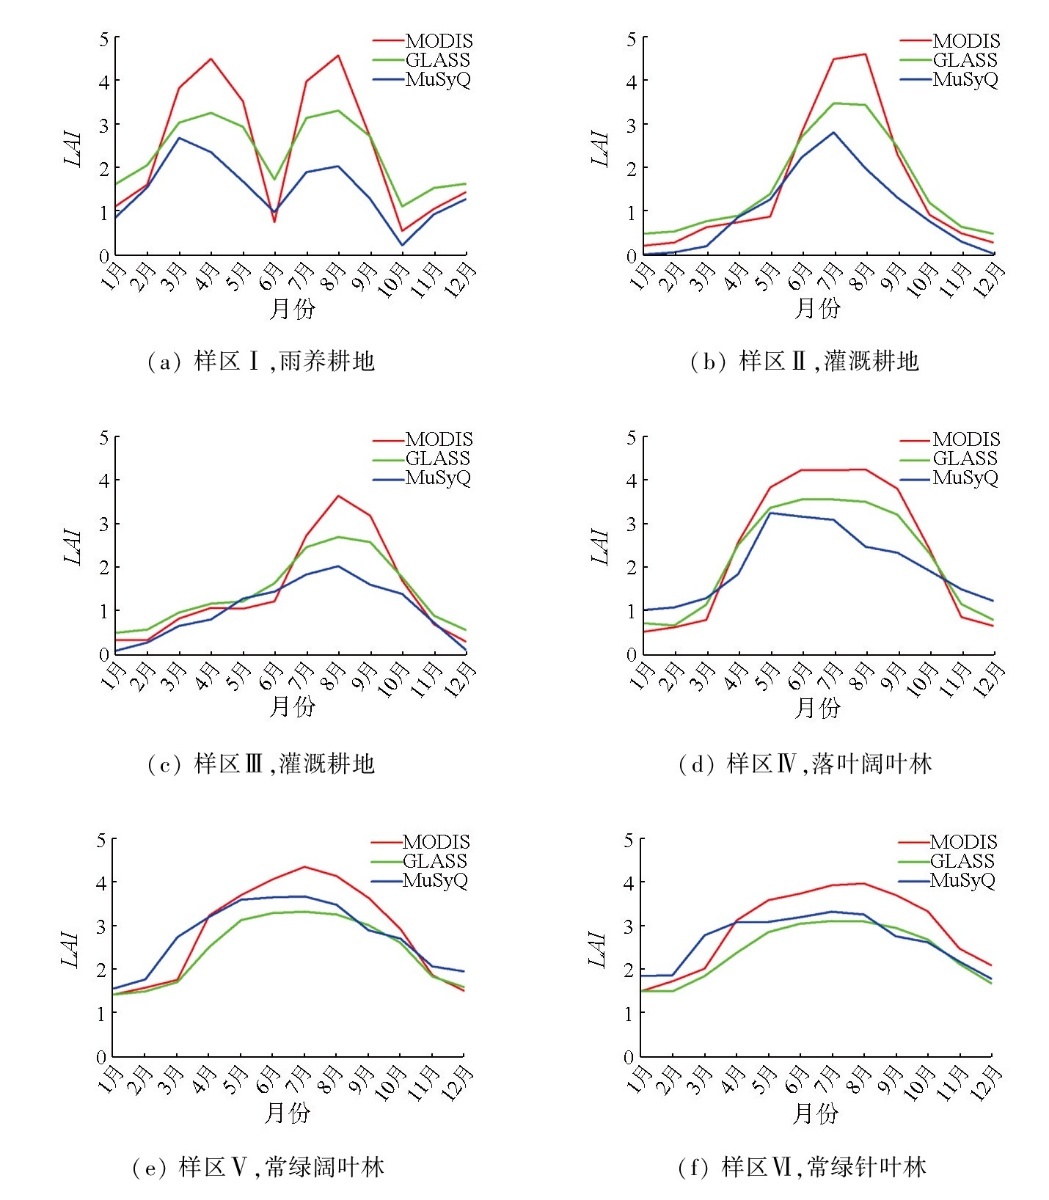
Abstract The leaf area index (LAI) serves as an important parameter for investigating the global carbon cycle,water cycle,energy exchange,and climate change. At present,there are multiple LAI products with different time series and resolutions. Comparative analysis of these products can not only reveal their suitability in various regions,but also provide suggestions for optimizing their algorithms. Focusing on the typical areas in Anhui province,this study compared and assessed the spatiotemporal consistency of MuSyQ LAI,MODIS LAI,and GLASS LAI products from the perspective of their capacity to characterize the spatiotemporal characteristics of vegetation. The results indicate that the spatial distribution of LAI obtained from the three products was consistent with the spatial distribution of vegetation,revealing good spatial consistency. However,there existed differences in LAI values and spatial heterogeneity. To be specific,the MODIS LAI displayed generally higher values than the other two products. The MuSyQ LAI exhibited lower values than the GLASS LAI in cultivated land and deciduous broad-leaved forests,but higher values in evergreen forests. As spatial resolution increases,the three products all showed better spatial details,with the MuSyQ LAI featuring the most pronounced spatial heterogeneity in land cover distribution. As the elevation varies,the MODIS LAI and GLASS LAI values vary in a consistent pattern,while the MuSyQ LAI value varies in a different pattern. The three products presented altitude-varying LAI values at low-altitude areas,whereas they showed varying change patterns at high-altitude areas across different sample areas. Temporally,the three products presented relatively complete time-series curves of the annual average LAI value over the years and similar seasonal trends,which can effectively characterize the phenological characteristics of crops and the seasonal variations of different plants. Overall,the three products exhibited good spatiotemporal consistency,all of which can reflect the spatial distribution and temporal changes of vegetation. However,they were different in the LAI value and spatial heterogeneity. Among them,the MuSyQ LAI is more suitable for investigating inter-annual changes in areas featuring complex terrains and high heterogeneity in land cover distribution,while the GLASS LAI is more suitable for long-time-series studies in large areas.
|
| Keywords
leaf area index (LAI)
vegetation type
spatiotemporal consistency
Anhui Province
|
|
|
|
Issue Date: 28 October 2025
|
|
|
| [1] |
Chen J M, Black T A. Defining leaf area index for non-flat leaves[J]. Plant,Cell and Environment, 1992, 15(4):421-429.
|
| [2] |
冯一鸣, 张娜, 乐荣武, 等. 中国北方温性草地最大叶面积指数的时空变化及其对气候变化的响应[J]. 中国科学院大学学报(中英文), 2024, 41(2):195-211.
|
| [2] |
Feng Y M, Zhang N, Yue R W, et al et al., Spatiotemporal variation in the maximum leaf area index of temperate grassland in Northern China and its response to climate change[J]. Journal of University of Chinese Academy of Sciences, 2024, 41(2):195-211.
|
| [3] |
Wang Y, Fang H L. Estimation of LAI with the LiDAR technology:A review[J]. Remote Sensing, 2020, 12(20):3457.
|
| [4] |
曾也鲁, 李静, 柳钦火. 全球LAI地面验证方法及验证数据综述[J]. 地球科学进展, 2012, 27(2):165-174.
|
| [4] |
Zeng Y L, Li J, Liu Q H. Global LAI ground validation dataset and product validation framework:A review[J]. Advances in Earth Science, 2012, 27(2):165-174.
|
| [5] |
Myneni R B, Hoffman S, Knyazikhin Y, et al. Global products of vegetation leaf area and fraction absorbed PAR from year one of MODIS data[J]. Remote Sensing of Environment, 2002, 83(1/2):214-231.
|
| [6] |
Ganguly S, Schull M A, Samanta A, et al. Generating vegetation leaf area index earth system data record from multiple sensors.Part 1:Theory[J]. Remote Sensing of Environment, 2008, 112(12):4333-4343.
|
| [7] |
Baret F, Hagolle O, Geiger B, et al. LAI,fAPAR and fCover CYCLOPES global products derived from VEGETATION Part 1:Principles of the algorithm[J]. Remote Sensing of Environment, 2007, 110(3):275-286.
|
| [8] |
Baret F, Weiss M, Lacaze R, et al. GEOV1:LAI and FAPAR essential climate variables and FCOVER global time series capitalizing over existing products.Part1:Principles of development and production[J]. Remote Sensing of Environment, 2013, 137:299-309.
|
| [9] |
Morisette J T, Baret F, Privette J L, et al. Validation of global moderate-resolution LAI products:A framework proposed within the CEOS land product validation subgroup[J]. IEEE Transactions on Geoscience and Remote Sensing, 2006, 44(7):1804-1817.
|
| [10] |
Hu J N, Tan B, Shabanov N, et al. Performance of the MISR LAI and FPAR algorithm:A case study in Africa[J]. Remote Sensing of Environment, 2003, 88(3):324-340.
|
| [11] |
Bacour C, Baret F, Béal D, et al. Neural network estimation of LAI,fAPAR,fCover and LAI×C ab,from top of canopy MERIS reflectance data:Principles and validation[J]. Remote Sensing of Environment, 2006, 105(4):313-325.
|
| [12] |
Yuan H, Dai Y J, Xiao Z Q, et al. Reprocessing the MODIS Leaf Area Index products for land surface and climate modelling[J]. Remote Sensing of Environment, 2011, 115(5):1171-1187.
|
| [13] |
Liu R, Chen J M, Liu J, et al. Application of a new leaf area index algorithm to China’s landmass using MODIS data for carbon cycle research[J]. Journal of Environmental Management, 2007, 85(3):649-658.
pmid: 17123698
|
| [14] |
Xiao Z Q, Liang S L, Wang J D, et al. Use of general regression neural networks for generating the GLASS leaf area index product from time-series MODIS surface reflectance[J]. IEEE Transactions on Geoscience and Remote Sensing, 2013, 52(1):209-223.
|
| [15] |
Ma H, Liang S L. Development of the GLASS 250-m leaf area index product (version 6) from MODIS data using the bidirectional LSTM deep learning model[J]. Remote Sensing of Environment, 2022, 273:112985.
|
| [16] |
张虎, 李静, 柳钦火, 等. 基于三维随机辐射传输模型的高分一号中国叶面积指数产品算法[J]. 遥感学报, 2023, 27(3):677-688.
|
| [16] |
Zhang H, Li J, Liu Q H, et al. GF-1 leaf area index product across China based on three-dimensional stochastic radiation transfer model[J]. National Remote Sensing Bulletin, 2023, 27(3):677-688.
|
| [17] |
方红亮. 我国叶面积指数卫星遥感产品生产及验证[J]. 遥感技术与应用, 2020, 35(5):990-1003.
doi: 10.11873/j.issn.1004-0323.2020.5.0990
|
| [17] |
Fang H L. Development and validation of satellite leaf area index (LAI) products in China[J]. Remote Sensing Technology and Application, 2020, 35(5):990-1003.
|
| [18] |
刘远, 周买春. MODIS, CYCLOPES和GLASS 3种LAI产品在韩江流域的对比[J]. 国土资源遥感, 2018, 30(1):14-21.doi:10.6046/gtzyyg.2018.01.03.
|
| [18] |
Liu Y, Zhou M C. Comparison of MODIS,CYCLOPES and GLASS LAI over Hanjiang River Basin[J]. Remote Sensing for Land and Resources, 2018, 30(1):14-21.doi:10.6046/gtzyyg.2018.01.03.
|
| [19] |
Li X L, Lu H, Yu L, et al. Comparison of the spatial characteristics of four remotely sensed leaf area index products over China:Direct validation and relative uncertainties[J]. Remote Sensing, 2018, 10(1):148.
|
| [20] |
喻樾, 张方敏, 陈镜明. 国产叶面积指数产品在中国区域的一致性检验[J]. 遥感技术与应用, 2023, 38(5):1239-1249.
doi: 10.11873/j.issn.1004-0323.2023.5.1239
|
| [20] |
Yu Y, Zhang F M, Chen J M. Comparative analysis of differences of leaf area index products in China[J]. Remote Sensing Technology and Application, 2023, 38(5):1239-1249.
|
| [21] |
Gessner U, Niklaus M, Kuenzer C, et al. Intercomparison of leaf area index products for a gradient of sub-humid to arid environments in west Africa[J]. Remote Sensing, 2013, 5(3):1235-1257.
|
| [22] |
杨帆, 李振旺, 包玉海, 等. 不同叶面积指数遥感产品在呼伦贝尔草甸草原的应用对比[J]. 农业工程学报, 2016, 32(S1):153-160.
|
| [22] |
Yang F, Li Z W, Bao Y H, et al. Comparison of remote sensing products with different leaf area indices in Hulunbeier meadow grassland[J]. Transactions of the Chinese Society of Agricultural Engineering, 2016, 32(S1):153-160.
|
| [23] |
杨勇帅, 李爱农, 靳华安, 等. 中国西南山区GEOV1、GLASS和MODIS LAI产品的对比分析[J]. 遥感技术与应用, 2016, 31(3):438-450.
doi: 10.11873/j.issn.1004-0323.2016.3.0438
|
| [23] |
Yang Y S, Li A N, Jin H A, et al. Intercomparison among GEOV1,GLASS and MODIS LAI products over mountainous area in southwestern China[J]. Remote Sensing Technology and Application, 2016, 31(3):438-450.
|
| [24] |
Li D D, Huang Y J, Xiao Y, et al. Evaluation of the high-resolution MuSyQ LAI product over heterogeneous land surfaces[J]. Remote Sensing, 2023, 15(5):1238.
|
| [25] |
Yang W Z, Tan B, Huang D, et al. MODIS leaf area index products:From validation to algorithm improvement[J]. IEEE Transactions on Geoscience and Remote Sensing, 2006, 44(7):1885-1898.
|
| [26] |
Myneni R B, Hoffman S, Knyazikhin Y, et al. Global products of vegetation leaf area and fraction absorbed PAR from year one of MODIS data[J]. Remote Sensing of Environment, 2002, 83(1/2):214-231.
|
| [27] |
Yan K, Park T, Yan G J, et al. Evaluation of MODIS LAI/FPAR product collection 6.part 1:Consistency and improvements[J]. Remote Sensing, 2016, 8(5):359.
|
| [28] |
张虎, 李静, 张召星, 等. MuSyQ高分16米分辨率10天合成的叶面积指数产品(2018-2020年中国01版)[J]. 中国科学数据, 2022, 7(1):217-226.
|
| [28] |
Zhang H, Li J, Zhang Z X, et al. A dataset of 16m/10-day leaf area indices of MuSyQ GF-series(2018-2020,China,Version 01)[J]. China Scientific Data, 2022, 7(1):217-226.
|
| [29] |
林世滔, 谢弟炳, 刘郁林, 等. 景观格局特征与区域生物多样性的关系研究[J]. 生态环境学报, 2017, 26(10):1681-1688.
doi: 10.16258/j.cnki.1674-5906.2017.10.006
|
| [29] |
Lin S T, Xie D B, Liu Y L, et al. Study on the relationship between landscape pattern and regional biodiversity[J]. Ecology and Environmental Sciences, 2017, 26(10):1681-1688.
|
| [30] |
连虎刚, 曲张明, 刘春芳, 等. 北方防沙带河西走廊段景观格局时空演变及其防风固沙服务响应[J]. 应用生态学报, 2023, 34(9):2518-2526.
doi: 10.13287/j.1001-9332.202309.035
|
| [30] |
Lian H G, Qu Z M, Liu C F, et al. Spatio-temporal variation of landscape pattern and the response of windbreak and sand fixation service in Hexi Corridor of northern sand fixation belt[J]. Chinese Journal of Applied Ecology, 2023, 34(9):2518-2526.
doi: 10.13287/j.1001-9332.202309.035
|
| [31] |
赵方圆, 杨宇翔, 张华堂, 等. 土地利用及景观格局动态变化分析——以甘肃省党河流域为例[J]. 水土保持研究, 2021, 28(3):235-241.
|
| [31] |
Zhao F Y, Yang Y X, Zhang H T, et al. Analysis on dynamic change of land use and landscape pattern—a case study of Danghe River Basin in Gansu Province[J]. Research of Soil and Water Conservation, 2021, 28(3):235-241.
|
|
Viewed |
|
|
|
Full text
|
|
|
|
|
Abstract
|
|
|
|
|
Cited |
|
|
|
|
| |
Shared |
|
|
|
|
| |
Discussed |
|
|
|
|
 2025,
Vol. 37
2025,
Vol. 37
 ), CHANG Jie1, ZHOU Jun1, WU Song1, SHEN Ao1, CHU Boce2(