Urban heat island effects of Nanjing based on urban expansion directions and types derived from remote sensing data
WANG Yuexiang1,2(), CHEN Wanting1, ZHU Yuxin1, CAI Anning1,3()
1. School of Urban and Environmental Sciences, Huaiyin Normal University, Huai’an 223300, China 2. School of Public Policy and Management(School of Emergency Management), China University of Mining and Technology, Xuzhou 221116, China 3. Tourism and Social Administration College, Nanjing Xiaozhuang University, Nanjing 211171, China
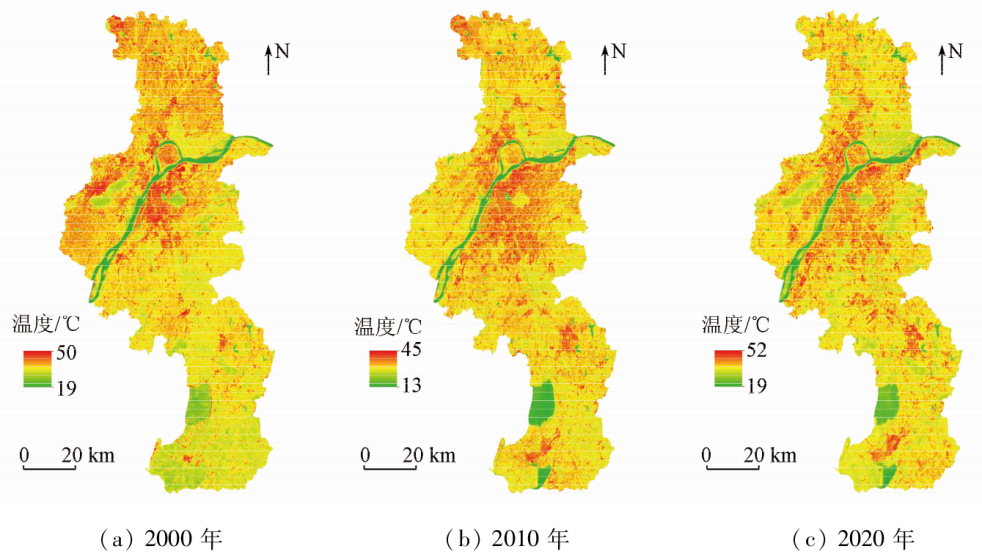
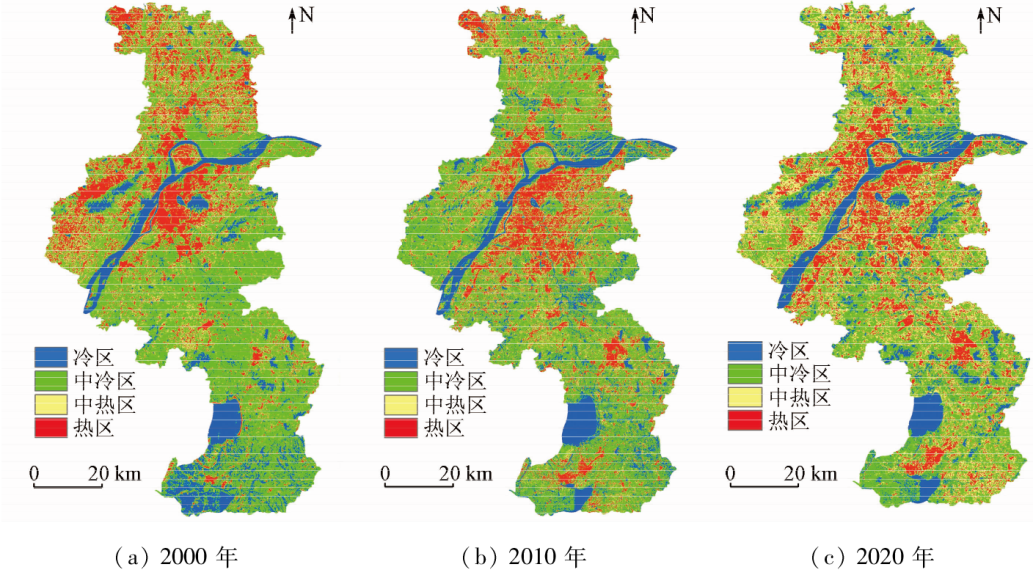
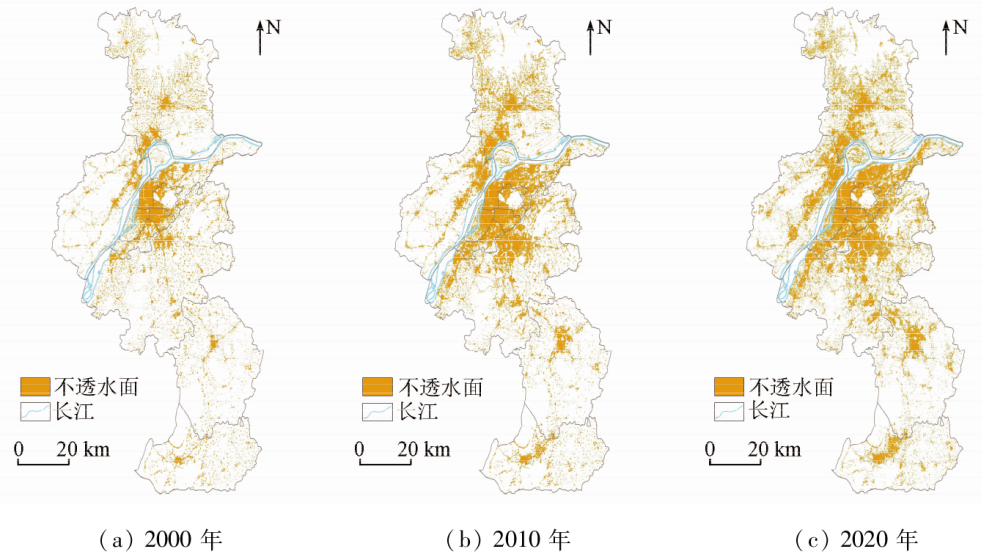
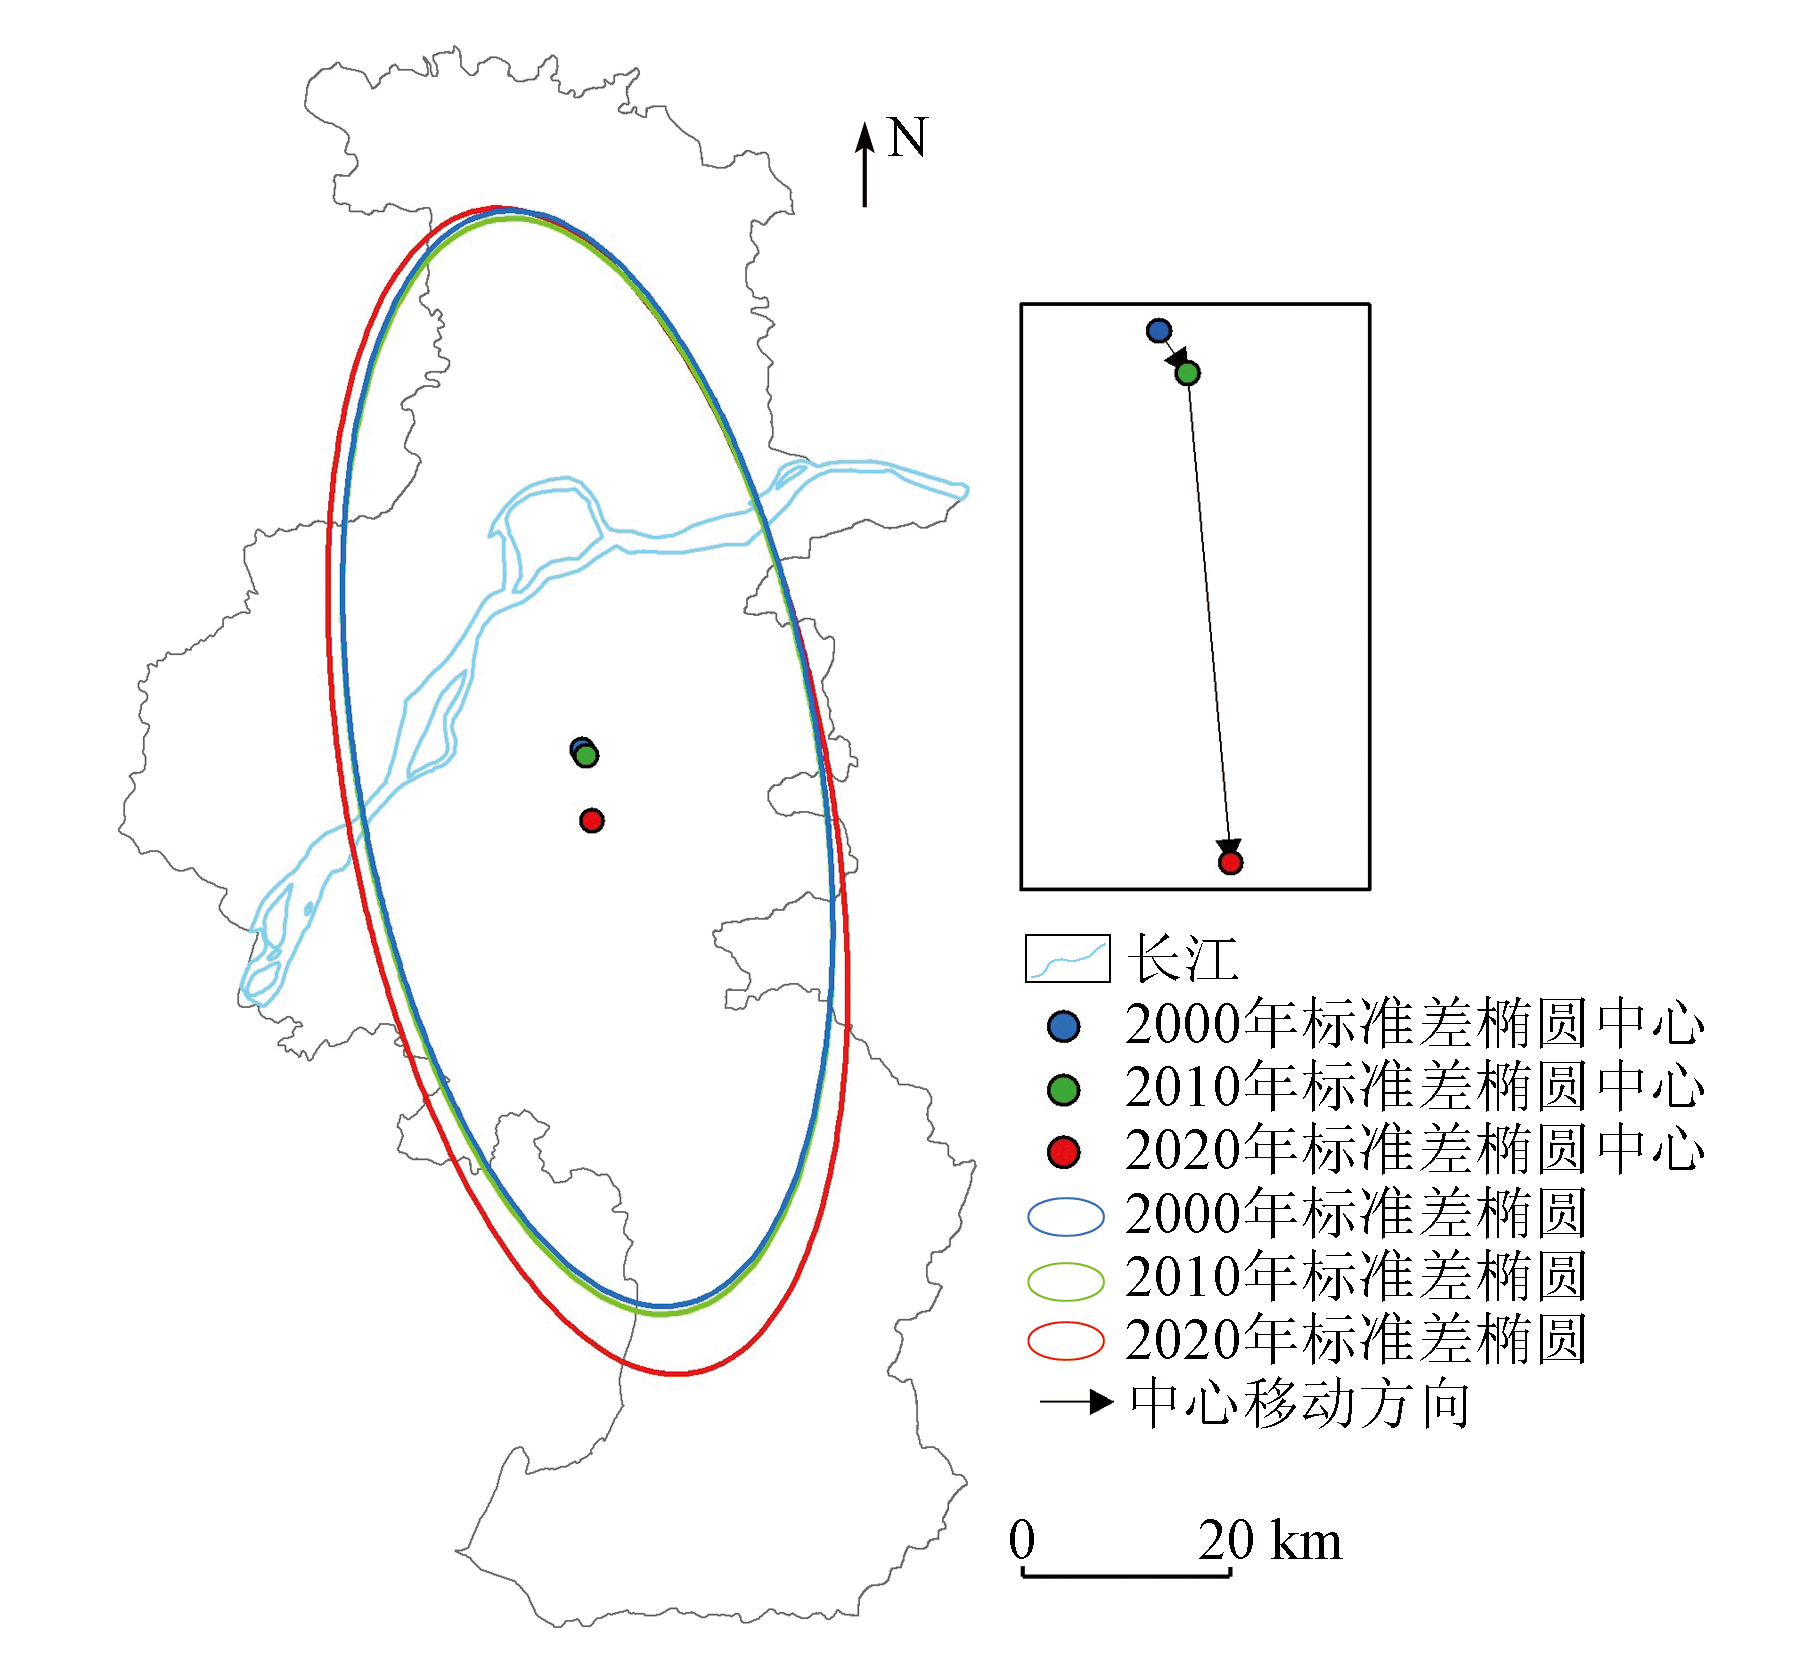
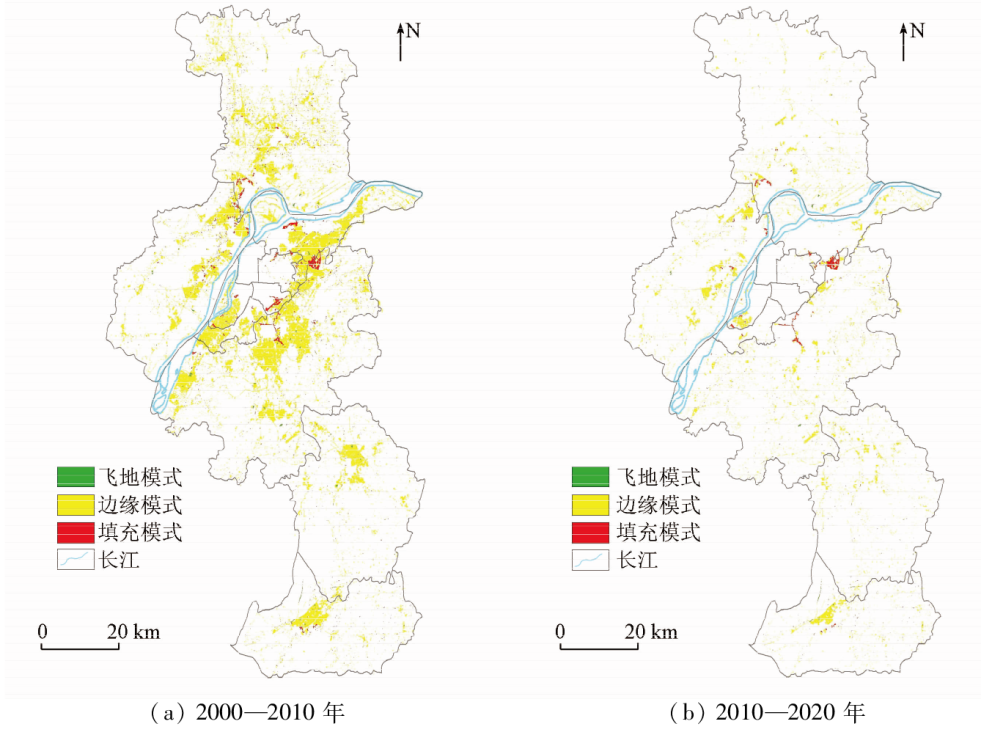
Delving into the urban heat island effects caused by urban expansion holds crucial significance for addressing urban thermal environment challenges. Based on the Landsat remote sensing images of Nanjing in 2000, 2010, and 2020, this study obtained Nanjing’s surface temperatures through inversion using the radiative transfer equation and extracted the impervious surface information using the biophysical composition index (BCI). It analyzed the urban expansion directions and types of Nanjing from 2000 to 2020 by employing the standard deviation ellipse and the landscape expansion index. Moreover, it investigated the effects of urban expansion types on the thermal environment through statistical analysis. The results are as follows: ① From 2000 to 2020, Nanjing experienced an increase in surface temperatures from 29 ℃ to 30 ℃ and an expansion of the heat island area from 2 248 km2 to 3 051 km2. The urban heat island expanded towards the south between 2000 and 2010 and spread to the surrounding areas between 2010 and 2020; ② The urban land of Nanjing expanded outwards from its center, mainly towards the south. The expansion types were dominated by edge expansion, succeeded by infilling and exclave expansions. The proportion of edge expansion between 2000 and 2010 was slightly higher than that between 2010 and 2020; ③ The urban expansion exhibited the same direction as the urban heat island expansion, and edge expansion resulted in the most intense urban heat island effects, followed by exclave and infilling expansions. This study can provide a scientific basis for ameliorating Nanjing’s thermal environment based on the urban expansion types and directions.
王月香, 陈婉婷, 朱瑜馨, 蔡安宁. 基于遥感的南京市城市扩张方向和类型的热效应[J]. 自然资源遥感, 2023, 35(4): 130-138.
WANG Yuexiang, CHEN Wanting, ZHU Yuxin, CAI Anning. Urban heat island effects of Nanjing based on urban expansion directions and types derived from remote sensing data. Remote Sensing for Natural Resources, 2023, 35(4): 130-138.
Zhang Y, Liu J, Wen Z. Predicting surface urban heat island in Meihekou City,China:A combination method of Monte Carlo and random forest[J]. Chinese Geographical Science, 2021, 31(4):659-670.
doi: 10.1007/s11769-021-1215-7
[2]
Estoque R C, Murayama Y, Myint S W. Effects of landscape composition and pattern on land surface temperature:An urban heat island study in the megacities of southeast Asia[J]. Science of the Total Environment, 2017, 577:349-359.
doi: 10.1016/j.scitotenv.2016.10.195
Liu X, Liu S D, Zhao X Y, et al. A preliminary research of urbanization process and heat island effect in Nanjing[J]. Resources and Environment in the Yangtze Basin, 2013, 22(12):1543-1549.
Zhu J F, Ma M M, Geng L Y. Spatiotemporal evolution analysis of urban heat island in Nanjing City based on remote sensing index[J]. Geomatics World, 2021, 28(5):52-57.
Pei H, Fang S F. Characteristics of heat island in Nanjing and relationship between heat island and land use/cover[J]. Arid Meteoro-logy, 2008, 26(1):23-27.
Zhou Z L, Sha J M, Ji J W. The study of the relationship between urban heat island effect and impervious surface and spatio-temporal change in urban areas of Fuzhou[J]. Journal of Fujian Normal University (Natural Science Edition), 2019, 35(1):19-27.
Xu H Q, Wang M Y. Remote sensing-based retrieval of ground impervious surfaces[J]. Journal of Remote Sensing, 2016, 20(5):1270-1289.
[8]
Deng C, Wu C. BCI:A biophysical composition index for remote sensing of urban environments[J]. Remote Sensing of Environment, 2012, 127:247-259.
doi: 10.1016/j.rse.2012.09.009
[9]
Xu H Q. Analysis of impervious surface and its impact on urban heat environment using the normalized difference impervious surface index (NDISI)[J]. Photogrammetric Engineering and Remote Sensing, 2010, 76(5):557-565.
doi: 10.14358/PERS.76.5.557
Zha Y, Ni S X, Yang S. An effective approach to automatically extract urban land-use from TM lmagery[J]. Journal of Remote Sensing, 2003, 7(1):37-40,82.
Hou Y C, Zhang D Y. Comparison study on land surface temperature retrieval algorithms based on Landsat8 remote sensing image[J]. Chinese Agricultural Science Bulletin, 2019, 35(10):142-147.
[12]
Xian G. Satellite remotely-sensed land surface parameters and their climatic effects for three metropolitan regions[J]. Advances in Space Research, 2008, 41(11):1861-1869.
doi: 10.1016/j.asr.2007.11.004
Qin Z H, Zhang M H, Karnieli A, et al. Mono-window algorithm for retrieving land surface temperature from Landsat TM6 data[J]. Acta Geographica Sinica, 2001, 56(4):456-466.
doi: 10.11821/xb200104009
[15]
Sobrino J A, Jiménez-Muñoz J C, Paolini L. Land surface temperature retrieval from LANDSAT TM5[J]. Remote Sensing of Environment, 2004, 90(4):434-440.
doi: 10.1016/j.rse.2004.02.003
[16]
Yue W, Qiu S, Xu H, et al. Polycentric urban development and urban thermal environment:A case of Hangzhou,China[J]. Landscape and Urban Planning, 2019, 189:58-70.
doi: 10.1016/j.landurbplan.2019.04.008
[17]
Peng J, Xie P, Liu Y, et al. Urban thermal environment dynamics and associated landscape pattern factors:A case study in the Beijing metropolitan region[J]. Remote Sensing of Environment, 2016, 173:145-155.
doi: 10.1016/j.rse.2015.11.027
Xu H Q. A study on information extraction of water body with the modified normalized difference water index (MNDWI)[J]. Journal of Remote Sensing, 2005, 9(5):589-595.
[19]
Gong J. Clarifying the standard deviational ellipse[J]. Geographical Analysis, 2002, 34(2):155-167.
doi: 10.1111/gean.2002.34.issue-2
[20]
Wong D W S. Several fundamentals in implementing spatial statistics in GIS:Using centrographic measures as examples[J]. Annals of GIS, 1999, 5(2):163-174.
doi: 10.1080/10824009909480525
Liu X P, Li X, Chen Y M, et al. Landscape expansion index and its applications to quantitative analysis of urban expansion[J]. Acta Geographica Sinica, 2009, 64(12):1430-1438.
Wang X K, Meng Q Y, Li J, et al. Spatiotemporal evolution and thermal environmental effects of impervious surfaces in the main urban area of Beijing[J]. Ecological Science, 2021, 40(1):169-181.
Ma Y L. Impact of spatio-temporal changes of impervious surfaces spatial structure on land surface thermal environment in urban agglomeration of Guangdong-Hong Kong-Macao Greater Bay Area[D]. Kunming: Yunnan Normal University, 2020.
Fan Z Y, Zhan Q M, Liu H M, et al. Spatial-temporal distribution of urban heat island and the heating effect of impervious surface in summer in Wuhan[J]. Journal of Geo-Information Science, 2019, 21(2):226-235.
Wang M Y, Xu H Q, Li X, et al. Analysis on spatiotemporal variation of urban impervious surface and its influence on urban thermal environment:Fuzhou City,China[J]. Journal of Basic Science and Engineering, 2018, 26(6):1316-1326.
 2023, Vol. 35
  ), 陈婉婷1, 朱瑜馨1, 蔡安宁1,3(