Analysis of high-frequency spatiotemporal evolution of patches reflecting 2020—2023 changes in coastal areas of the Chinese mainland
LI Wei1,2(), ZHAO Binru1, LIANG Jianfeng1(), ZHOU Peng2, ZHANG Feng1
1. National Marine Data and Information Service, Tianjin 300012, China 2. College of Oceanography and Space Informatics, China University of Petroleum, Qingdao 266580, China
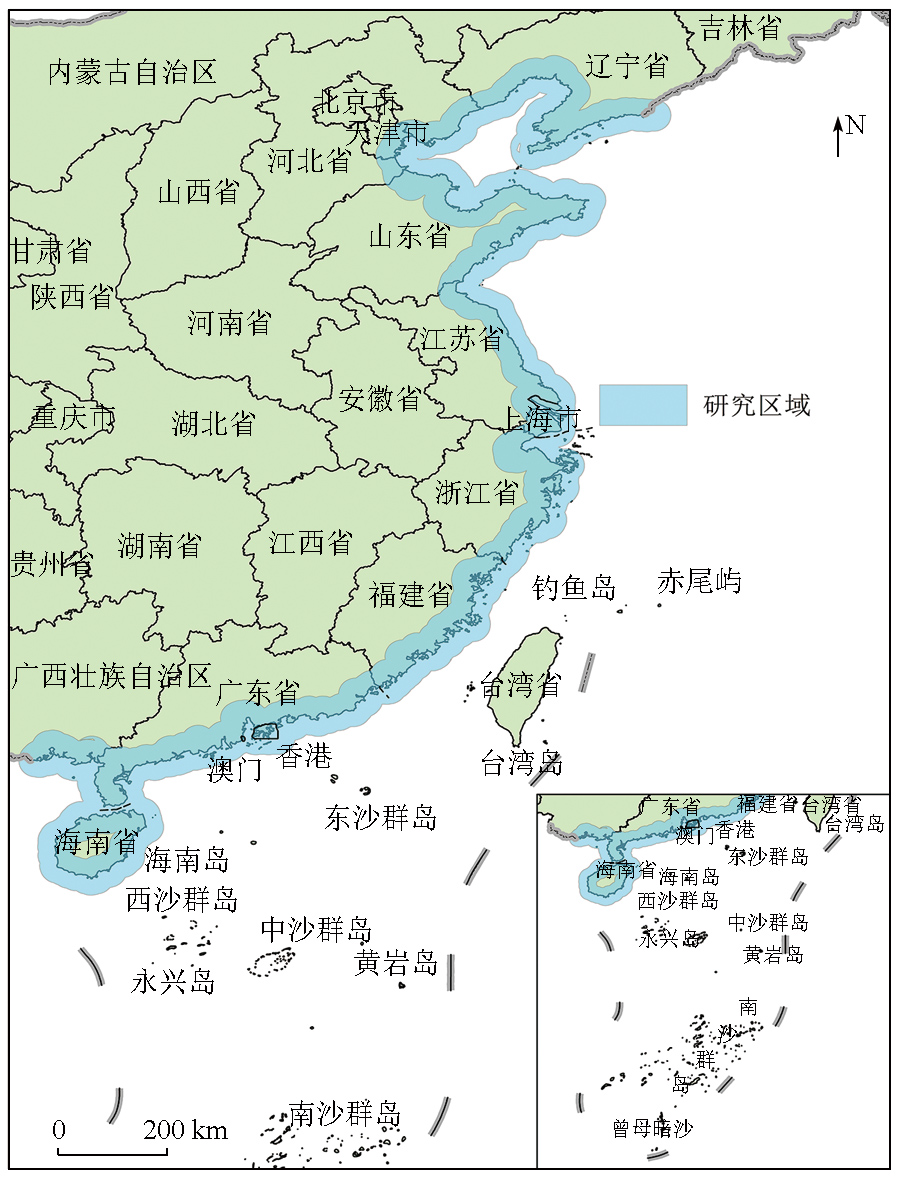
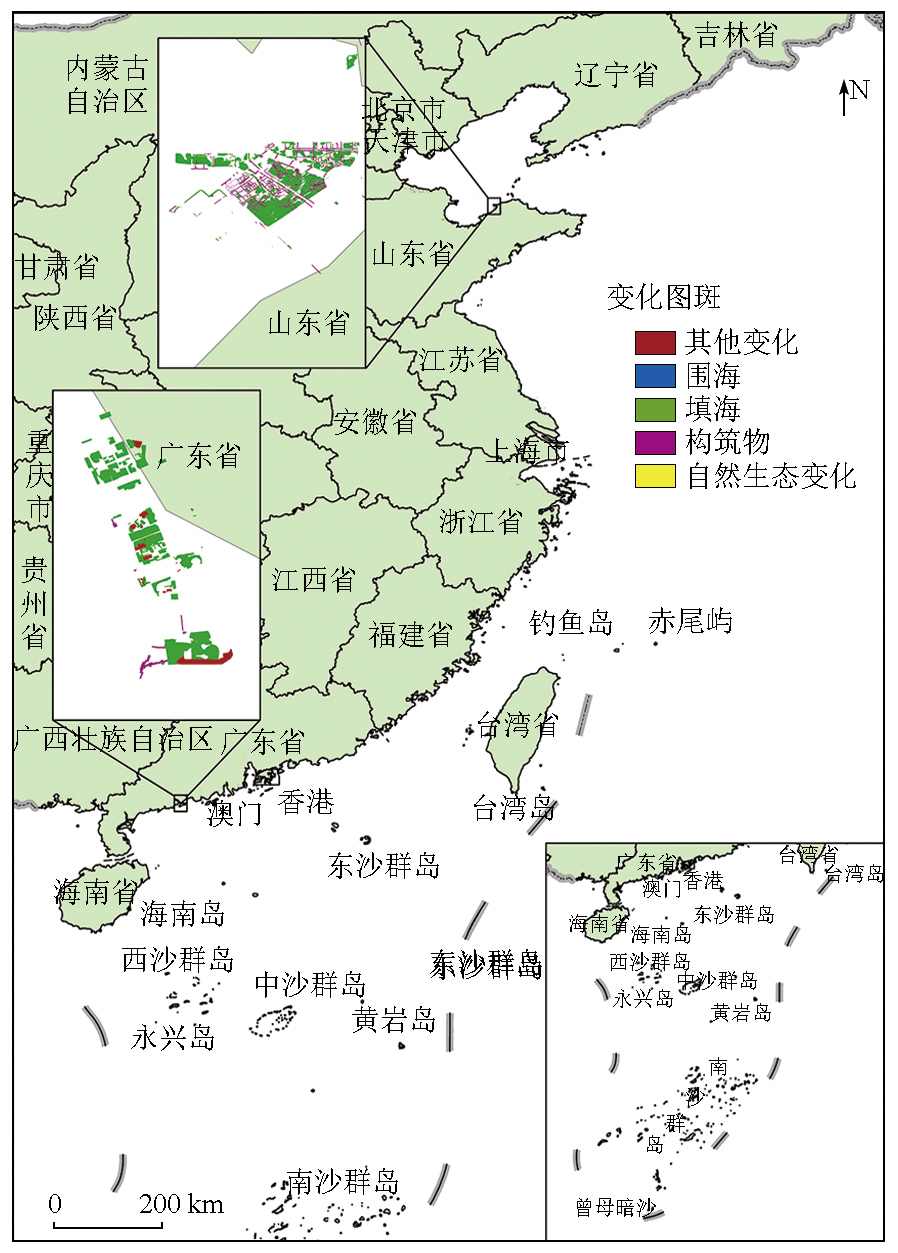
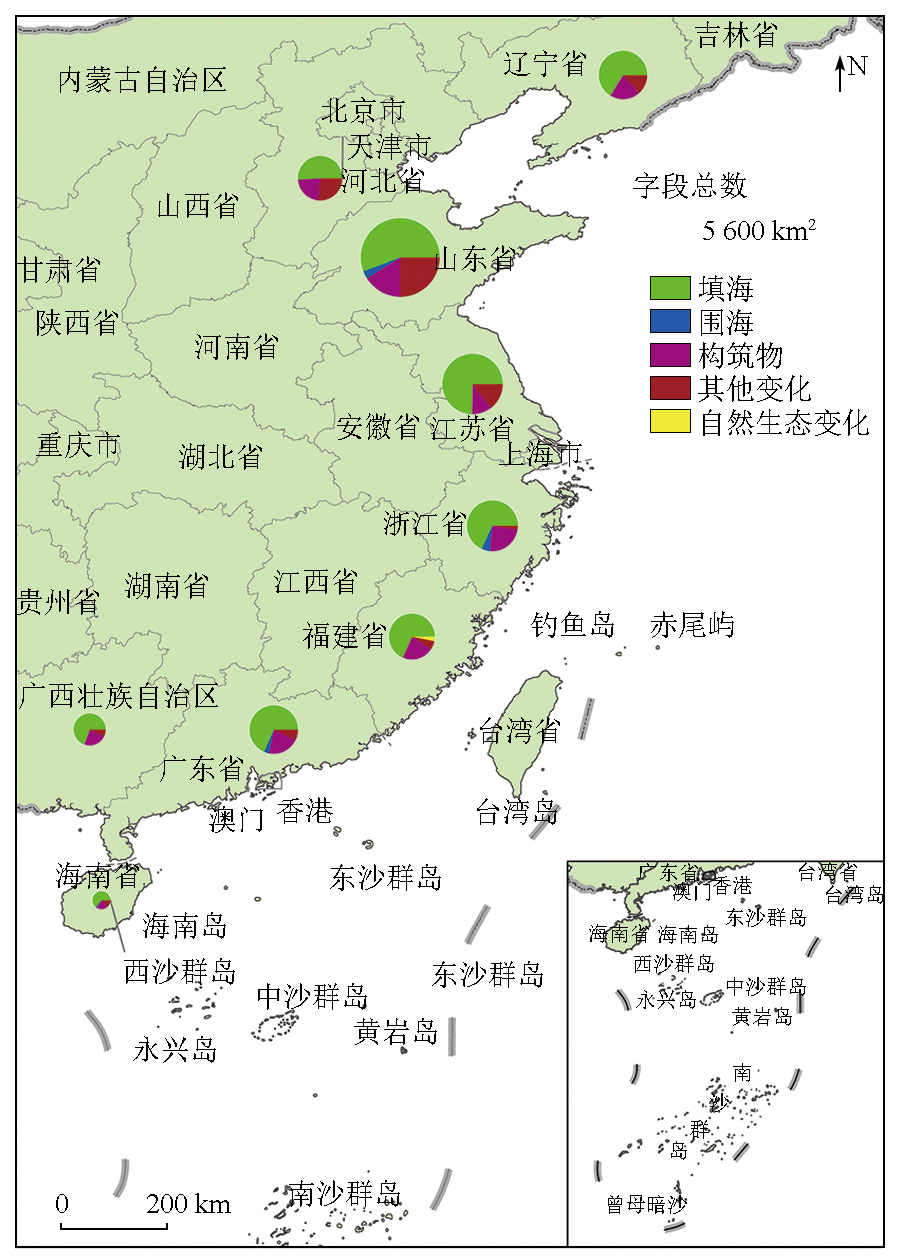
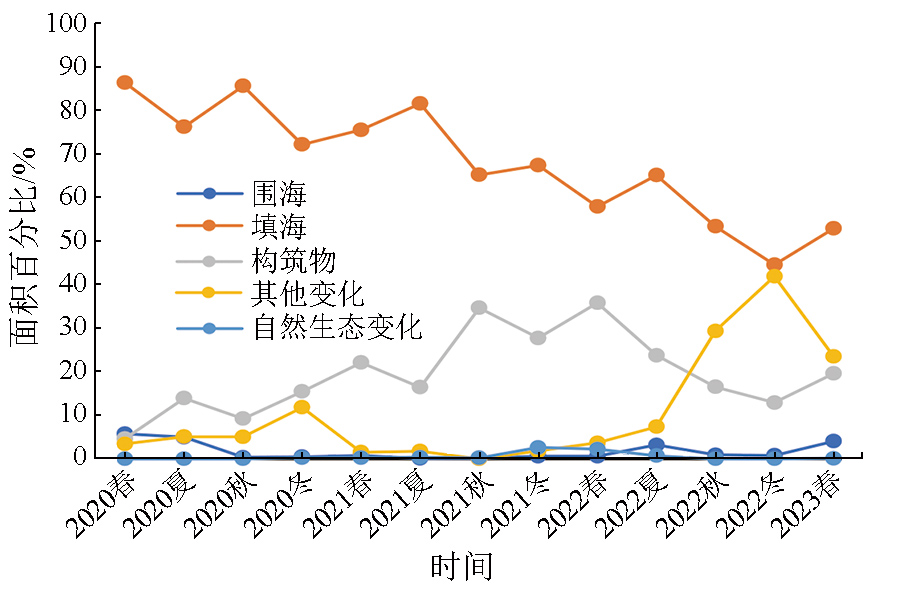
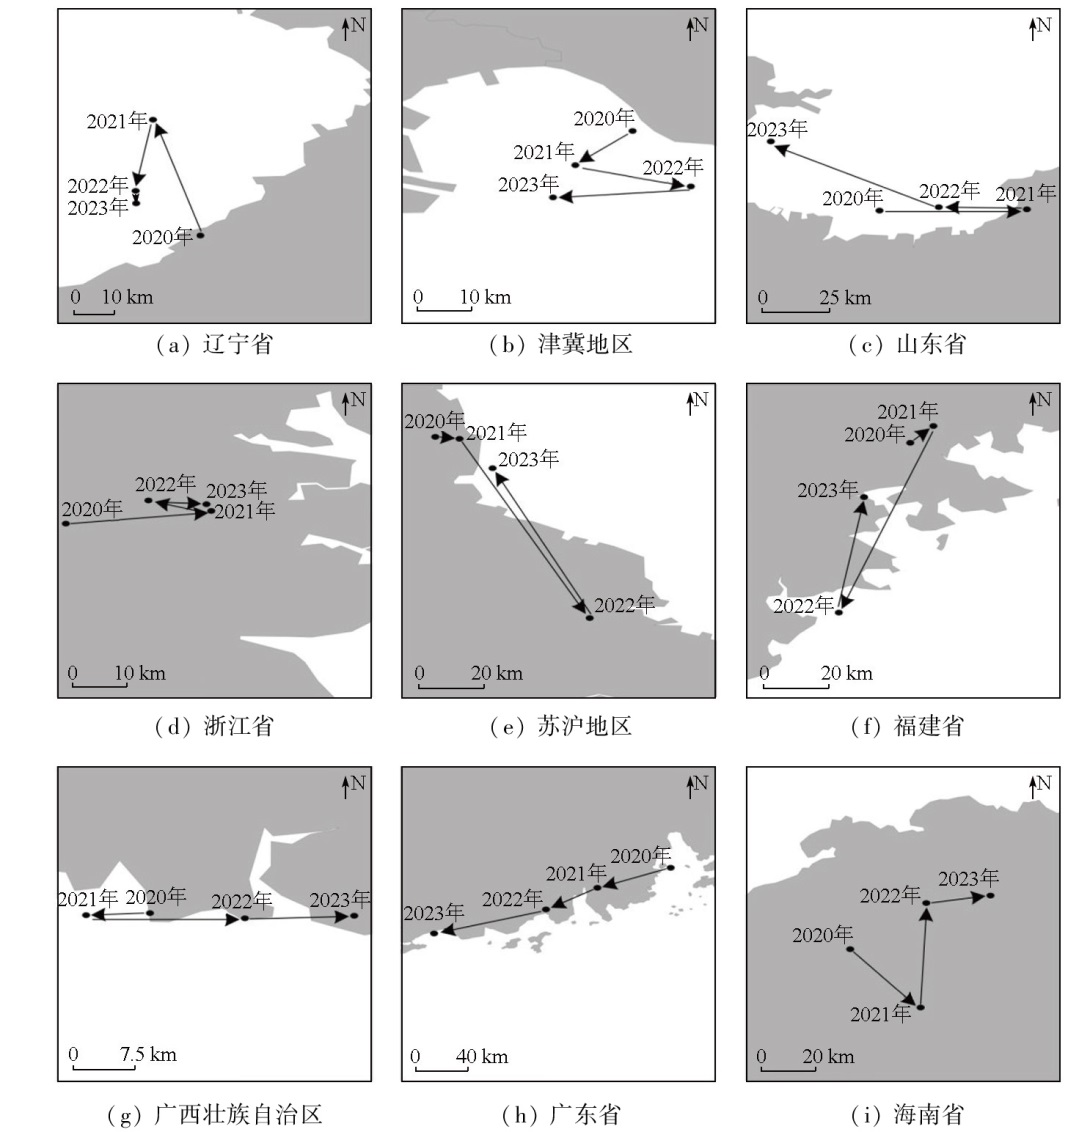
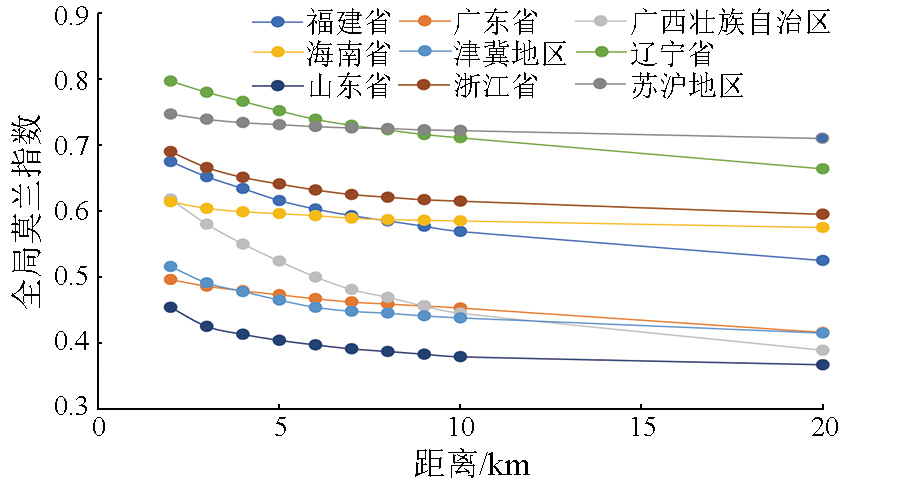
The analysis of patches showing changes in coastal areas of the Chinese mainland tends to encounter challenges such as low image resolution, long time intervals, and limited spatial coverage. This study aims to obtain high-frequency, accurate information on changes in coastal areas nationwide. This will facilitate the dynamic monitoring of marine resources and the implementation of relevant protection policies for coastal areas in China. To this end, using domestic high-resolution remote sensing data of 15 days (i.e., one cycle), as well as the iteratively reweighted multivariate alteration detection (IR-MAD) algorithm combined with visual interpretation, this study extracted patches reflecting 2020—2023 changes along the coasts of 11 provinces and cities in the Chinese mainland. Accordingly, this study analyzed their spatiotemporal characteristics, landscape patterns, and spatial correlation. The results indicate distinct directional changes in the patches. The patches reflecting changes from sea enclosure to reclamation exhibited the largest areas across various investigated areas. Except for Hainan Province, the area of this type of patches exceeded 1 000 km2. The proportions of patches reflecting different types of changes gradually tended to be balanced. In the winter of 2022, the proportion of patches showing changes in the reclamation dropped below 50% for the first time. The aggregation degree of patches reflecting various types of changes showed increasing trends, suggesting that patches reflecting various changes will become more concentrated in the future. The centroids of these patches of various regions shifted in varying directions, and these patches exhibited significant spatial correlation within a 20 km range.
李威, 赵彬如, 梁建峰, 周鹏, 张峰. 2020—2023年全国大陆地区沿海区域变化图斑高频次时空演变分析[J]. 自然资源遥感, 2025, 37(4): 77-87.
LI Wei, ZHAO Binru, LIANG Jianfeng, ZHOU Peng, ZHANG Feng. Analysis of high-frequency spatiotemporal evolution of patches reflecting 2020—2023 changes in coastal areas of the Chinese mainland. Remote Sensing for Natural Resources, 2025, 37(4): 77-87.
Li X M, Yuan C Z, Li Y Y. Remote sensing monitoring and spatial-temporal variation of Bohai Bay coastal zone[J]. Remote Sensing for Land and Resources, 2013, 25(2):156-163.doi:10.6046/gtzyyg.2013.02.26.
Wei F, Han G X, Zhang J P, et al. Evolution of coastal wetlands under the influence of sea reclamation in Bohai Rim during 1985-2015.[J]. Ecological Processes, 2018, 37(5):1527-153.
He S L, He Z H, Pan J Y, et al. County-scale land use/land cover simulation based on multiple models[J]. Remote Sensing for Natural Resources, 2023, 35(4):201-213.doi:10.6046/zrzyyg.2022274.
Kou C Y, Man W D, Zhang Y B, et al. Landscape pattern evolution of coastal wetlands in Tangshan City under the background of reclamation[J]. Wetland Science, 2023, 21(4):533-540.
Wu Y J, Kong X S. Simulation and development mode suggestions of the spatial pattern of “ecology-agriculture-construction” land in Jiangsu Province[J]. Remote Sensing for Natural Resources, 2022, 34(1):238-248.doi:10.6046/zrzyyg.2021102.
Cui B S, Xie T, Wang Q, et al. Impact of large-scale reclamation on coastal wetlands and implications for ecological restoration,compensation,and sustainable exploitation framework[J]. Bulletin of Chinese Academy of Sciences, 2017, 32(4):418-425.
Su T, Niu C, Zhan C, et al. Study on the process of the coastal reclamation and its impact on coastal ecological and marine biological resources in Guangxi Zhuang Autonomous Region[J]. Journal of Guangxi Academy of Sciences, 2018, 34(3):228-234.
Cheng K L, Wu K K, Huang H P, et al. Marine ecological restoration policies in China:Status,problems and suggestions[J]. Journal of Applied Oceanography, 2021, 40(1):170-178.
Xu H, Zhang Y X, Hou X Y, et al. Morphological changes of major gulfs along the coast of China from 2010 to 2020[J]. Journal of Natural Resources, 2022, 37(4):1010-1024.
Wang J, Wu Z F, Li S Y, et al. Coastline and land use change detection and analysis with remote sensing in the Pearl River Estuary Gulf[J]. Scientia Geographica Sinica, 2016, 36(12):1903-1911.
doi: 10.13249/j.cnki.sgs.2016.12.016
Wang J, Zhao J X, Shan C Z, et al. Research on coastal zone change detection method based on ensemble learning[J]. Ocean Development and Management, 2021, 38(7):48-54.
[12]
Nielsen A A, Hecheltjen A, Thonfeld F, et al. Automatic change detection in RapidEye data using the combined MAD and kernel MAF methods[C]// IEEE International Geoscience and Remote Sensing Symposium,IGARSS 2010.
[13]
Moghimi A, Ebadi H, Sadeghi V. Changes monitoring in multitemporal satellite images using iteratively reweighted multivariate alte-ration detection (IR-MAD) algorithm and support vector machine (SVM) classification[J]. Engineering Journal of Geospatial Information Technology, 2018, 6(2):64-77.
[14]
Wu C, Du B, Zhang L. Slow feature analysis for change detection in multispectral Imagery[J]. IEEE Transactions on Geoscience and Remote Sensing, 2014, 52(5):2858-2874.
Fu J, Song L, Lei L Y, et al. Remote sensing monitoring of Panjin coastal zone based on optimal scale and random forest algorithm[J]. Remote Sensing Information, 2022, 37(2):7-15.
[16]
Chen H, Shi Z. A Spatial-temporal attention-based method and a new dataset for remote sensing image change detection[J]. Remote Sensing, 2020, 12(10):1662.
Hou Y Z, Ji L, Xing Q G, et al. Satellite remote sensing-assisted comparative monitoring of dynamic characteristics of macroalgae aquaculture in Weihai City,Shandong Province,China[J]. Remote Sensing for Natural Resources, 2023, 35(2):34-41.doi:10.6046/zrzyyg.2022296.
Yi F J, Li R D, Chang B R, et al. Spatial-temporal features of construction land expansion in Changzhutan (Changsha-Zhuzhou-Xiangtan) area based on remote sensing[J]. Remote Sensing for Land and Resources, 2015, 27(2):160-166.doi:10.6046/gtzyyg.2015.02.25.
Kuang W H, Zhang S W, Du G M, et al. Remotely sensed mapping and analysis of spatio-temporal patterns of land use change across China in 2015—2020[J]. Acta Geographica Sinica, 2022, 77(5):1056-1071.
Ying C, Gao Y, Tian P, Spatial-temporal variation characteristics of territorial space development and utilization in Wenzhou coastal zone from the perspective of land-sea integration[J]. Marine Science Bulletin, 2023, 42(2):202-215.
Wen B, Wu H P, Jiang F F, et al. Approach for assimilating land use spatial data at various times[J]. Science of Surveying and Mapping. 2015, 40(6):42-45,76.
Yu F S, Sui Y, Wang C Y, et al. Reclamation detection and recognition of high resolution satellite remote sensing image based on deep learning[J], Remote Sensing Technology and Application, 2022, 37(4):789-799.
 2025, Vol. 37
  ), 赵彬如1, 梁建峰1(