Please wait a minute...
 
自然资源遥感  2024, Vol. 36 Issue (4): 229-241    DOI: 10.6046/zrzyyg.2023138
  技术应用 本期目录 | 过刊浏览 | 高级检索 |
2000—2020年黄河流域不同植被类型时空变化特征及其影响因素
魏潇1,2,3(), 张立峰1,2,3(), 何毅1,2,3, 曹胜鹏1,2,3, 孙强1,2,3, 高秉海1,2,3
1.兰州交通大学测绘与地理信息学院,兰州 730070
2.地理国情监测技术应用国家地方联合工程研究中心,兰州 730070
3.甘肃省地理国情监测工程实验室,兰州 730070
2000-2020 spatiotemporal variations of different vegetation types in the Yellow River basin and influencing factors
WEI Xiao1,2,3(), ZHANG Lifeng1,2,3(), HE Yi1,2,3, CAO Shengpeng1,2,3, SUN Qiang1,2,3, GAO Binghai1,2,3
1. School of Surveying and Mapping and Geographic Information, Lanzhou Jiaotong University, Lanzhou 730070, China
2. National and Local Joint Engineering Research Center for Geographic Monitoring Technology Application, Lanzhou 730070, China
3. Engineering Laboratory of Geographic Monitoring of Gansu Province, Lanzhou 730070, China
全文: PDF(13766 KB)   HTML  
输出: BibTeX | EndNote (RIS)      
摘要 

掌握黄河流域植被生长的时空变化特征及其影响因素,对生态环境的保护和发展有重要意义。然而,现有的研究缺少对黄河流域内最新时段不同植被类型时空特征分析及其与影响因子间关系的研究。为此,基于2000—2020年获取的MODIS NDVI时间序列遥感数据,利用趋势分析、相关分析、偏相关分析和残差分析法,挖掘黄河流域不同植被类型时空特征,厘清在年尺度和月尺度上受气温和降水的影响机制,同时探究人类活动对不同植被类型时空特征的影响。结果表明: ①2000—2020年黄河流域不同植被NDVI总体均呈上升趋势,其中以耕地和林地的增长尤为突出; 然而不同植被类型NDVI增长趋势随着海拔的升高呈现出不同的下降特征。②21 a来各植被类型在大部分区域呈现改善,但少部分区域呈现出退化,主要集中在草地和耕地区域。各植被类型未来变化趋势呈反持续性的区域占比较大。③气温和降水对黄河流域各植被的生长表现出促进作用,但各植被对降水的响应高于气温,并且其响应存在明显的时滞性,其中草地和灌木的生长对降水和气温的响应更为敏感。④人类活动对黄河流域的整体植被起到积极作用,但在草地和耕地类型中存在部分消极影响,应在未来规划中引起重视。2000—2020年黄河流域大部分植被呈改善状态,但部分草地和耕地呈退化趋势,应对典型退化区域进行保护。研究结果可为黄河流域内生态环境建设和经济发展提供科学数据和理论支撑。

服务
把本文推荐给朋友
加入引用管理器
E-mail Alert
RSS
作者相关文章
魏潇
张立峰
何毅
曹胜鹏
孙强
高秉海
关键词 植被类型Hurst指数残差分析遥感黄河流域    
Abstract

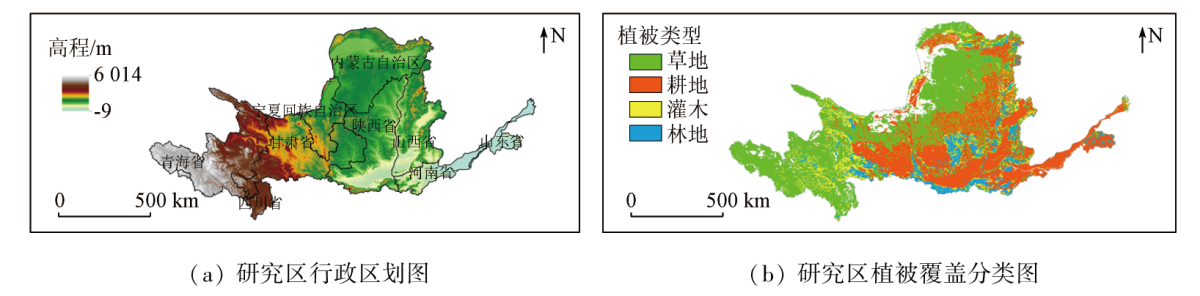
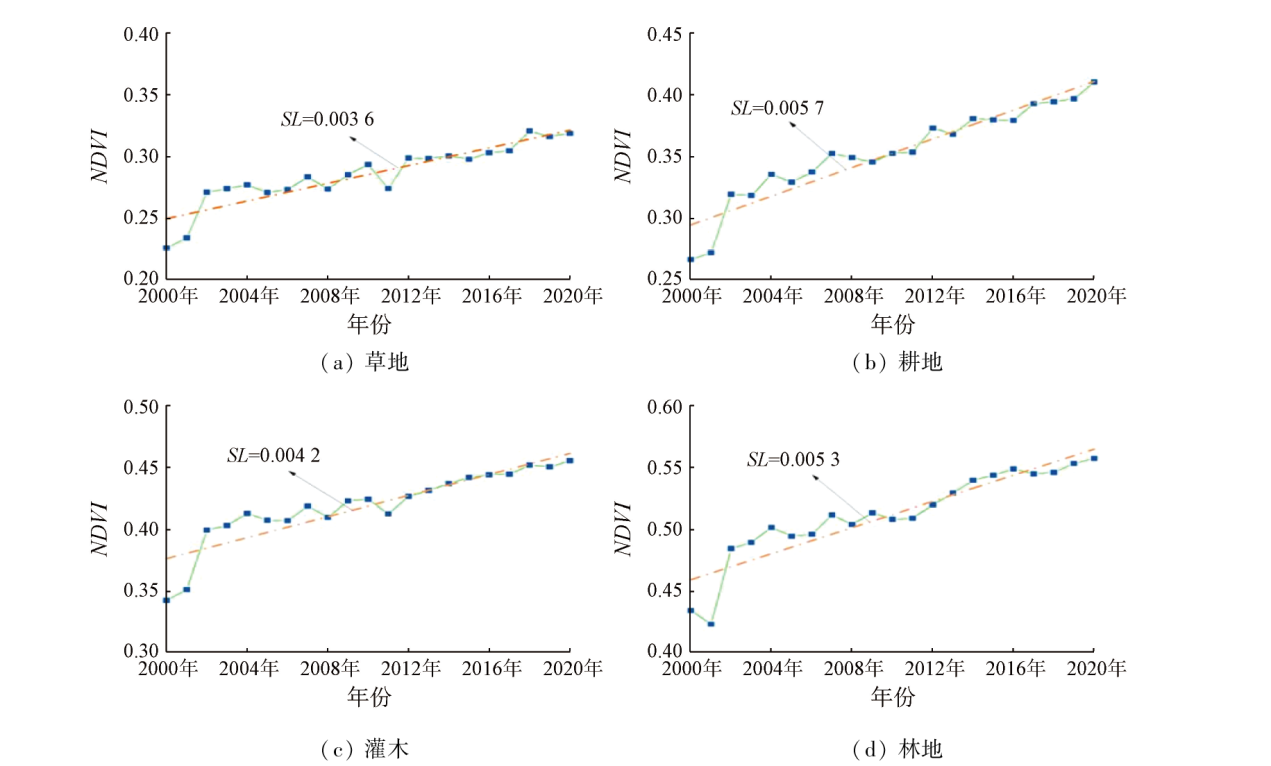
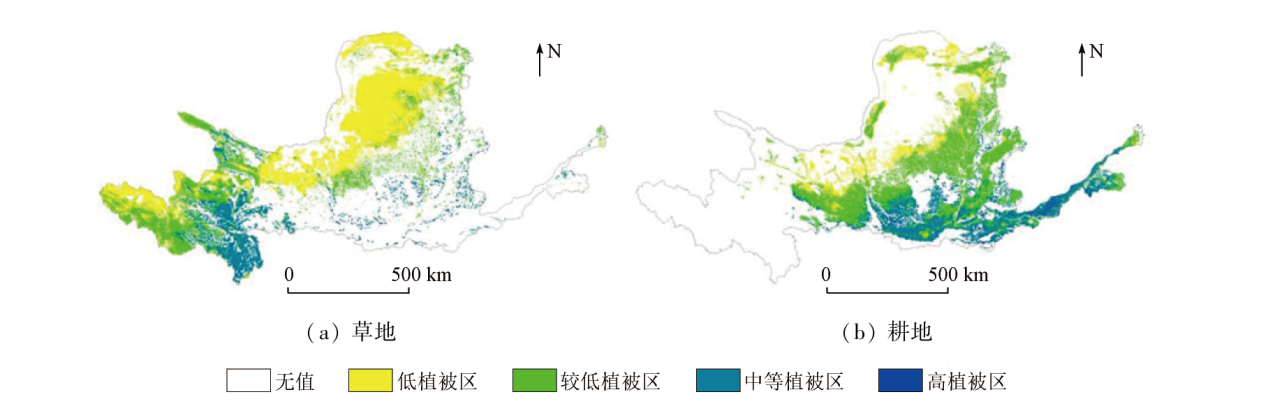
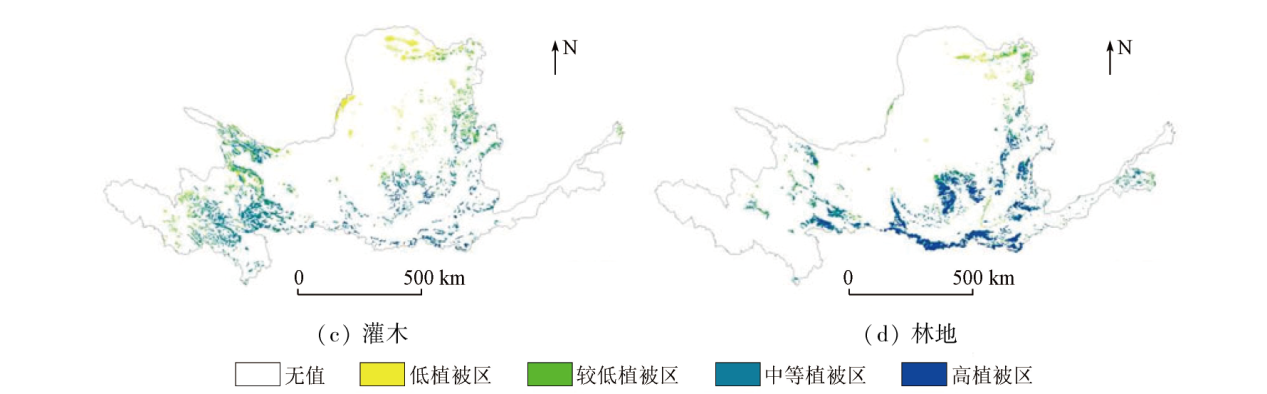
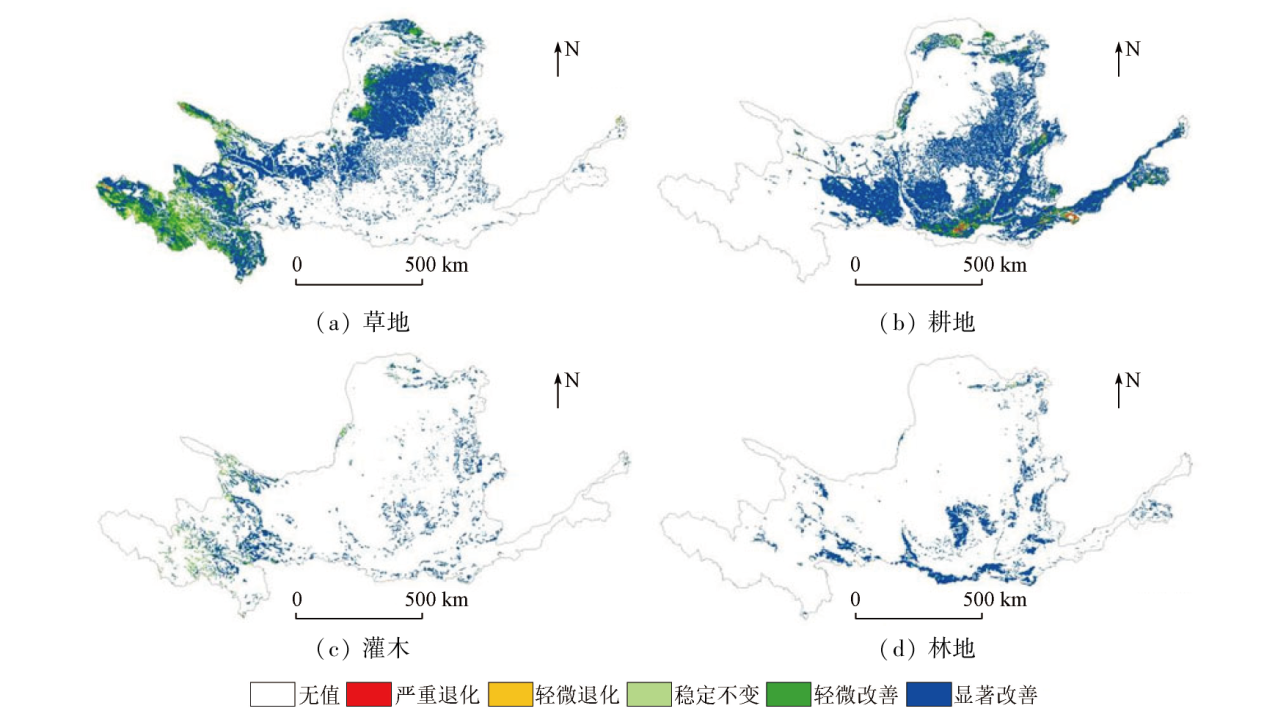
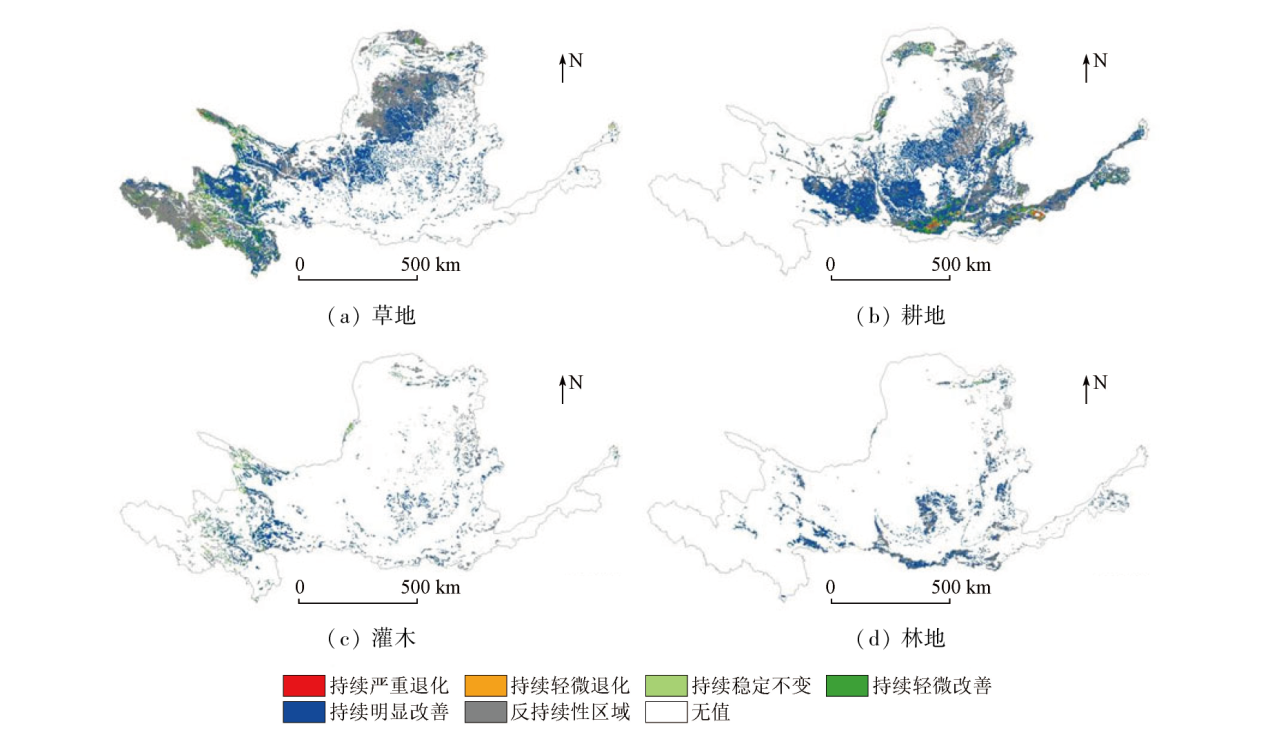
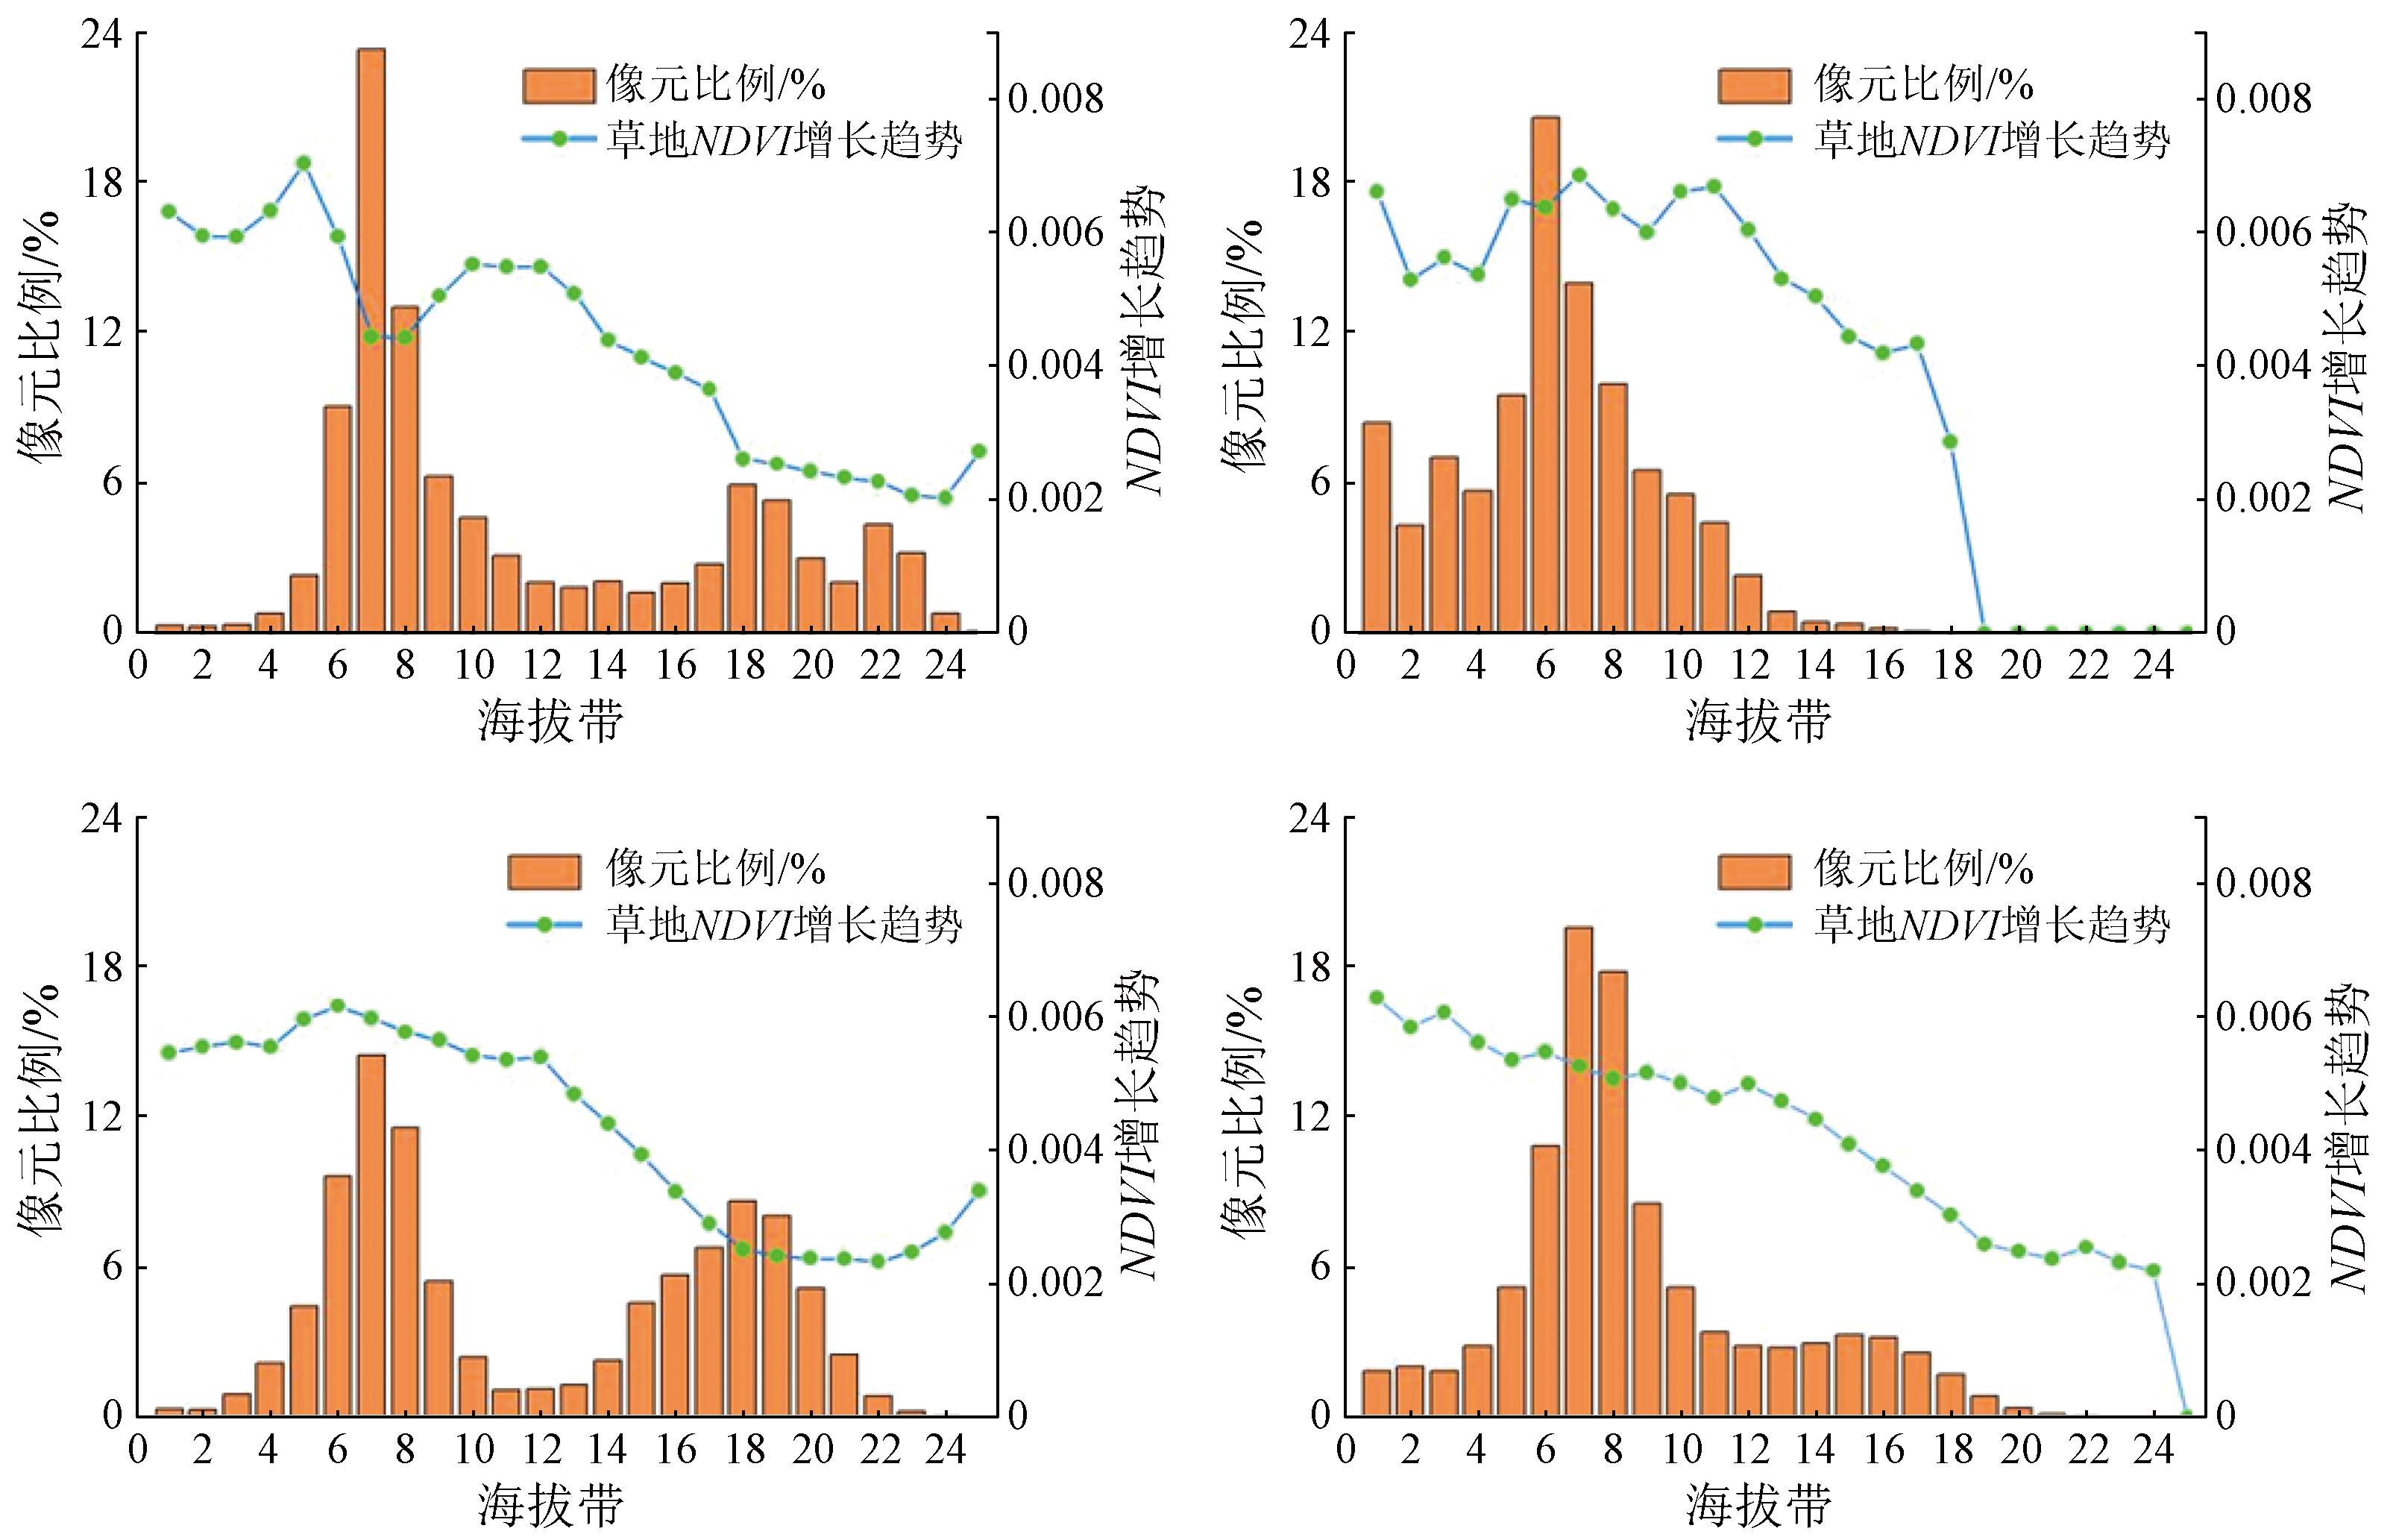
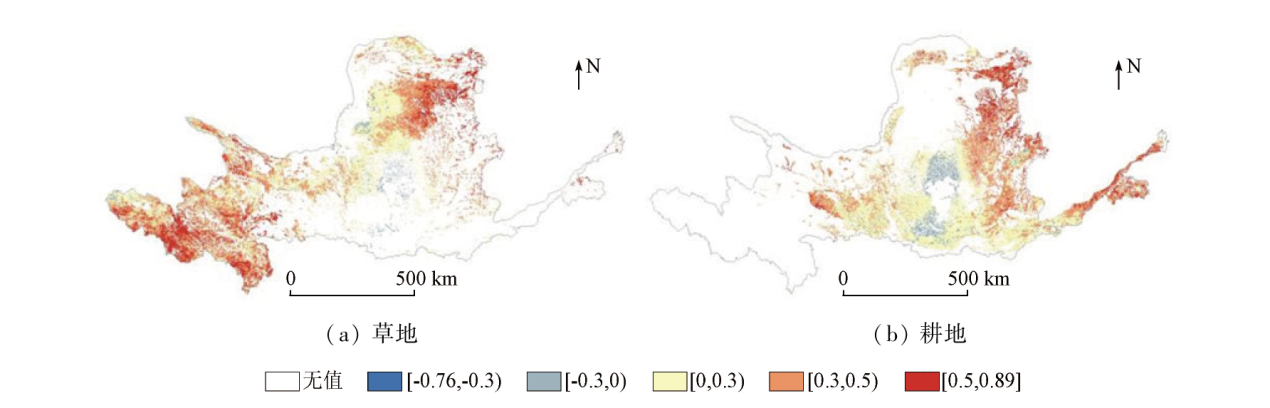
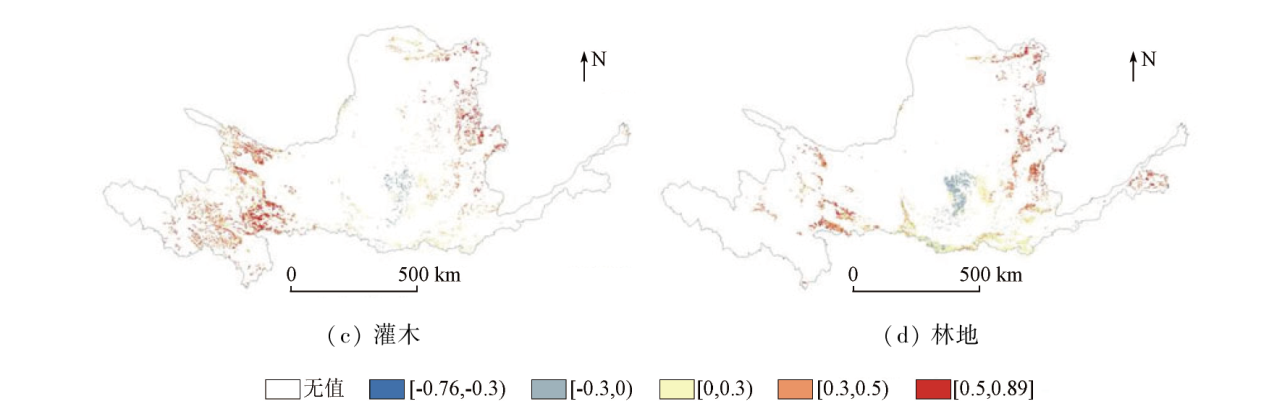
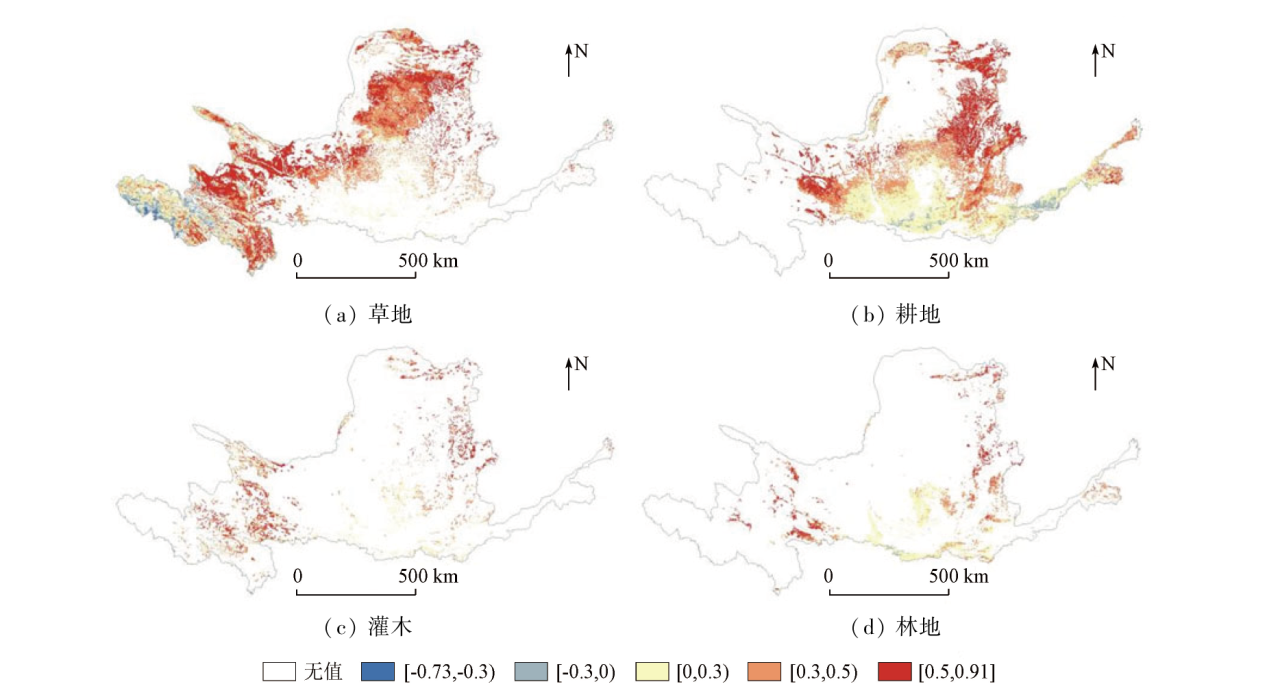
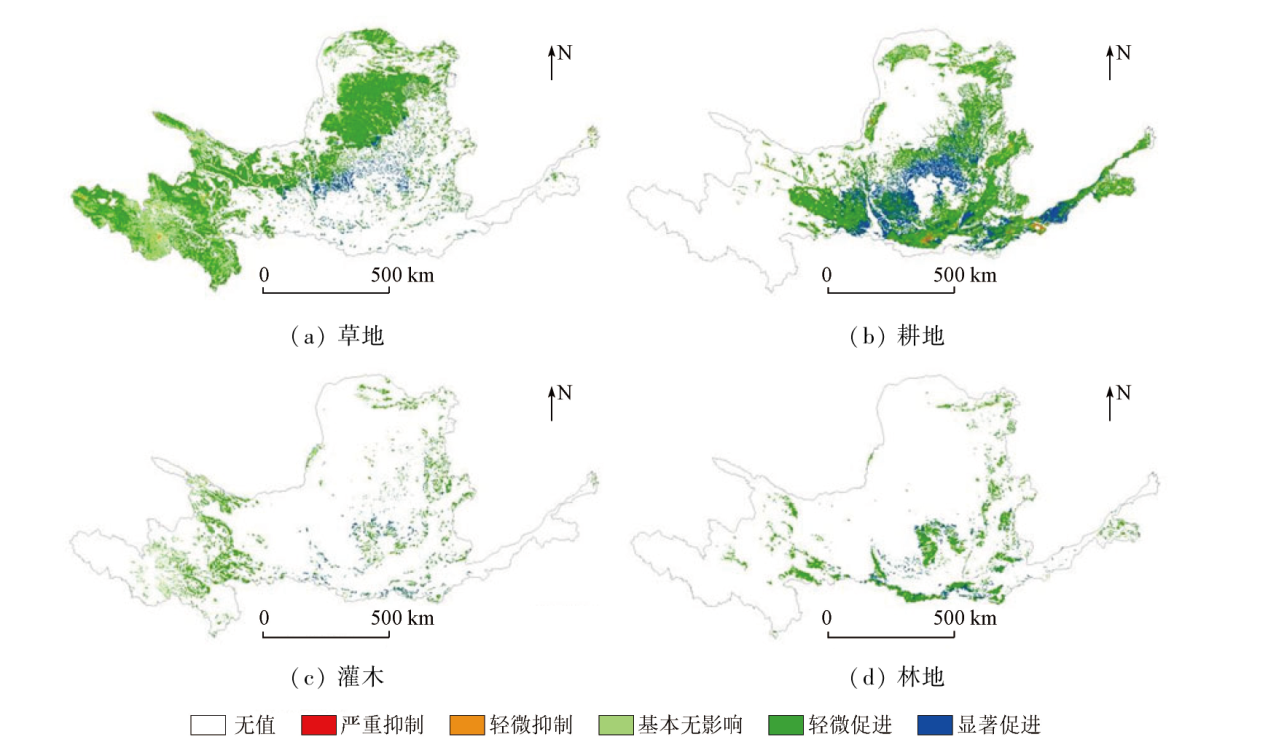
Understanding the spatiotemporal characteristics of vegetation growth in the Yellow River basin and their influencing factors is crucial for the conservation and development of the ecology. However, existing studies rarely focus on the latest spatiotemporal characteristics of different vegetation types in the basin and their relationships with their influencing factors. Using the 2000-2020 time series remote sensing data of MODIS normalized difference vegetation index (NDVI), along with methods including trend analysis, correlation analysis, partial correlation analysis, and residual analysis, this study investigated the spatiotemporal characteristics of various vegetation types in the Yellow River basin. Accordingly, this study clarified the mechanisms behind the impacts of temperature and precipitation on annual and monthly scales and explored the influence of human activities on the spatiotemporal characteristics of different vegetation types. The results indicate that from 2000 to 2020, the NDVI of different vegetation types in the Yellow River basin trended upward overall, particularly in cultivated land and forest land. However, the increasing trends trended downward at different degrees with increasing elevation. Over the 21 years, various vegetation types were improved in most areas in the basin. However, a few areas exhibited degraded vegetation types, primarily including grassland and cultivated land. The proportion of areas with anti-continuous future trends in various vegetation types notably increased. Temperature and precipitation produced positive impacts on the growth of various vegetation types in the Yellow River basin. Nevertheless, various vegetation types exhibited greater responses to precipitation than to temperature, and the responses featured notable time lags. Furthermore, grassland and shrub growth were more sensitive to precipitation and temperature. Human activities had positive impacts on the vegetation of the Yellow River basin overall. However, some negative effects were also observed in grassland and cultivated land, warranting attention in future planning. Overall, most areas exhibited improved vegetation in the Yellow River basin in the 20 years. Given that partial grassland and cultivated land experienced degradation, it is necessary to protect typical degradation areas. The findings of this study will provide scientific data and theoretical support for ecological construction and economic development in the Yellow River basin.

Key wordsvegetation type    Hurst index    residual analysis    remote sensing    Yellow River basin
收稿日期: 2023-05-17      出版日期: 2024-12-23
ZTFLH:  X87  
  TP79  
基金资助:国家自然科学基金项目“祁连山小流域尺度植被变化监测及其预测方法”(42161063);甘肃省黄河水环境重点实验室开放基金项目“黄河中上游小流域尺度植被变化监测及其预测研究”(21YRWEK001)
通讯作者: 张立峰(1982-),男,博士,教授,主要从事遥感应用研究。Email: 119273207@qq.com
作者简介: 魏潇(1997-),男,硕士研究生,主要从事生态遥感研究。Email: 2326779879@qq.com
引用本文:   
魏潇, 张立峰, 何毅, 曹胜鹏, 孙强, 高秉海. 2000—2020年黄河流域不同植被类型时空变化特征及其影响因素[J]. 自然资源遥感, 2024, 36(4): 229-241.
WEI Xiao, ZHANG Lifeng, HE Yi, CAO Shengpeng, SUN Qiang, GAO Binghai. 2000-2020 spatiotemporal variations of different vegetation types in the Yellow River basin and influencing factors. Remote Sensing for Natural Resources, 2024, 36(4): 229-241.
链接本文:  
https://www.gtzyyg.com/CN/10.6046/zrzyyg.2023138      或      https://www.gtzyyg.com/CN/Y2024/V36/I4/229
Fig.1  研究区行政区划图和植被覆盖分类图
Fig.2  2000—2020年黄河流域各植被区年均NDVI变化图
Fig.3-1  2000—2020年黄河流域各植被区植被覆盖等级空间分布
Fig.3-2  2000—2020年黄河流域各植被区植被覆盖等级空间分布
植被类型 植被覆盖等级
低植被区 较低植被区 中等植被区 高植被区
草地 49 31 19 1
耕地 16 51 30 3
灌木 10 27 52 11
林地 3 14 36 47
Tab.1  黄河流域2000—2020年不同植被NDVI植被覆盖等级面积占比
Fig.4  2000—2020年黄河流域各植被区植被NDVI变化趋势
植被类型 变化趋势等级
严重退化 轻微退化 稳定不变 轻微改善 明显改善
草地 0.2 1.2 4.5 16.9 77.2
耕地 0.8 1.5 1.7 5.9 90.1
灌木 0.1 0.9 3.5 11.9 83.6
林地 0.1 0.3 0.4 2.5 96.7
Tab.2  黄河流域2000—2020年不同植被NDVI变化趋势等级面积占比
Fig.5  2000—2020年黄河流域各植被区植被NDVI未来变化趋势
植被类型 未来变化趋势等级
持续严
重退化
持续轻
微退化
持续稳
定不变
持续轻
微改善
持续明
显改善
不确定
草地 0.1 0.5 1.6 5.8 40.1 51.9
耕地 0.7 1.2 1.2 4.1 53.3 39.5
灌木 0.1 0.5 2.1 6.9 51.6 39.5
林地 0.1 0.2 0.4 1.8 53.8 43.7
Tab.3  黄河流域不同植被NDVI未来变化趋势等级面积占比
Fig.6  不同植被NDVI沿海拔梯度的分布和增长趋势变化
注: 海拔带 1—25 分别代表 [0,200),[200,400),[400,600)···[4 600,4 800),[4 800,5 065] m。
Fig.7-1   2000—2020年黄河流域各植被区NDVI与气温偏相关系数空间分布
Fig.7-2  2000—2020年黄河流域各植被区NDVI与气温偏相关系数空间分布
植被类型 偏相关系数等级
[-0.76,
-0.3)
[-0.3,0) [0,0.3) [0.3,0.5) [0.5,
0.89]
草地 0.14 5.52 35.10 40.26 18.98
耕地 0.30 10.68 43.65 32.77 12.60
灌木 0.18 7.73 27.56 39.62 25.91
林地 0.28 16.02 36.92 29.52 17.26
Tab.4  黄河流域2000—2020年不同植被NDVI与气温偏相关性等级面积占比
Fig.8  2000—2020年黄河流域各植被区NDVI与降水偏相关系数空间分布
植被类型 偏相关系数等级
[-0.73,
-0.3)
[-0.3,0) [0,0.3) [0.3,0.5) [0.5,
0.91]
草地 1.35 6.95 16.99 36.27 38.44
耕地 0.11 4.97 33.29 34.48 27.15
灌木 0.28 3.56 26.35 32.99 36.82
林地 0.02 2.08 40.44 32.89 24.57
Tab.5  黄河流域2000—2020年不同植被NDVI与降水偏相关性等级面积占比
植被类型 气候因子 NDVI与气候因子相关系数
4月 5月 6月 7月 8月 9月
草地 P0 0.462* 0.362 0.435* 0.706** 0.5* -0.146
P1 0.051 0.372* 0.431* 0.365 0.706* 0.415*
P2 0.044 0.175 0.316 0.431* 0.202 0.507**
P3 -0.081 -0.042 0.123 0.214 0.233 0.265
T0 0.598** -0.044 0.108 -0.214 0.443* 0.115
T1 0.634** 0.524** -0.094 0.196 -0.175 0.433*
T2 0.054 0.457* 0.307 0.098 0.206 -0.381*
T3 0.273 -0.006 0.359 0.276 0.211 -0.053
耕地 P0 0.481* 0.371* 0.092 0.444* 0.387* -0.039
P1 0.161 0.507** 0.297 0.006 0.433* 0.372*
P2 -0.074 0.162 0.451* 0.395* -0.157 0.255
P3 -0.080 0.000 0.228 0.284 0.249 -0.087
T0 0.437* -0.238 -0.115 -0.304 0.42* 0.047
T1 0.488* 0.230 -0.172 -0.037 0.275 0.252
T2 0.048 0.085 0.153 -0.059 0.026 -0.437*
T3 0.378 -0.007 0.195 0.226 -0.005 -0.136
灌木 P0 0.473* 0.441* 0.316 0.588** 0.406* -0.172
P1 0.132 0.413* 0.425* 0.19 0.631** 0.309
P2 0.081 0.277 0.320 0.477 0.053 0.502*
P3 -0.093 -0.047 0.232 0.271 0.341 0.164
T0 0.662** -0.102 -0.015 -0.261 0.442* 0.109
T1 0.606** 0.497* -0.121 0.108 -0.268 0.392*
T2 0.078 0.375* 0.345 0.100 0.093 -0.493*
T3 0.206 0.049 0.283 0.298 0.128 -0.231
林地 P0 0.327 0.451* 0.019 0.377* 0.262 -0.135
P1 0.113 0.413* 0.379* -0.049 0.411* 0.253
P2 0.002 0.265 0.359 0.423* -0.162 0.312
P3 -0.182 0.031 0.321 0.304 0.253 0.009
T0 0.596** -0.202 -0.149 -0.321 0.414* 0.111
T1 0.439* 0.284 -0.196 -0.037 -0.299 0.285
T2 0.097 0.033 0.193 -0.112 -0.039 -0.482*
T3 0.231 0.005 0.057 0.237 -0.029 -0.239
Tab.6  黄河流域不同植被区当月NDVI与前0~3个月气温和降水的相关系数
Fig.9  2000—2020年人类活动对黄河流域NDVI影响的空间分布
植被类型 影响等级
[-0.02,
-0.006)
[-0.006,
-0.000 6)
[-0.000 6,
0.000 6)
[0.000 6,
0.006)
[0.006,
0.026]
草地 0.02 1.45 15.78 76.43 6.32
耕地 0.17 2.06 3.39 69.81 24.57
灌木 0.01 0.93 11.34 77.94 9.78
林地 0.05 0.48 1.45 83.89 14.13
Tab.7  2000—2020年人类活动对黄河流域NDVI影响等级面积占比
[1] Wang X, Biederman J A, Knowles J F, et al. Satellite solar-induced chlorophyll fluorescence and near-infrared reflectance capture complementary aspects of dryland vegetation productivity dynamics[J]. Remote Sensing of Environment, 2022, 270:112858.
[2] 张逸如, 刘晓彤, 高文强, 等. 天然林保护工程区近20年森林植被碳储量动态及碳汇(源)特征[J]. 生态学报, 2021, 41(13):5093-5105.
Zhang Y R, Liu X T, Gao W Q, et al. Dynamic changes of forest vegetation carbon storage and the characteristics of carbon sink (source) in the Natural Forest Protection Project region for the past 20 years[J]. Acta Ecologica Sinica, 2021, 41(13):5093-5105.
[3] 王菲, 曹永强, 周姝含, 等. 黄河流域生态功能区植被碳汇估算及其主要气象要素分析[J]. 生态学报, 2023, 43(6)1-14.
Wang F, Cao Y Q, Zhou S H, et al. Estimation of vegetation carbon sink in the Yellow River Basin ecological function area and analysis of its main meteorological elements[J]. Acta Ecologica Sinica, 2023, 43(6)1-14.
[4] He Y, Yan H W, Ma L, et al. Spatiotemporal dynamics of the vegetation in Ningxia,China using MODIS imagery[J]. Front Earth Sci, 2020, 14(1):221-235.
[5] 胡盈盈, 戴声佩, 罗红霞, 等. 2001—2015年海南岛橡胶林物候时空变化特征分析[J]. 自然资源遥感, 2022, 34(1):210-217.doi:10.6046/zrzyyg.2021110.
Hu Y Y, Dai S P, Luo H X, et al. Spatio-temporal change characteristics of rubber forest phenology in Hainan Island during 2001—2015[J]. Remote Sensing for Natural Resources, 2022, 34(1):210-217.
[6] 徐嘉昕, 房世波, 张廷斌, 等. 2000—2016年三江源区植被生长季NDVI变化及其对气候因子的响应[J]. 国土资源遥感, 2020, 32(1);237-246.doi:10.6046/gtzyyg.2020.01.32.
Xu J X, Fang S B, Zhang T B, et al. NDVI changes and its correlation with climate factors of the Three River-Headwater region in growing seasons during 2000—2016[J]. Remote Sensing for Natural Resources, 2020, 32(1):237-246.doi:10.6046/gtzyyg.2020.01.32.
[7] Ma Y R, Guan Q Y, Sun Y F, et al. Three-dimensional dynamic characteristics of vegetation and its response to climatic factors in the Qilian Mountains[J]. CATENA, 2022, 208:105694.
[8] 张乐艺, 李霞, 冯京辉, 等. 2000—2018年黄河流域NDVI时空变化及其对气候和人类活动的双重响应[J]. 水土保持通报, 2021, 41(5):276-286.
Zhang L Y, Li X, Feng J H, et al. Spatial-temporal changes of NDVI in Yellow River basin and its dual response to climate change and human activities during 2000—2018[J]. Bulletin of Soil and Water Conservation, 2021, 41(5):276-286.
[9] 田智慧, 任祖光, 魏海涛. 2000—2020年黄河流域植被时空演化驱动机制[J]. 环境科学, 2022, 43(2):743-751.
Tian Z H, Ren Z G, Wei H T. Driving mechanism of the spatiotemporal evolution of vegetation in the Yellow River Basin from 2000 to 2020[J]. Environmental Science, 2022, 43(2):743-751.
[10] 陈晨, 王义民, 黎云云, 等. 黄河流域1982—2015年不同气候区植被变化规律及其影响因素[J]. 长江科学院院报, 2022, 39(2):57-62.
Chen C, Wang Y M, Li Y Y, et al. Vegetation changes and influencing factors in different climatic regions of the Yellow River Basin from 1982 to 2015[J]. Journal of Yangtze River Scientific Research Institute, 2022, 39(2):57-62
[11] 刘静, 温仲明, 刚成诚. 黄土高原不同植被覆被类型NDVI对气候变化的响应[J]. 生态学报, 2020, 40(2):678-691.
Liu J, Wen Z M, Gang C C. Normalized difference vegetation index of different vegetation cover types and its responses to climate change in the Loess Plateau[J]. Acta Ecologica Sinica, 2020, 40(2):678-691.
[12] 解晗, 同小娟, 李俊, 等. 2000—2018年黄河流域生长季NDVI、EVI变化及其对气候因子的响应[J]. 生态学报, 2022, 42(11):1-14.
Xie H, Tong X J, Li J, et al. Changes of NDVI and EVI and their responses to climatic variables in the Yellow River Basin during the growing season of 2000—2018[J]. Acta Ecologica Sinica, 2022, 42(11):1-14.
[13] 易扬, 胡昕利, 史明昌, 等. 基于MODIS NDVI的长江中游区域植被动态及与气候因子的关系[J]. 生态学报, 2021, 41(19):7796-7807.
Yi Y, Hu X L, Shi M C, et al. Vegetation dynamics and its relationship with climate factors in the middle reaches of the Yangtze River based on MODIS NDVI[J]. Acta Ecologica Sinica, 2021, 41(19):7796-7807.
[14] 张志强, 刘欢, 左其亭, 等. 2000—2019年黄河流域植被覆盖度时空变化[J]. 资源科学, 2021, 43(4):849-858.
doi: 10.18402/resci.2021.04.18
Zhang Z Q, Liu H, Zuo Q T, et al. Spatiotemporal change of fractional vegetation cover in the Yellow River Basin during 2000—2019[J]. Resources Science, 2021, 43(4):849-858.
[15] 邱丽莎, 何毅, 张立峰, 等. 祁连山MODIS LST时空变化特征及影响因素分析[J]. 干旱区地理, 2020, 43(3):726-737.
Qiu L S, He Y, Zhang L F, et al. Spatiotemporal variation characteristics and influence factors of MODIS LST in Qilian Mountains[J]. AridLand Geography, 2020, 43(3):726-737.
[16] 杨艳萍, 陈建军, 覃巧婷, 等. 2000—2018年广西植被时空变化及其对地形、气候和土地利用的响应[J]. 农业工程学报, 2021, 37(17):234-241.
Yang Y P, Chen J J, Qin Q T, et al. Temporal and spatial variation of vegetation and its response to topography,climate and land use in Guangxi during 2000—2018[J]. Transactions of the Chinese Society of Agricultural Engineering, 2021, 37(17):234-241.
[17] 尹振良, 冯起, 王凌阁, 等. 2000—2019年中国西北地区植被覆盖变化及其影响因子[J]. 中国沙漠, 2022, 42(4):11-21.
doi: 10.7522/j.issn.1000-694X.2021.00200
Yin Z L, Feng Q, Wang L G, et al. Vegetation coverage change and its influencing factors across the northwest region of China during 2000—2019[J]. Journal of Desert Research, 2022, 42(4):11-21.
[18] 王雄, 张翀, 李强. 黄土高原植被覆盖与水热时空通径分析[J]. 生态学报, 2023, 43(2):719-730.
Wang X, Zhang C, Li Q. Path analysis between vegetation coverage and climate factors in the Loess Plateau[J]. Acta Ecologica Sinica. 2023, 43(2):719-730.
[19] 王志鹏, 张宪洲, 何永涛, 等. 2000—2015年青藏高原草地归一化植被指数对降水变化的响应[J]. 应用生态学报, 2018、 29(1):75-83.
doi: 10.13287/j.1001-9332.201801.014
Wang Z P, Zhang X Z, He Y T, et al. Responses of normalized difference vegetation index (NDVI) to precipitation changes on the Grassland of Tibetan Plateau from 2000 to 2015[J]. Chinese Journal of Applied Ecology, 2018、 29(1):75-83.
[20] Vicente-Serrano S M, Camarero J J, Azorin-Molina C. Diverse responses of forest growth to drought time-scales in the Northern Hemisphere[J]. Global Ecology and Biogeography, 2014, 23(9):1019-1030.
[21] Yamori W, Hikosaka K., Way D A. Temperature response of photosynthesis in C3,C4,and CAM plants:Temperature acclimation and temperature adaptation[J]. Photosynth Research. 2014 119,101-117.
[22] 金凯, 王飞, 韩剑桥, 等. 1982—2015年中国气候变化和人类活动对植被NDVI变化的影响[J]. 地理学报, 2020, 75(5):961-974.
doi: 10.11821/dlxb202005006
Jin K, Wang F, Han J Q, et al. Contribution of climatic change and human activities to vegetation NDVI change over China during 1982—2015[J]Acta Geographica Sinica, 2020, 75(5):961-974.
[1] 曲海成, 梁旭. 融合混合注意力机制与多尺度特征增强的高分影像建筑物提取[J]. 自然资源遥感, 2024, 36(4): 107-116.
[2] 康辉, 窦文章, 韩灵怡, 丁梓越, 吴亮廷, 侯璐. 基于DeepLabv3+模型的地表水体快速遥感监测[J]. 自然资源遥感, 2024, 36(4): 117-123.
[3] 张冬韵, 吴田军, 李曼嘉, 郭逸飞, 骆剑承, 董文. 地块尺度农作物遥感分类及其不确定性分析[J]. 自然资源遥感, 2024, 36(4): 124-134.
[4] 潘俊杰, 慎利, 鄢薪, 聂欣, 董宽林. 一种基于对抗学习的高分辨率遥感影像语义分割无监督域自适应方法[J]. 自然资源遥感, 2024, 36(4): 149-157.
[5] 赵金玲, 黄健, 梁梓君, 赵学丹, 靳涛, 葛行行, 魏晓燕, 邵远征. 基于BDANet的地震灾害建筑物损毁评估[J]. 自然资源遥感, 2024, 36(4): 193-200.
[6] 庄会富, 王鹏, 苏亚男, 张祥, 范洪冬. 基于多源时序SAR数据的涿州洪涝淹没动态监测[J]. 自然资源遥感, 2024, 36(4): 218-228.
[7] 赵玉灵, 杨金中, 孙卫东, 于浩, 邢宇, 陈栋, 马新营, 王体鑫, 王聪. 伊犁河谷矿山地质环境评价分析与生态恢复治理对策[J]. 自然资源遥感, 2024, 36(4): 23-30.
[8] 祁昌炜, 董基恩, 程旭, 叶高峰, 何书跃, 代威, 汪冰. ZY-1 02D高光谱数据在柴北缘荒漠区蚀变矿物填图及找矿中的应用[J]. 自然资源遥感, 2024, 36(4): 31-42.
[9] 冯磊, 王轶, 李文吉, 王彦佐, 郑向向, 王珊珊, 张玲. 三维地质灾害隐患识别业务平台研发与应用[J]. 自然资源遥感, 2024, 36(4): 321-327.
[10] 邱骏挺, 李江坤, 葛藤菲, 木红旭, 芮歆旻, 杨云汉, 杨燕杰. 多源遥感信息在砂岩型铀矿勘查中的应用——以巴音戈壁盆地银根地区为例[J]. 自然资源遥感, 2024, 36(4): 43-54.
[11] 赖仕久, 胡晋山, 康建荣, 王小兵. 煤炭资源型区域生态环境演变研究——以山西省为例[J]. 自然资源遥感, 2024, 36(4): 62-74.
[12] 叶丽娟, 段霄龙, 李婷, 张静, 张云, 陈东磊. 河北省采矿损毁土地分布及治理状况分析[J]. 自然资源遥感, 2024, 36(4): 75-81.
[13] 骆振海, 张超, 冯绍元, 唐敏, 刘锐, 孔纪迎. 土壤盐渍化光学遥感监测方法研究进展[J]. 自然资源遥感, 2024, 36(4): 9-22.
[14] 凌肖露, 陈朝荣, 郭维栋, 秦凯, 张锦龙. ESA CCI土壤湿度资料在中国东部的综合评估[J]. 自然资源遥感, 2024, 36(4): 92-106.
[15] 秦其明, 吴自华, 叶昕, 王楠, 韩谷怀. 煤层气富集区遥感勘查研究进展与展望[J]. 自然资源遥感, 2024, 36(3): 1-12.
Viewed
Full text


Abstract

Cited

  Shared   
  Discussed   
京ICP备05055290号-2
版权所有 © 2015 《自然资源遥感》编辑部
地址:北京学院路31号中国国土资源航空物探遥感中心 邮编:100083
电话:010-62060291/62060292 E-mail:zrzyyg@163.com
本系统由北京玛格泰克科技发展有限公司设计开发