Reconstruction of vegetation index time-series data for crops at a 15 m resolution after reflectance normalization of multi-satellite data
AO Yangqian1,2(), SUN Liang1()
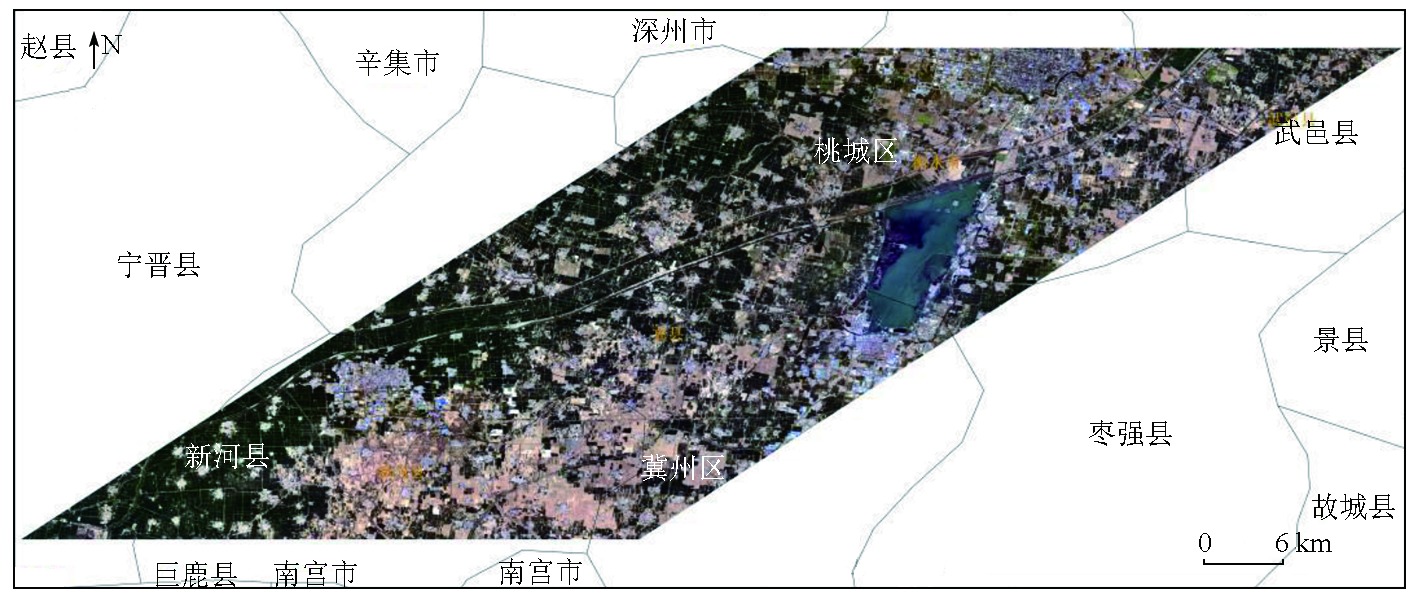
1. Institute of Agricultural Resources and Agricultural Zoning,Chinese Academy of Agricultural Sciences/National Key Laboratory for Efficient Utilization of Arid and Semiarid Cultivated Land in the North,Beijing 100081,China 2. Jiangxi Institute of Meteorological Sciences/Key Laboratory of Climate Change Risk and Meteorological Disaster Prevention of Jiangxi Province,Nanchang 330096,China
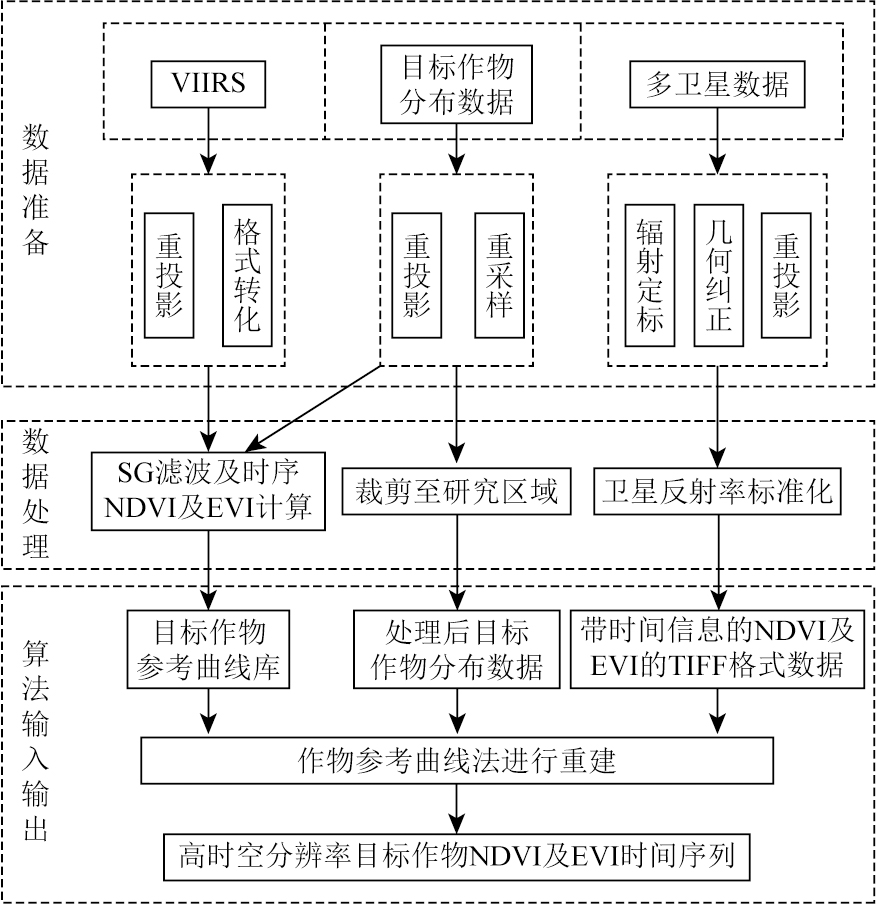
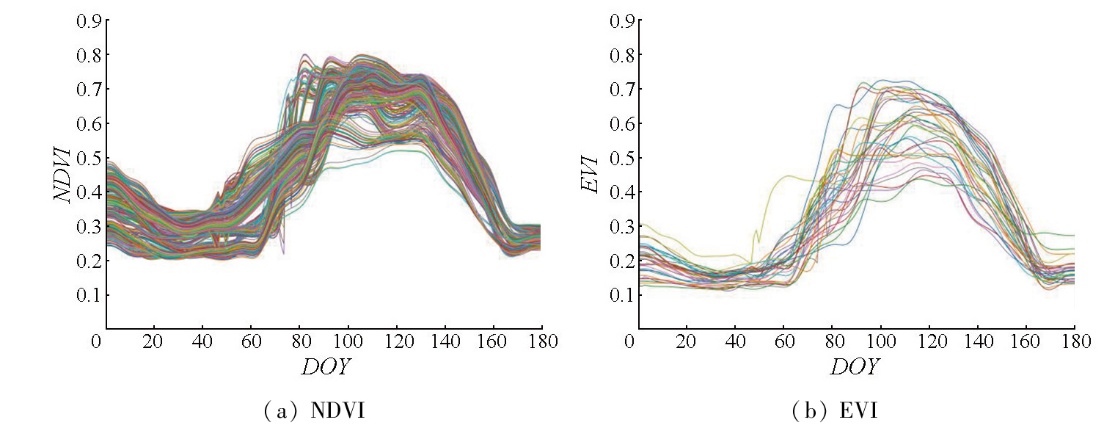
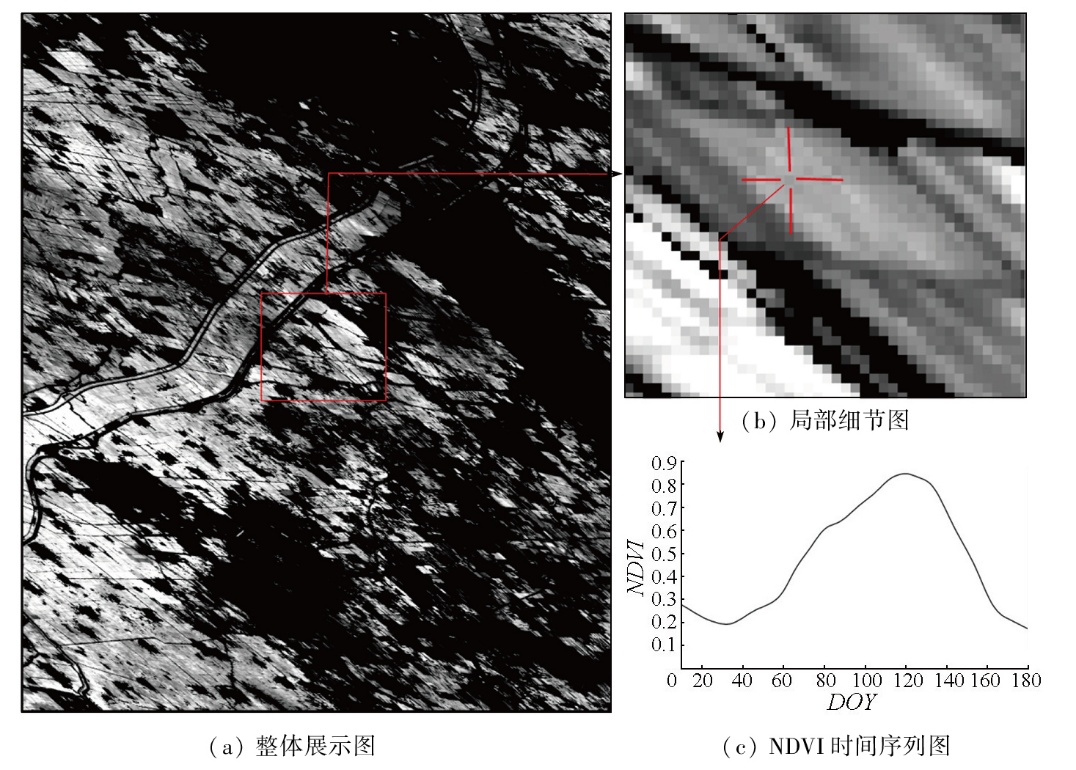
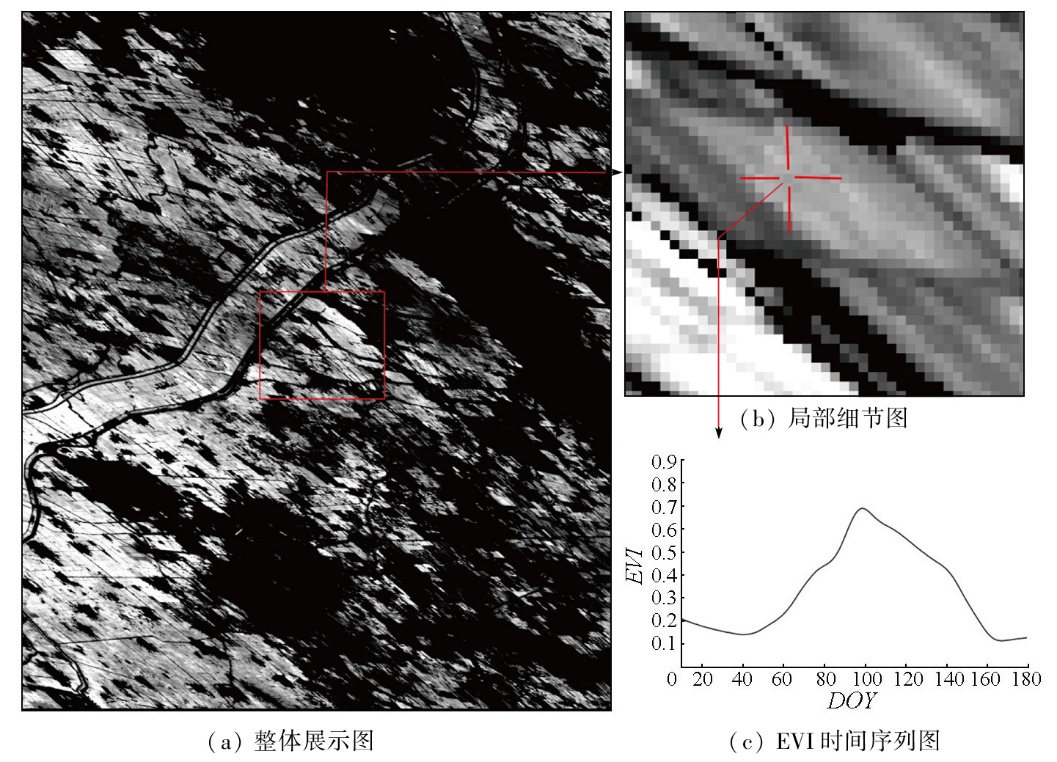
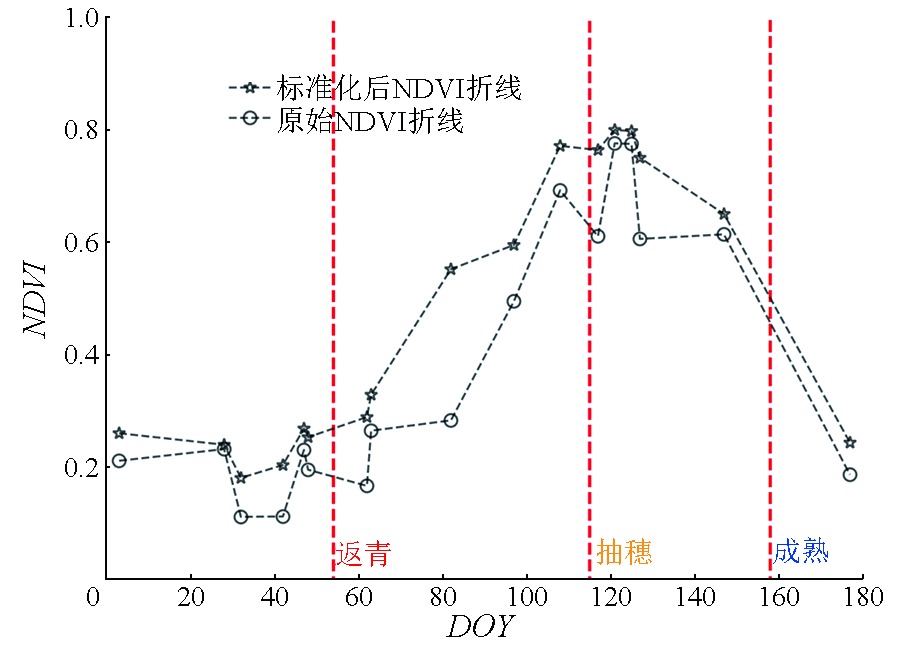
Changes in the vegetation index can reflect variations in vegetation cover and growth in the region to some extent. Monitoring the changes in vegetation index time-series data plays a significant role in local agricultural management. However,existing methods for vegetation index time-series data reconstruction face challenges such as a single data source input and low spatial resolution of reconstruction results. In response to this,this paper proposes a reconstruction method for vegetation index time-series data that integrates the satellite data standardization method and the crop reference curve method. Consequently,it reconstructed vegetation index time-series data with high spatiotemporal resolution for winter wheat in the study area in 2021,including normalized differential vegetation index (NDVI) and enhanced vegetation index (EVI). The results show that after reflectance normalization,the coefficient of determination (R2) for GF-1 satellite and VIIRS surface reflectance data in red,green,infrared,and near infrared bands generally increased by 0.05%,with a few exceeding 0.1%. The root mean square error (RMSE) was reduced,with the majority decreasing by 0.01. In contrast,the relative root mean square error (rRMSE) showed a reduction of about 2%. Most data from the GF-6 satellites exhibited an increase of about 0.12 in R2,a decrease of 0.03 in RMSE,and a general decline in rRMSE ranging from 3% to 4%. In contrast,the data from the Sentinel-2 satellite show an overall increase of about 0.05 in R2,as well as a decrease of around 0.001 and 2% in RMSE and rRMSE,respectively. The accuracy assessment results for the reconstructed high-resolution vegetation index time-series data indicate that the NDVI time-series reconstruction results presented high R2 values in the validation period,with five validation images reaching 0.49 and above. The RMSE was less than 0.1 in all validation periods,while the relative error (RE) was less than 15% in most cases,with only one validation image reaching 18%. Similarly,the EVI time-series reconstruction results also exhibited high R2 values,with five validation images above 0.44. Both RMSE and rRMSE values were less than 0.15 and 20%,respectively.
敖洋钎, 孙亮. 多卫星数据反射率标准化后重建15 m分辨率作物植被指数时间序列[J]. 自然资源遥感, 2025, 37(5): 206-215.
AO Yangqian, SUN Liang. Reconstruction of vegetation index time-series data for crops at a 15 m resolution after reflectance normalization of multi-satellite data. Remote Sensing for Natural Resources, 2025, 37(5): 206-215.
Chen J, Jönsson P, Tamura M, et al. A simple method for reconstructing a high-quality NDVI time-series data set based on the Savitzky-Golay filter[J]. Remote Sensing of Environment, 2004, 91(3/4):332-344.
Bian J H, Li A N, Song M Q, et al. Reconstruction of NDVI time-series datasets of MODIS based on Savitzky-Golay filter[J]. Journal of Remote Sensing, 2010, 14(4):725-741.
Hu S S, Huang C X, Yang B, et al. Reconstruction of MODIS vegetation index time series by adaptive weighted Savitzky-Golay filter[J]. Science of Surveying and Mapping, 2020, 45(4):105-116.
[4]
Lovell J L, Graetz R D. Filtering pathfinder AVHRR land NDVI data for Australia[J]. International Journal of Remote Sensing, 2001, 22(13):2649-2654.
Wang P X, Xun L, Li L, et al. Extraction of planting areas of main crops based on Fourier transformed characteristics of time series leaf area index products[J]. Transactions of the Chinese Society of Agricultural Engineering, 2017, 33(21):207-215.
[6]
Yang G, Shen H, Zhang L, et al. A moving weighted harmonic analysis method for reconstructing high-quality SPOT vegetation NDVI time-series data[J]. IEEE Transactions on Geoscience and Remote Sensing, 2015, 53(11):6008-6021.
[7]
Jonsson P, Eklundh L. Seasonality extraction by function fitting to time-series of satellite sensor data[J]. IEEE Transactions on Geoscience and Remote Sensing, 2002, 40(8):1824-1832.
Shao Y T, Wang J L, Yan X R. The phenological characteristics of Mongolian vegetation and its response to geographical elements[J]. Geographical Research, 2021, 40(11):3029-3045.
[9]
Ma M, Veroustraete F. Reconstructing pathfinder AVHRR land NDVI time-series data for the Northwest of China[J]. Advances in Space Research, 2006, 37(4):835-840.
Fan H. MODIS NDVI time-series data reconstruction integrating with the quality assessment science data set(QA-SDS)[J]. Remote Sensing Technology and Application, 2013, 28(1):90-96.
[11]
Sun L, Gao F, Xie D, et al. Reconstructing daily 30 m NDVI over complex agricultural landscapes using a crop reference curve approach[J]. Remote Sensing of Environment, 2021, 253:112156.
[12]
Che X, Zhang H K, Liu J. Making Landsat 5,7 and 8 reflectance consistent using MODIS nadir-BRDF adjusted reflectance as reference[J]. Remote Sensing of Environment, 2021, 262:112517.
Jia L L, Liu K T, Sun Y M, et al. Dynamic changes of fertilization rate,yield and nutrient use efficiency in recent 16 years in the low plain area of Hebei Province[J]. Soil and Fertilizer Sciences in China, 2017(3):50-55.
Pan H Z. Regional winter wheat growth simulation based on multi-model remote sensing data assimilation[D]. Beijing: Chinese Academy of Agricultural Sciences, 2020.
[16]
吴尚蓉. 基于流依赖背景误差同化系统的冬小麦估产研究[D]. 北京: 中国农业科学院, 2019.
Wu S R. Winter wheat yield estimation based on flow-dependent background error assimilation system[D]. Beijing: Chinese Academy of Agricultural Sciences, 2019.
Yan F, Shi P J, Wu J J, et al. The phenology character of winter wheat by MODIS-EVI data in Hebei China[J]. Acta Ecologica Sinica, 2008, 28(9):4381-4387.
 2025, Vol. 37
  ), 孙亮1(