|
|
 |
|

|
|
|
The multidimensional measure and spatial-temporal evolution analysis of poverty in southwestern China based on nighttime light data |
ZHANG Qiongyi1( ), LI Kun2, YONG Zhiwei3, XIONG Junnan1,4(), CHENG Weiming4, XIAO Kunhong5, LIU Dongli6 ), LI Kun2, YONG Zhiwei3, XIONG Junnan1,4(), CHENG Weiming4, XIAO Kunhong5, LIU Dongli6 |
1. School of Civil Engineering and Geomatics, Southwest Petroleum University, Chengdu 610500, China
2. Sichuan Electric Power Design and Consulting Co. Ltd., Chengdu 610041, China
3. School of Geoscience and Technology, Southwest Petroleum University, Chengdu 610500, China
4. State Key Laboratory of Resources and Environmental Information System, Institute of Geographic Sciences and Natural Resources Research, Chinese Academy of Sciences, Beijing 100101, China
5. Sichuan Province Coalfield Surverying and Mapping Engineering Institute, Chengdu 610072, China
6. The Sixth Topographic Survey Team of the Ministry of Natural Resources, Chengdu 610500, China |
|
|
|
|
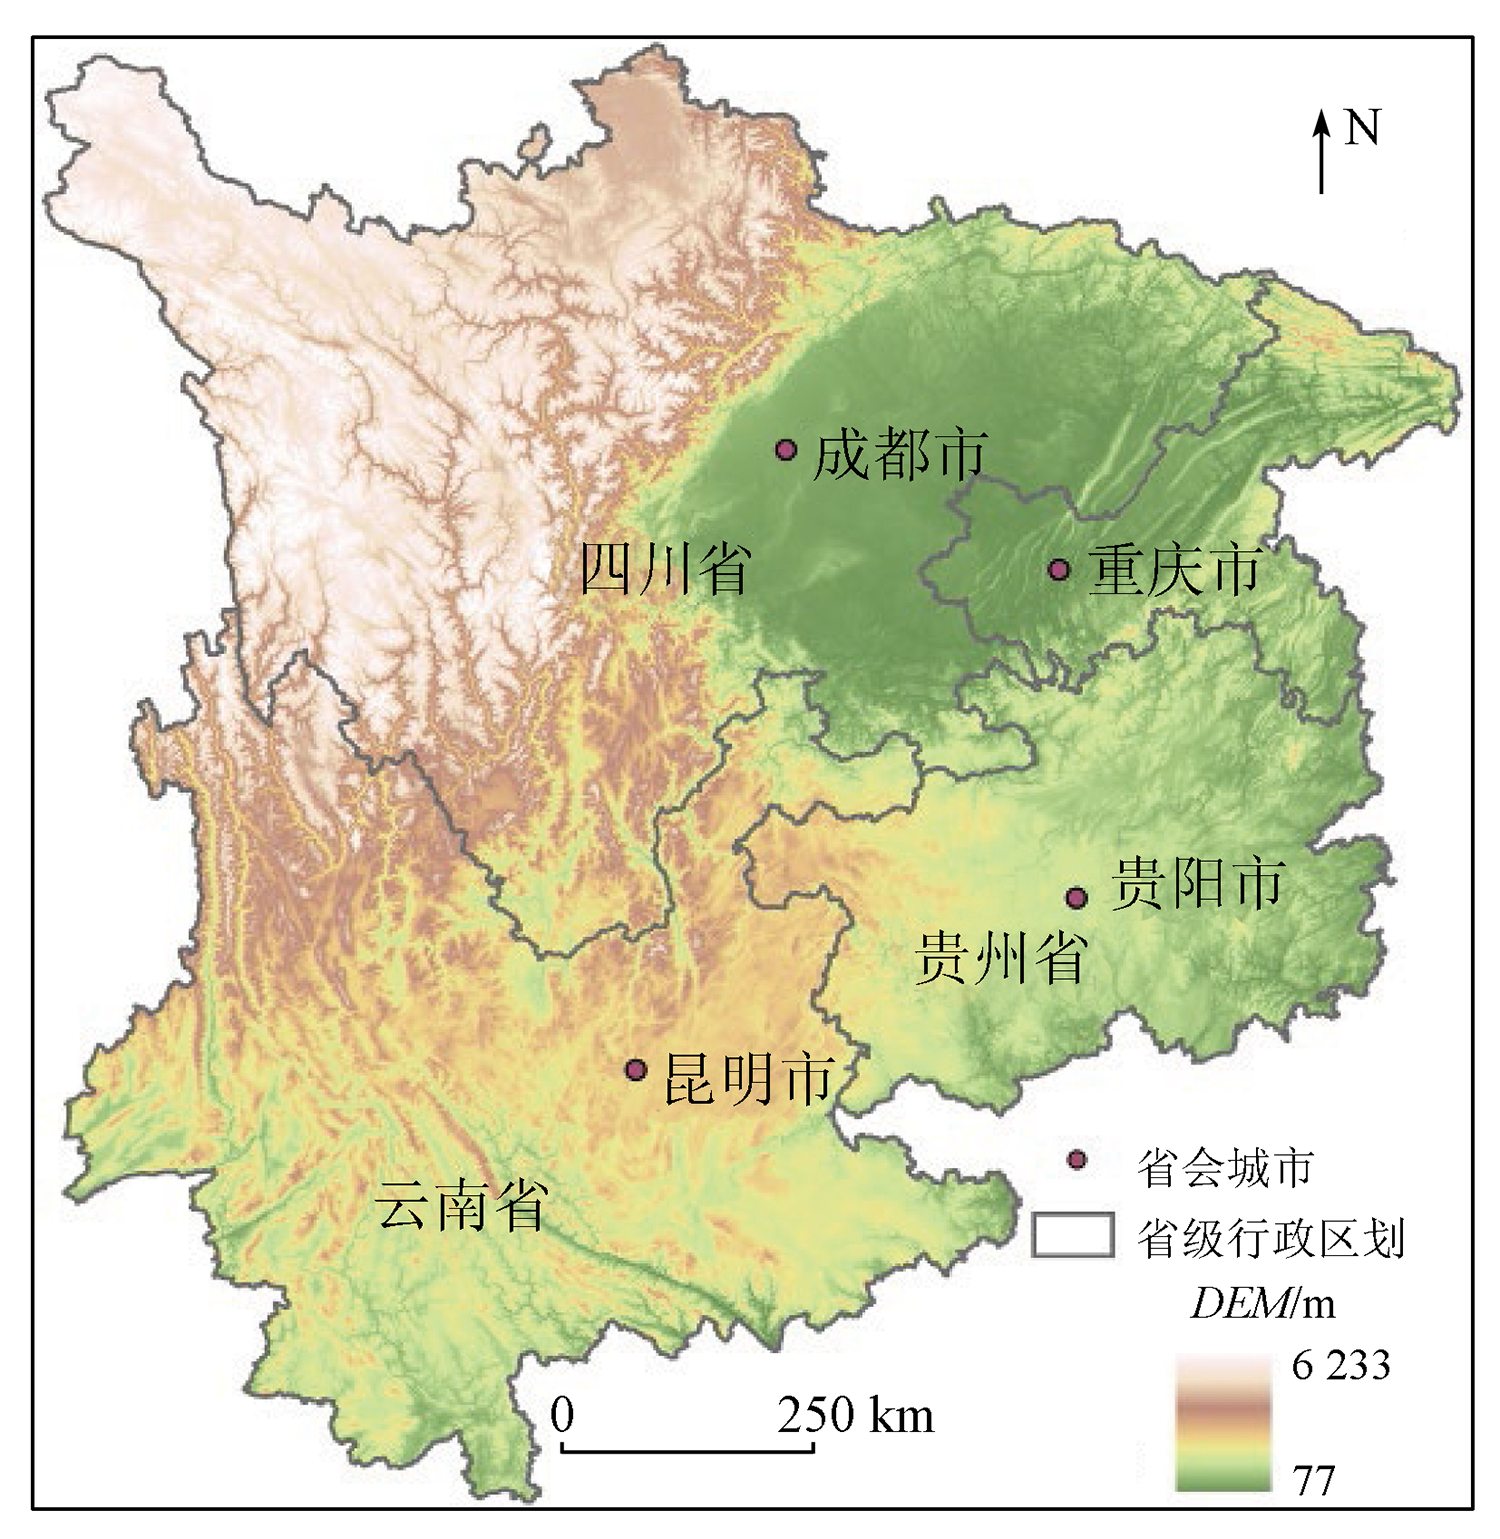
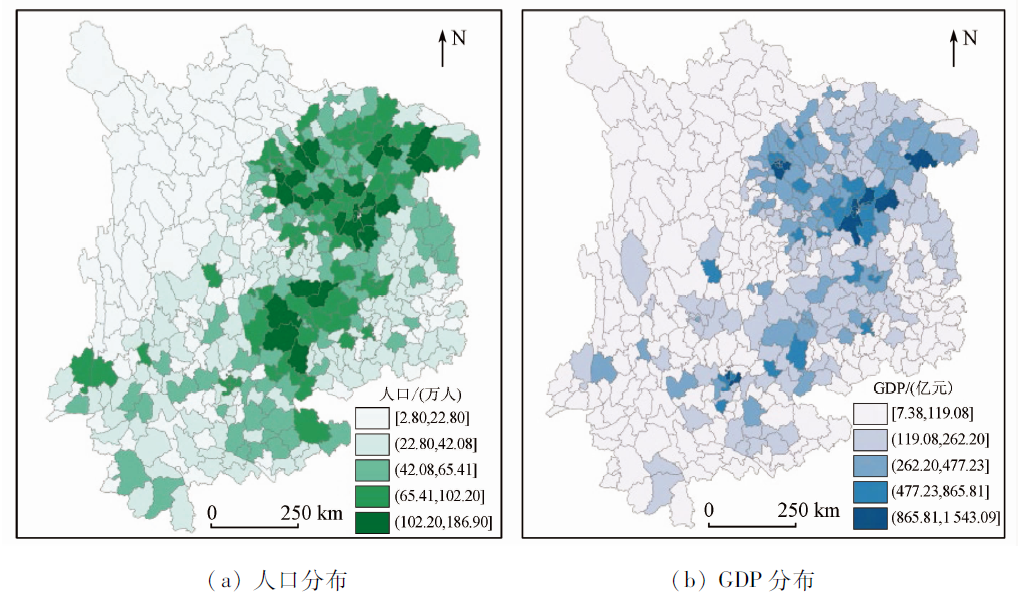
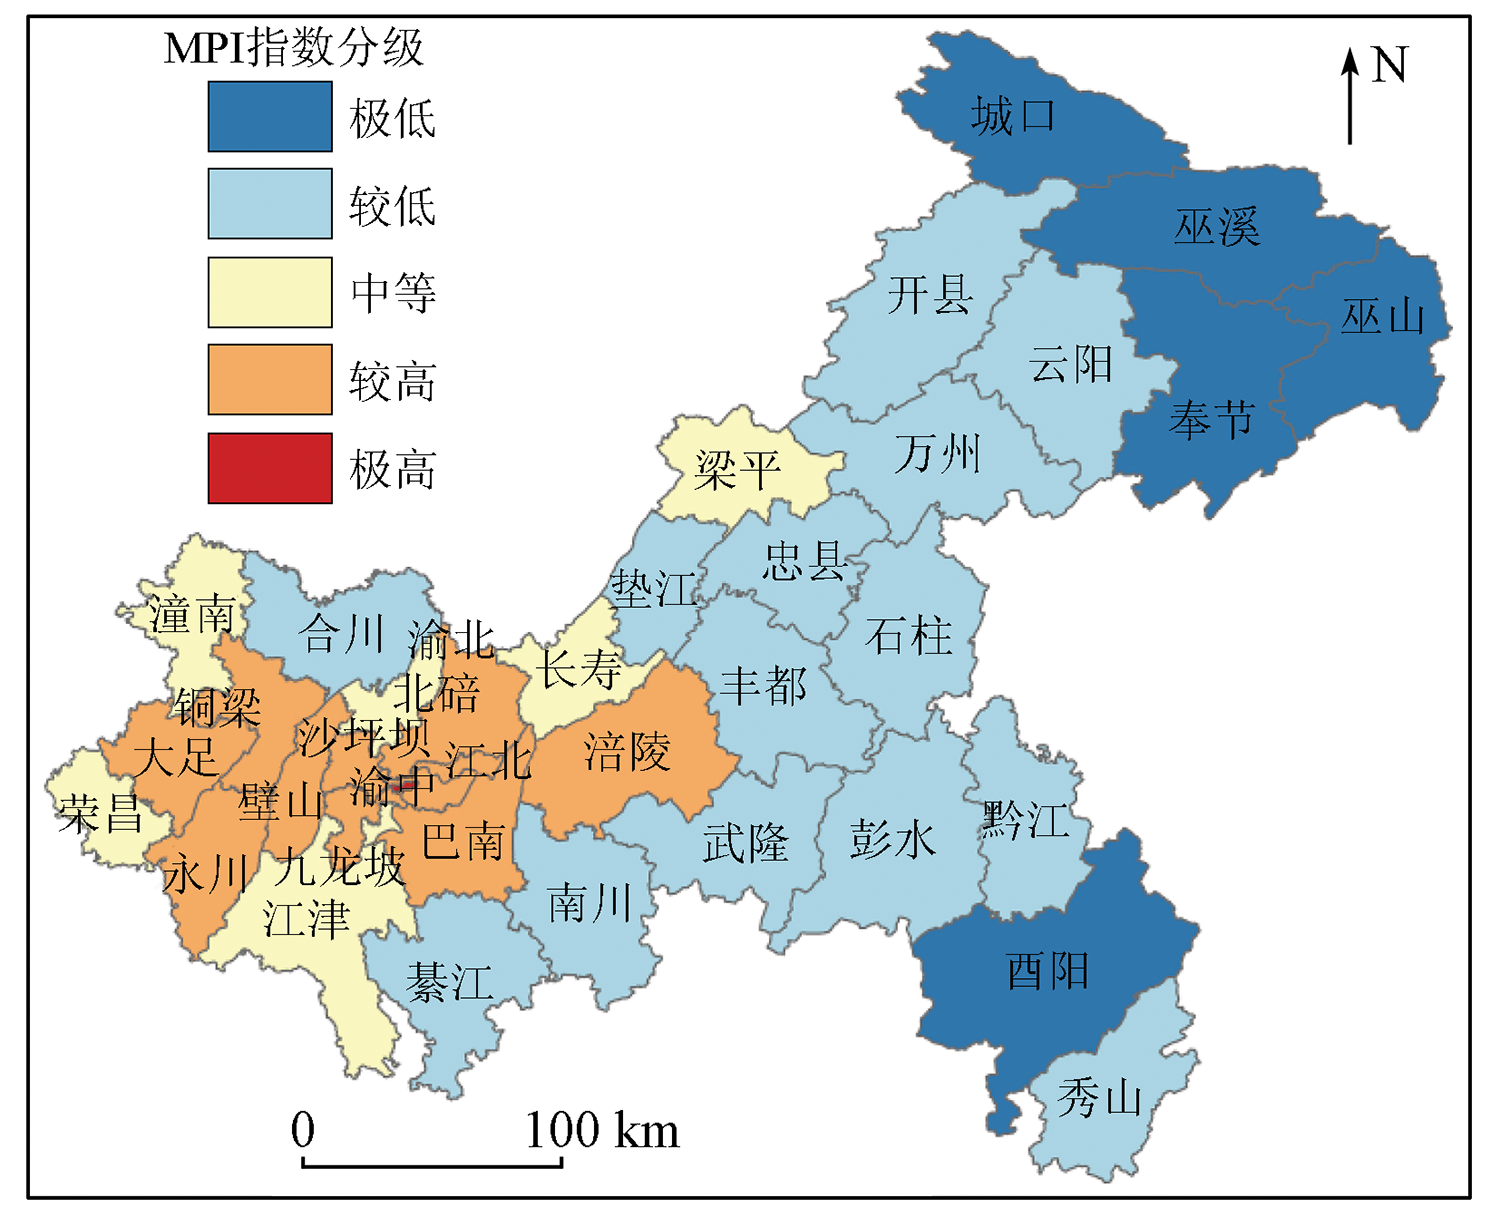
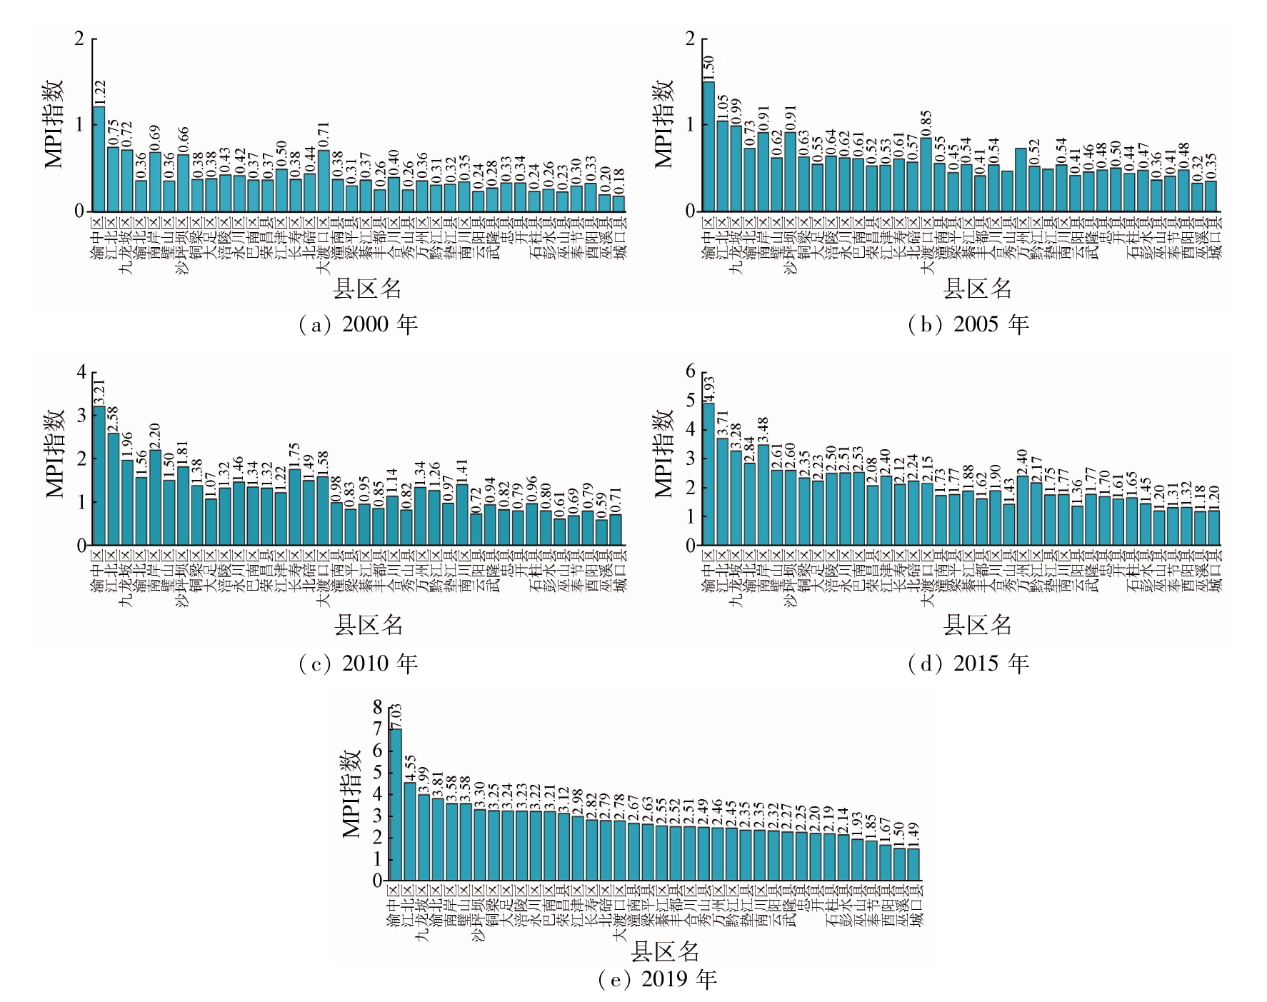
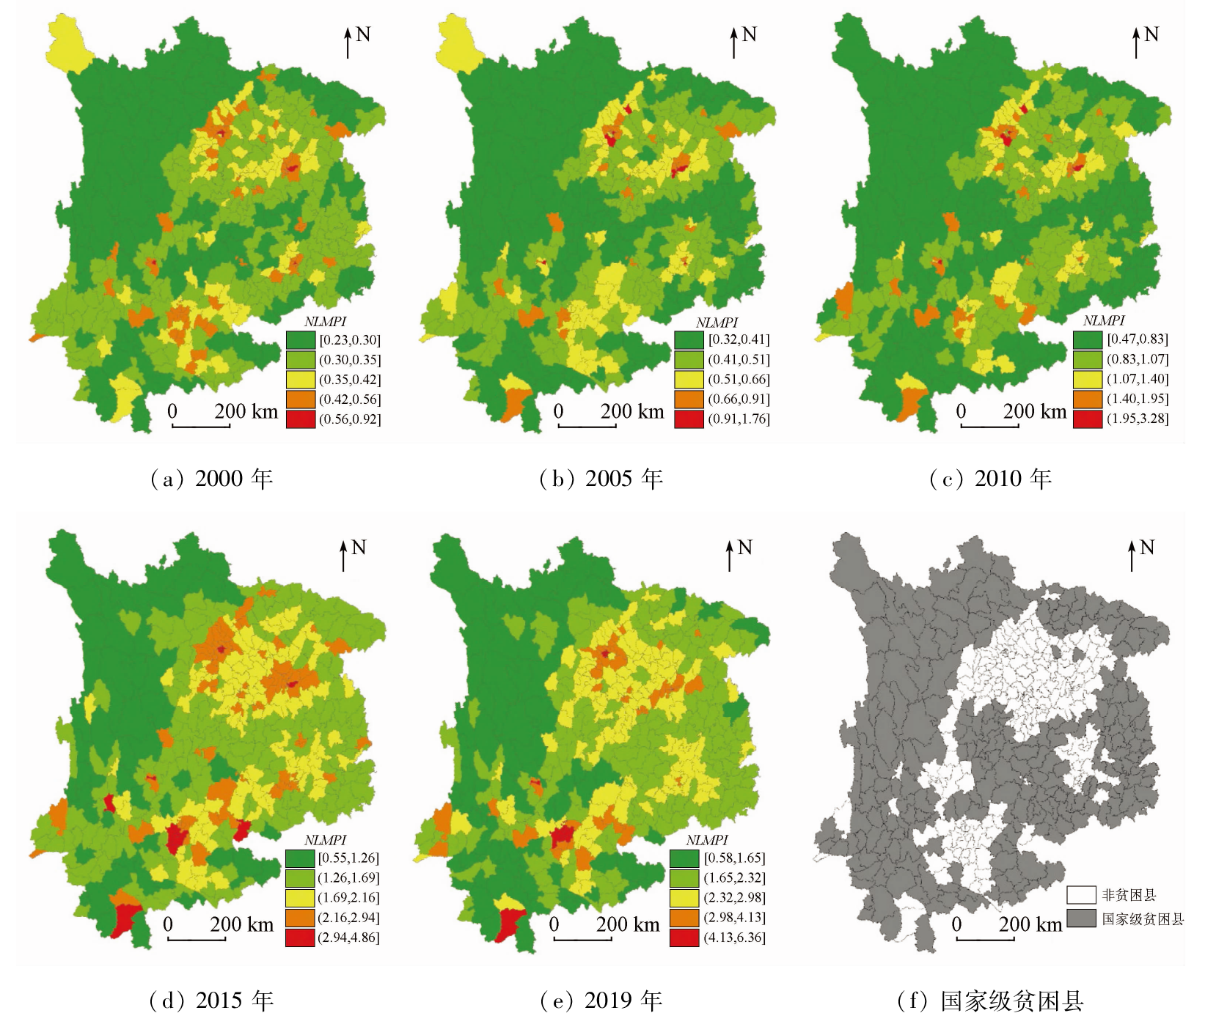
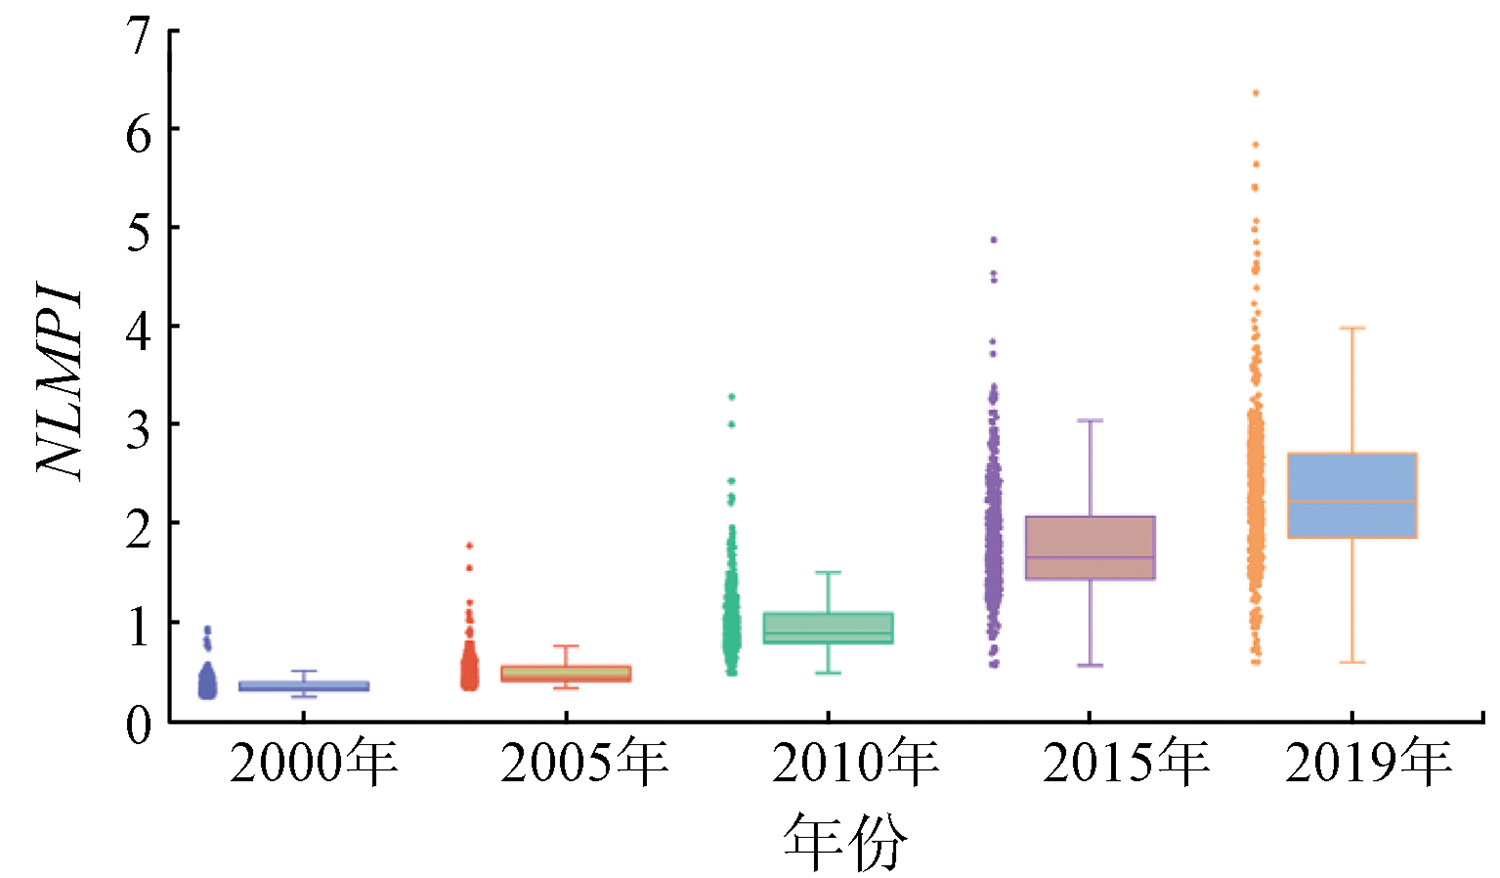
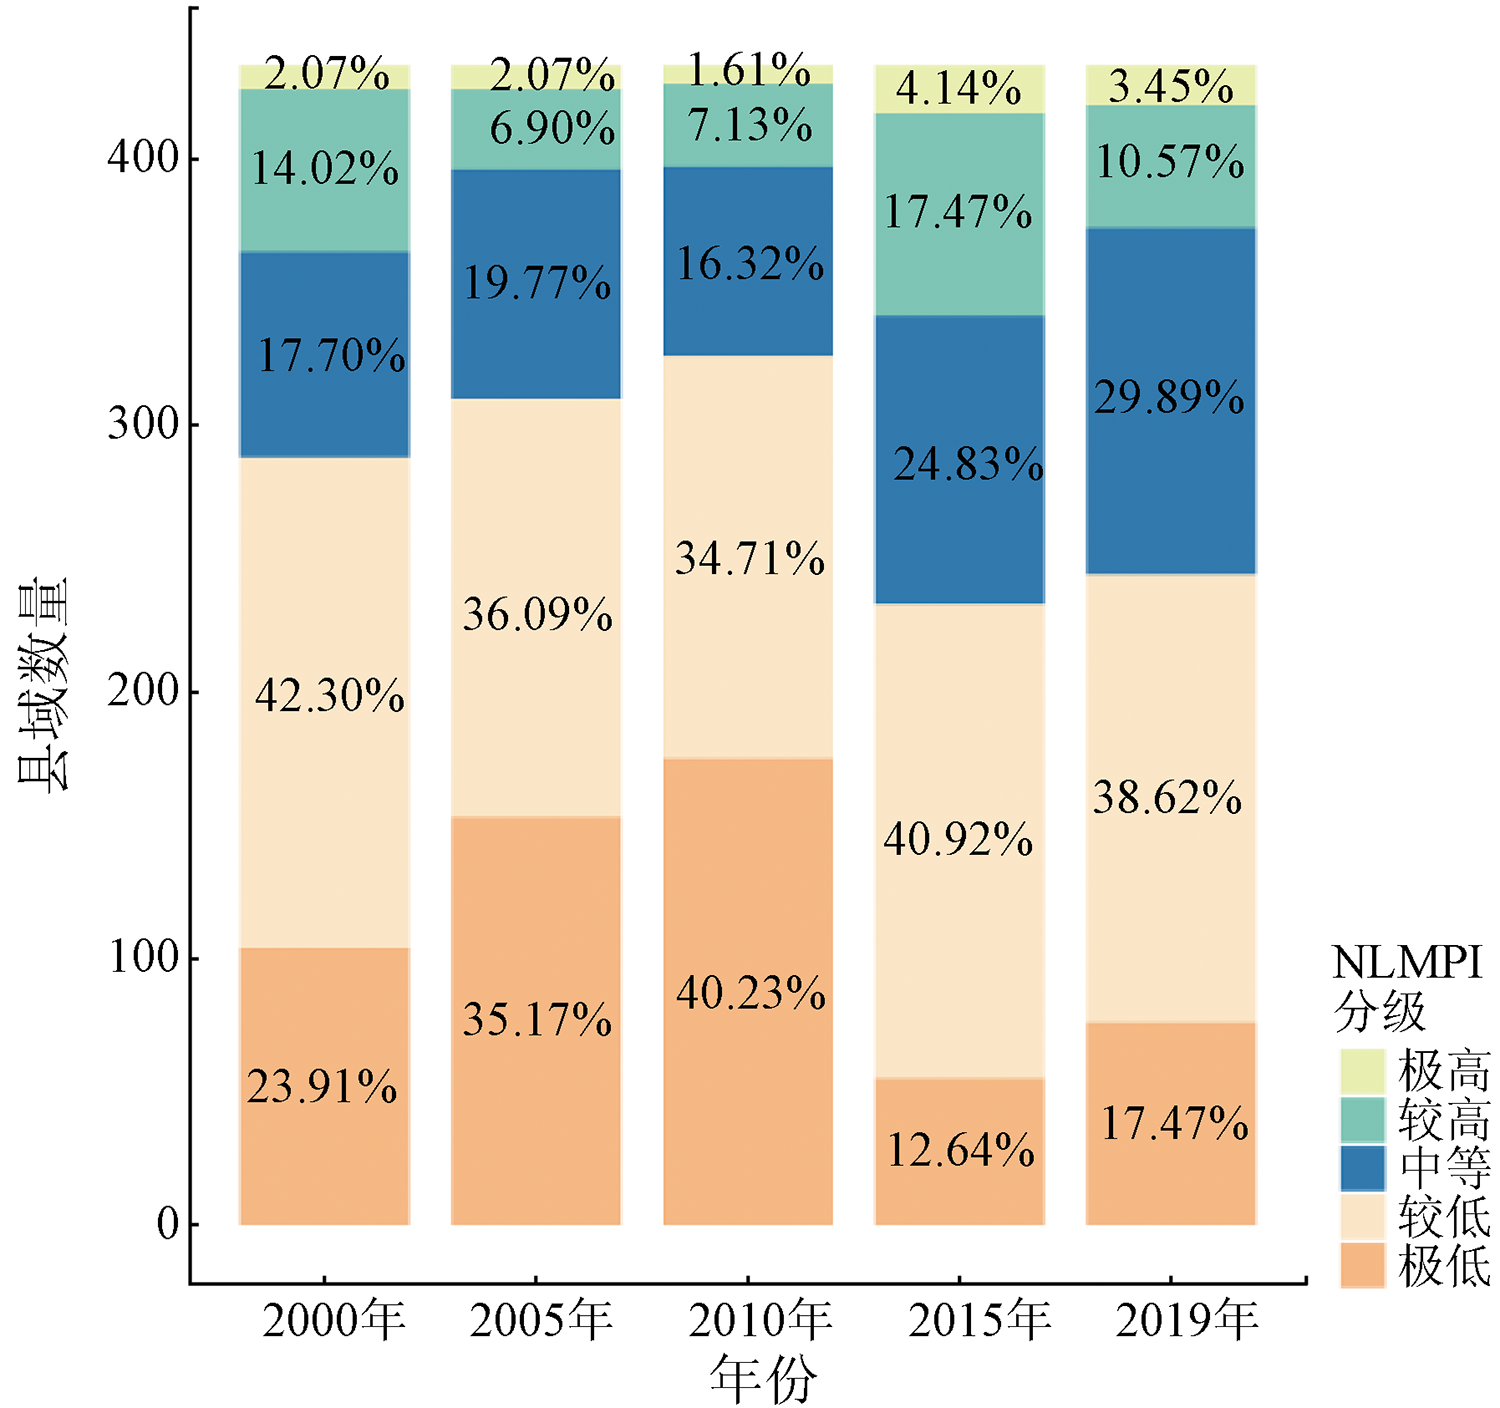
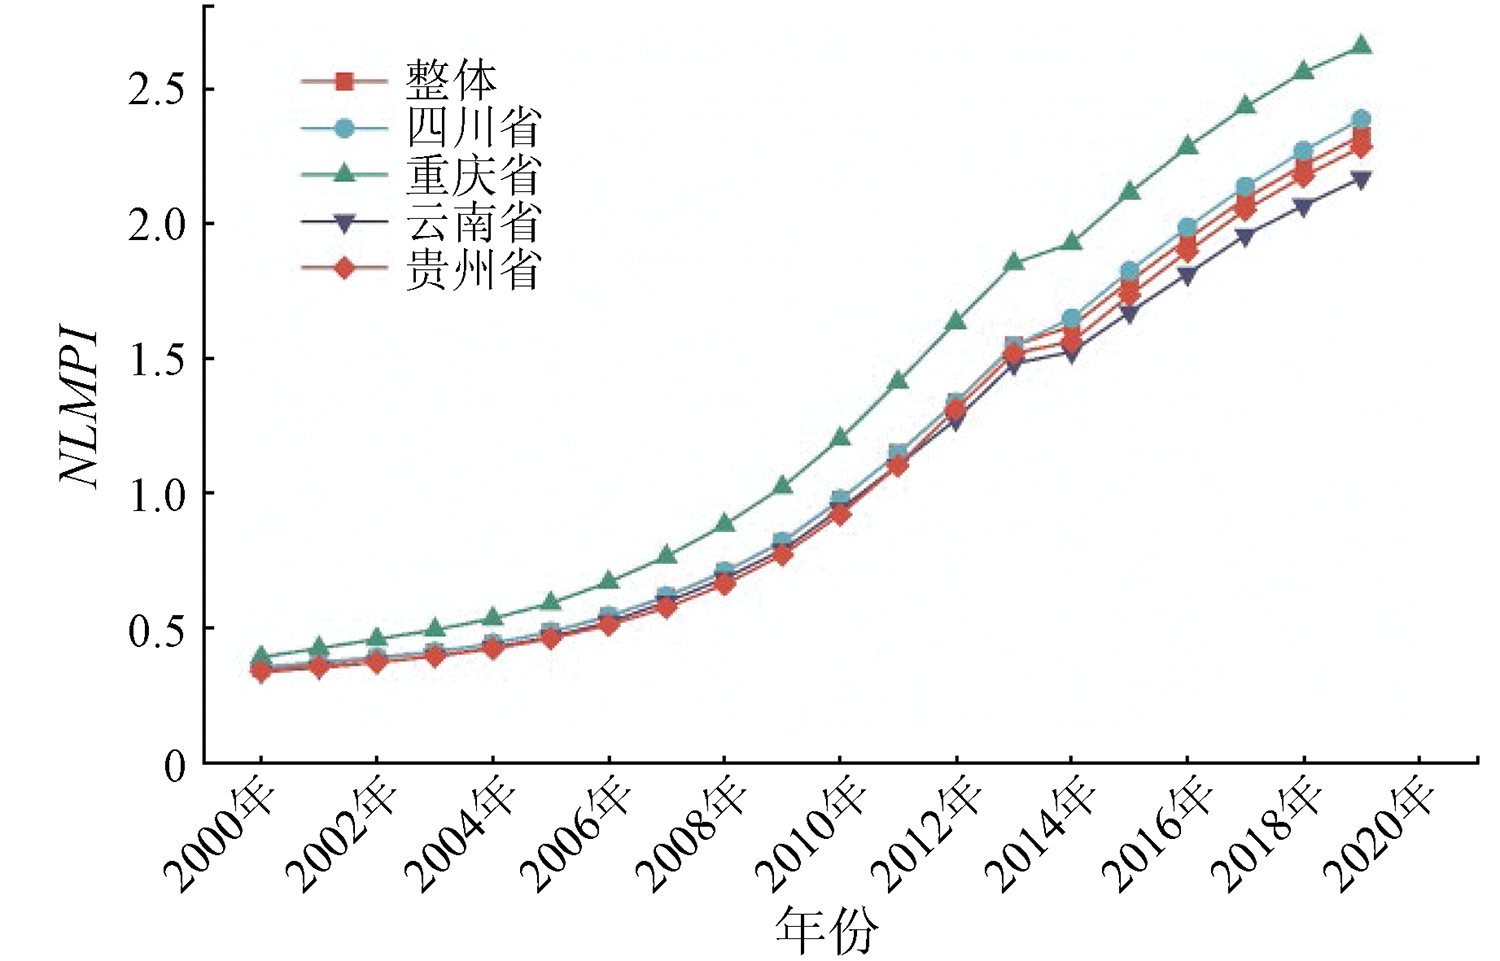
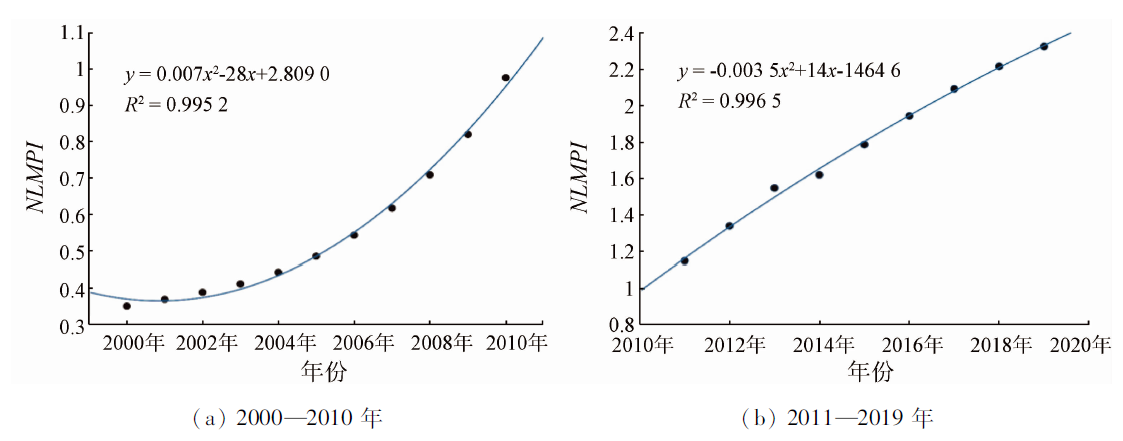
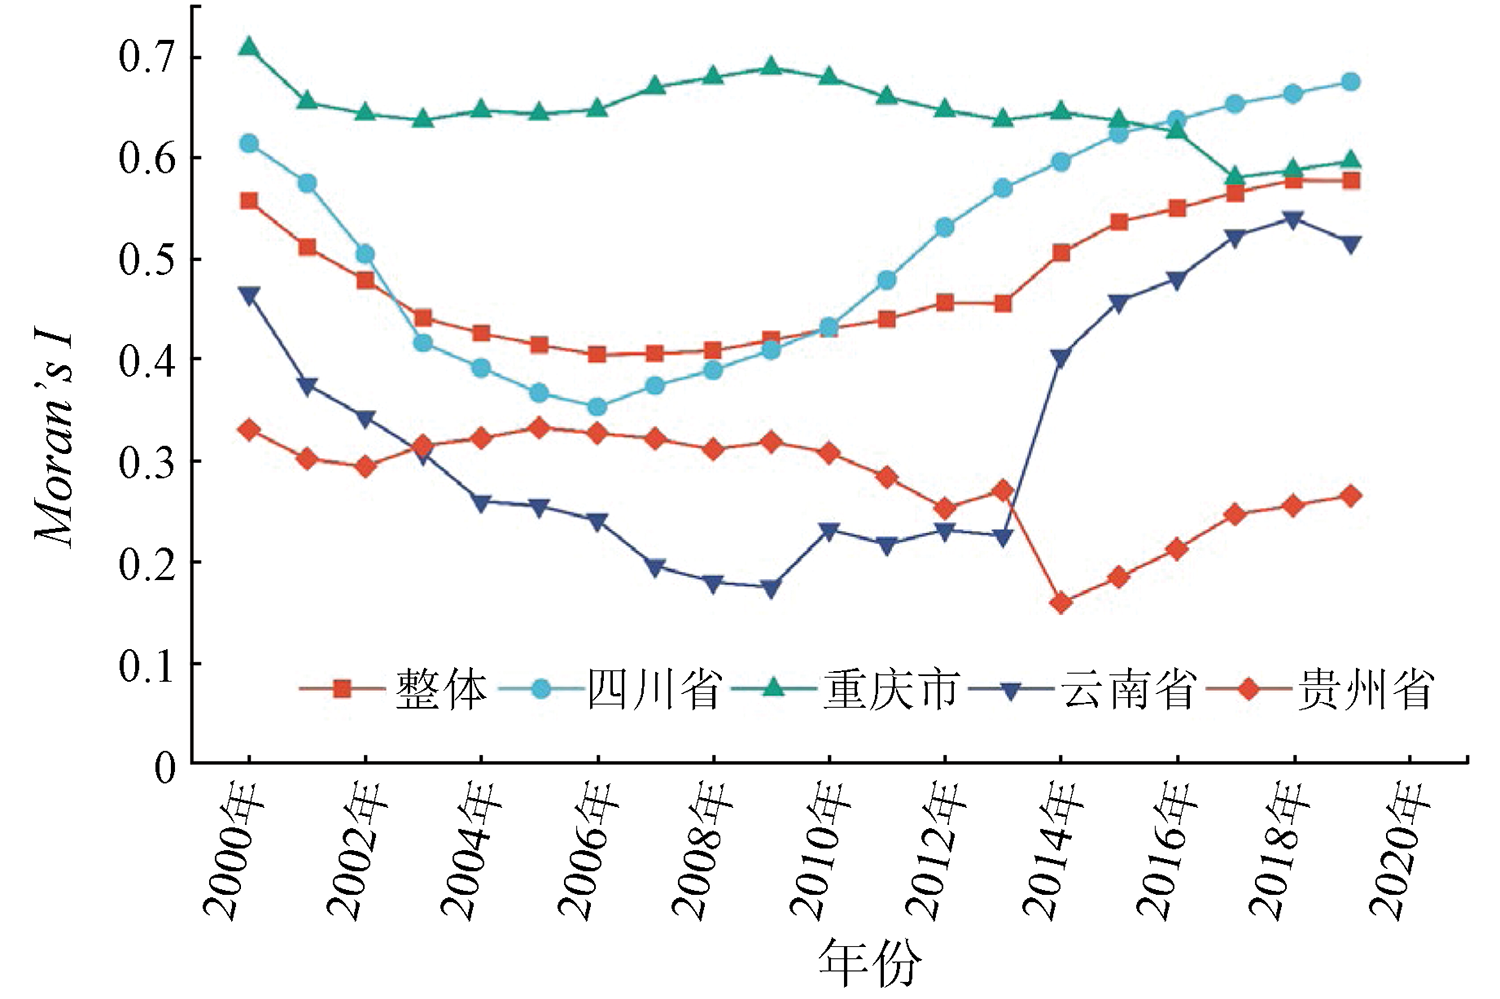
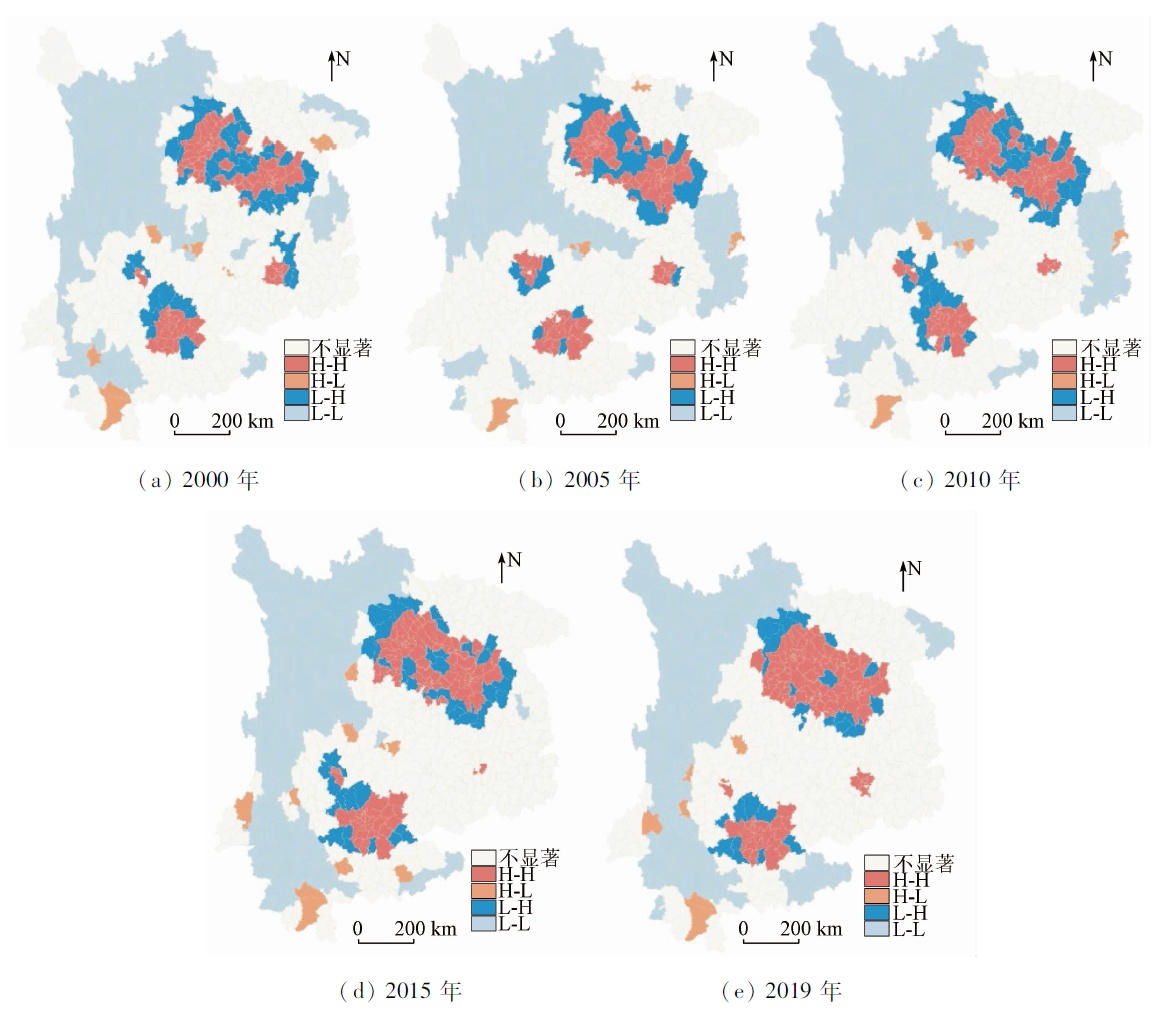
Abstract The overall regional poverty in China was eliminated in 2020, but the relative poverty in the country will still exist for a long time. Therefore, it is necessary to conduct a long-term measurement and development analysis of poverty in poverty-stricken areas. However, conventional measurement methods based on socio-economic data have severe limitations. With four provinces (municipalities) in southwestern China as a case study, this study built a back propagation (BP) neural network model based on the particle swarm optimization algorithm and a nighttime light (NTL) dataset of long time series from 2000 to 2019 first. Then, this study constructed the multi-dimensional poverty indices based on socio-economic and geographical data to reflect the poverty in counties. Finally, this study established a poverty measure model by combining the long-time-series NTL data with the multidimensional poverty indices and produced the nighttime light multidimensional poverty index (NLMPI). Based on the NLMPI, the measure and spatial-temporal evolution analysis of poverty in counties were carried out. The study results are as follows. The NLMPI indicates that the four provinces (municipalities) in southwestern China had significantly differentiated multidimensional poverty in 2000. However, the proportion of counties at extremely low and low levels decreased while that of moderate-level counties increased owing to the national poverty alleviation efforts. From 2000 to 2019, the NLMPI of counties in southwestern China showed a positive spatial autocorrelation and the Moran’s I index showed a downward and then an upward trend. These results indicate that poverty aggregation weakened from 2000 to 2010 and poverty alleviation dispersed thereafter in the four provinces (municipalities) in southwestern China. The local spatial autocorrelation results indicate that the multi-dimensional poverty pattern in southwestern China was alleviated but unbalanced. This pattern was reflected in the high NLMPI values surrounded by high NLMPI values (the H-H aggregation type) in Chengdu-Chongqing, Kunming, and Guiyang and in the low NLMPI values surrounded by low NLMPI values (the L-L aggregation type) in northwestern Sichuan and western Yunnan. This study highlights the application of NTL data in research on regional poverty.
|
| Keywords
nighttime light data
multi-dimensional poverty
poverty measure
spatial-temporal evolution
|
|
|
|
Issue Date: 27 December 2022
|
|
|
| [1] |
Steele J E, Sundsøy P R, Pezzulo C, et al. Mapping poverty using mobile phone and satellite data[J]. Journal of the Royal Society Interface, 2017, 14(127):20160690.
doi: 10.1098/rsif.2016.0690
url: https://royalsocietypublishing.org/doi/10.1098/rsif.2016.0690
|
| [2] |
刘彦随, 周扬, 刘继来. 中国农村贫困化地域分异特征及其精准扶贫策略[J]. 中国科学院院刊, 2016, 31(3):269-278.
|
| [2] |
Liu Y S, Zhou Y, Liu J L. Regional differentiation characteristics of rural poverty and targeted poverty alleviation strategy in China[J]. Bulletin of Chinese Academy of Sciences, 2016, 31(3):269-278.
|
| [3] |
周扬, 郭远智, 刘彦随. 中国县域贫困综合测度及2020年后减贫瞄准[J]. 地理学报, 2018, 73(8):1478-1493.
doi: 10.11821/dlxb201808007
|
| [3] |
Zhou Y, Guo Y Z, Liu Y S. Comprehensive measurement of county poverty and anti-poverty targeting after 2020 in China[J]. Acta Geographica Sinica, 2018, 73(8):1478-1493.
doi: 10.11821/dlxb201808007
|
| [4] |
Amis P, Rakodi C. Urban poverty:Concepts,characteristics and policies[J]. Habitat International, 1995, 19(4):403-405.
doi: 10.1016/0197-3975(95)00036-F
url: https://linkinghub.elsevier.com/retrieve/pii/019739759500036F
|
| [5] |
胡为安. 基于合成NPP-VIIRS年度数据的中国贫困地区发展状况研究[D]. 赣州: 江西理工大学, 2020.
|
| [5] |
Hu W A. Research on the development situation of poor regions in China based on synthetic NPP-VIIRS annual data[D]. Ganzhou: Jiangxi University of Science and Technology, 2020.
|
| [6] |
王武林, 余翠婵, 曾献君, 等. 东南沿海县域贫困度演变特征及驱动因素研究——以福建省为例[J]. 地理科学进展, 2020, 39(11):1860-1873.
doi: 10.18306/dlkxjz.2020.11.007
|
| [6] |
Wang W L, Yu C C, Zeng X J, et al. Evolution characteristics and driving factors of county poverty degree in China’s southeast coastal areas:A case study of Fujian Province[J]. Progress in Geography, 2020, 39(11):1860-1873.
|
| [7] |
郭熙保, 罗知. 论贫困概念的演进[J]. 江西社会科学, 2005(11):38-43.
|
| [7] |
Guo X B, Luo Z. Evolution of the concept of poverty[J]. Jiangxi Social Sciences, 2005(11):38-43.
|
| [8] |
胡蝶. 基于机器学习的贫困等级分类[D]. 武汉: 华中师范大学, 2019.
|
| [8] |
Hu D. Classification of poverty levels based on machine learning[D]. Wuhan: Central China Normal University, 2019.
|
| [9] |
Cheli B, Lemmi A. A totally fuzzy and relative approach to the multidimensional analysis of poverty[J]. Economic Notes, 1995, 24(1):115-134.
|
| [10] |
Bourguignon F, Chakravarty S R. The measurement of multidimensional poverty[M]. Smgapore: Poverty,Social Exclusion and Stochastic Dominance. Springer, 2019:83-107.
|
| [11] |
Lugo M, Maasoumi E. Multidimensional poverty measures from an information theory perspective[M]. Oxford Poverty and Human Development Initiative (OPHI), 2009.
|
| [12] |
Alkire S, Foster J. Counting and multidimensional poverty measurement[J]. Journal of Public Economics, 2011, 95(7-8):476-487.
doi: 10.1016/j.jpubeco.2010.11.006
url: https://linkinghub.elsevier.com/retrieve/pii/S0047272710001660
|
| [13] |
Noor A M, Alegana V A, Gething P W, et al. Using remotely sensed night-time light as a proxy for poverty in Africa[J]. Population Health Metrics, 2008, 6(1):5.
doi: 10.1186/1478-7954-6-5
url: https://pophealthmetrics.biomedcentral.com/articles/10.1186/1478-7954-6-5
|
| [14] |
Smith B, Wills S. Left in the dark? Oil and rural poverty[J]. Journal of the Association of Environmental and Resource Economists, 2018, 5(4):865-904.
doi: 10.1086/698512
url: https://www.journals.uchicago.edu/doi/10.1086/698512
|
| [15] |
Elvidge C D, Sutton P C, Ghosh T, et al. A global poverty map derived from satellite data[J]. Computers and Geosciences, 2009, 35(8):1652-1660.
doi: 10.1016/j.cageo.2009.01.009
url: https://linkinghub.elsevier.com/retrieve/pii/S0098300409001253
|
| [16] |
Wang W, Cheng H, Zhang L. Poverty assessment using DMSP/OLS night-time light satellite imagery at a provincial scale in China[J]. Advances in Space Research, 2012, 49(8):1253-1264.
doi: 10.1016/j.asr.2012.01.025
url: https://linkinghub.elsevier.com/retrieve/pii/S0273117712000828
|
| [17] |
Li G, Chang L, Liu X, et al. Monitoring the spatiotemporal dynamics of poor counties in China:Implications for global sustainable development goals[J]. Journal of Cleaner Production, 2019, 227:392-404.
doi: 10.1016/j.jclepro.2019.04.135
url: https://linkinghub.elsevier.com/retrieve/pii/S0959652619312144
|
| [18] |
Han L, Zhang Q, Ma P, et al. The spatial distribution characteristics of a comprehensive drought risk index in southwestern China and underlying causes[J]. Theoretical and Applied Climatology, 2016, 124(3):517-528.
doi: 10.1007/s00704-015-1432-z
url: http://link.springer.com/10.1007/s00704-015-1432-z
|
| [19] |
Zhao J, Ji G, Yue Y, et al. Spatio-temporal dynamics of urban residential CO2 emissions and their driving forces in China using the integrated two nighttime light datasets[J]. Applied Energy, 2019, 235:612-624.
doi: 10.1016/j.apenergy.2018.09.180
url: https://linkinghub.elsevier.com/retrieve/pii/S0306261918314983
|
| [20] |
Sun Y, Zheng S, Wu Y, et al. Spatiotemporal variations of city-level carbon emissions in China during 2000—2017 using nighttime light data[J]. Remote Sensing, 2020, 12(18):2916.
doi: 10.3390/rs12182916
url: https://www.mdpi.com/2072-4292/12/18/2916
|
| [21] |
Wu J, He S, Peng J, et al. Intercalibration of DMSP-OLS night-time light data by the invariant region method[J]. International Journal of Remote Sensing, 2013, 34(20):7356-7368.
doi: 10.1080/01431161.2013.820365
url: https://www.tandfonline.com/doi/full/10.1080/01431161.2013.820365
|
| [22] |
Yue Y, Tian L, Yue Q, et al. Spatiotemporal variations in energy consumption and their influencing factors in China based on the integration of the DMSP-OLS and NPP-VIIRS nighttime light datasets[J]. Remote Sensing, 2020, 12(7):1151.
doi: 10.3390/rs12071151
url: https://www.mdpi.com/2072-4292/12/7/1151
|
| [23] |
Wu Y, Jiang M, Chang Z, et al. Does China’s urban development satisfy Zipf’s law? A multiscale perspective from the NPP-VIIRS nighttime light data[J]. International Journal of Environmental Research and Public Health, 2020, 17(4):1460.
doi: 10.3390/ijerph17041460
url: https://www.mdpi.com/1660-4601/17/4/1460
|
| [24] |
Li X, Zhou Y, Zhao M, et al. A harmonized global nighttime light dataset 1992—2018[J]. Scientific Data, 2020, 7(1):1-9.
doi: 10.1038/s41597-019-0340-y
url: https://doi.org/10.1038/s41597-019-0340-y
|
| [25] |
Elvidge C D, Ziskin D, Baugh K E, et al. A fifteen year record of global natural gas flaring derived from satellite data[J]. Energies, 2009, 2(3):595-622.
doi: 10.3390/en20300595
url: http://www.mdpi.com/1996-1073/2/3/595
|
| [26] |
Hall F G, Strebel D E, Nickeson J E, et al. Radiometric rectification:Toward a common radiometric response among multidate,multisensor images[J]. Remote Sensing of Environment, 1991, 35(1):11-27.
doi: 10.1016/0034-4257(91)90062-B
url: https://linkinghub.elsevier.com/retrieve/pii/003442579190062B
|
| [27] |
Ma J, Guo J, Ahmad S, et al. Constructing a new inter-calibration method for DMSP-OLS and NPP-VIIRS nighttime light[J]. Remote Sensing, 2020, 12(6):937.
doi: 10.3390/rs12060937
url: https://www.mdpi.com/2072-4292/12/6/937
|
| [28] |
Jeswani R, Kulshrestha A, Gupta P K, et al. Evaluation of the consistency of DMSP-OLS and SNPP-VIIRS night-time light datasets[J]. J Geomat, 2019, 13:98-105.
|
| [29] |
Gori M, Tesi A. On the problem of local minima in back propagation[J]. IEEE Transactions on Pattern Analysis and Machine Intelligence, 1992, 14(1):76-86.
doi: 10.1109/34.107014
url: http://ieeexplore.ieee.org/document/107014/
|
| [30] |
Zhang J R, Zhang J, Lok T M, et al. A hybrid particle swarm optimization-back-propagation algorithm for feedforward neural network training[J]. Applied Mathematics and Computation, 2007, 185(2):1026-1037.
doi: 10.1016/j.amc.2006.07.025
url: https://linkinghub.elsevier.com/retrieve/pii/S0096300306008277
|
| [31] |
Wang Y, Wang B. Multidimensional poverty measure and analysis:A case study from Hechi City,China[J]. SpringerPlus, 2016, 5(1):642.
doi: 10.1186/s40064-016-2192-7
url: http://springerplus.springeropen.com/articles/10.1186/s40064-016-2192-7
|
| [32] |
Li C, Yang W, Tang Q, et al. Detection of multidimensional poverty using Luojia 1-01 nighttime light imagery[J]. Journal of the Indian Society of Remote Sensing, 2020, 48(7):963-977.
doi: 10.1007/s12524-020-01126-3
url: https://doi.org/10.1007/s12524-020-01126-3
|
| [33] |
Alkire S, Foster J. Counting and multidimensional poverty measurement[J]. Journal of Public Economics, 2011, 95(7):476-487.
doi: 10.1016/j.jpubeco.2010.11.006
url: https://linkinghub.elsevier.com/retrieve/pii/S0047272710001660
|
| [34] |
Hu J, Zhang T, Xin X, et al. Income identification and long-term multidimensional poverty:An empirical analysis based on data from China household tracking survey[J]. On Economic Problems, 2019 (8):75-81,90.
|
| [35] |
Yin J, Qiu Y, Zhang B. Identification of poverty areas by remote sensing and machine learning:A case study in Guizhou,Southwest China[J]. ISPRS Int ernational Jounra Geo-Inf ormation, 2021, 10(1):11.
|
| [36] |
Yu B, Shi K, Hu Y, et al. Poverty evaluation using NPP-VIIRS nighttime light composite data at the county level in China[J]. IEEE Journal of Selected Topics in Applied Earth Observations Remote Sensing, 2017, 8(3):1217-1229.
doi: 10.1109/JSTARS.2015.2399416
url: https://ieeexplore.ieee.org/document/7044556/
|
|
Viewed |
|
|
|
Full text
|
|
|
|
|
Abstract
|
|
|
|
|
Cited |
|
|
|
|
| |
Shared |
|
|
|
|
| |
Discussed |
|
|
|
|
 2022,
Vol. 34
2022,
Vol. 34