|
|
 |
|

|
|
|
Urban expansion and carbon emission effect of the urban agglomeration in south-central Liaoning Province |
XING Zihan1,2( ), LI Xiaoyan1(), SHI Zhenyu1, GULINAER·Suoerdahan 1, WU Haitao3 ), LI Xiaoyan1(), SHI Zhenyu1, GULINAER·Suoerdahan 1, WU Haitao3 |
1. College of Earth Science, Jilin University, Changchun 130061, China
2. Key Laboratory of Wetland Ecology and Environment, Northeast Institute of Geography and Agroecology, Chinese Academy of Science, Changchun 130102, China
3. Guaizi Lake Weather Station of Inner Mongolia Autonomous Region, Alxa 735408, China |
|
|
|
|
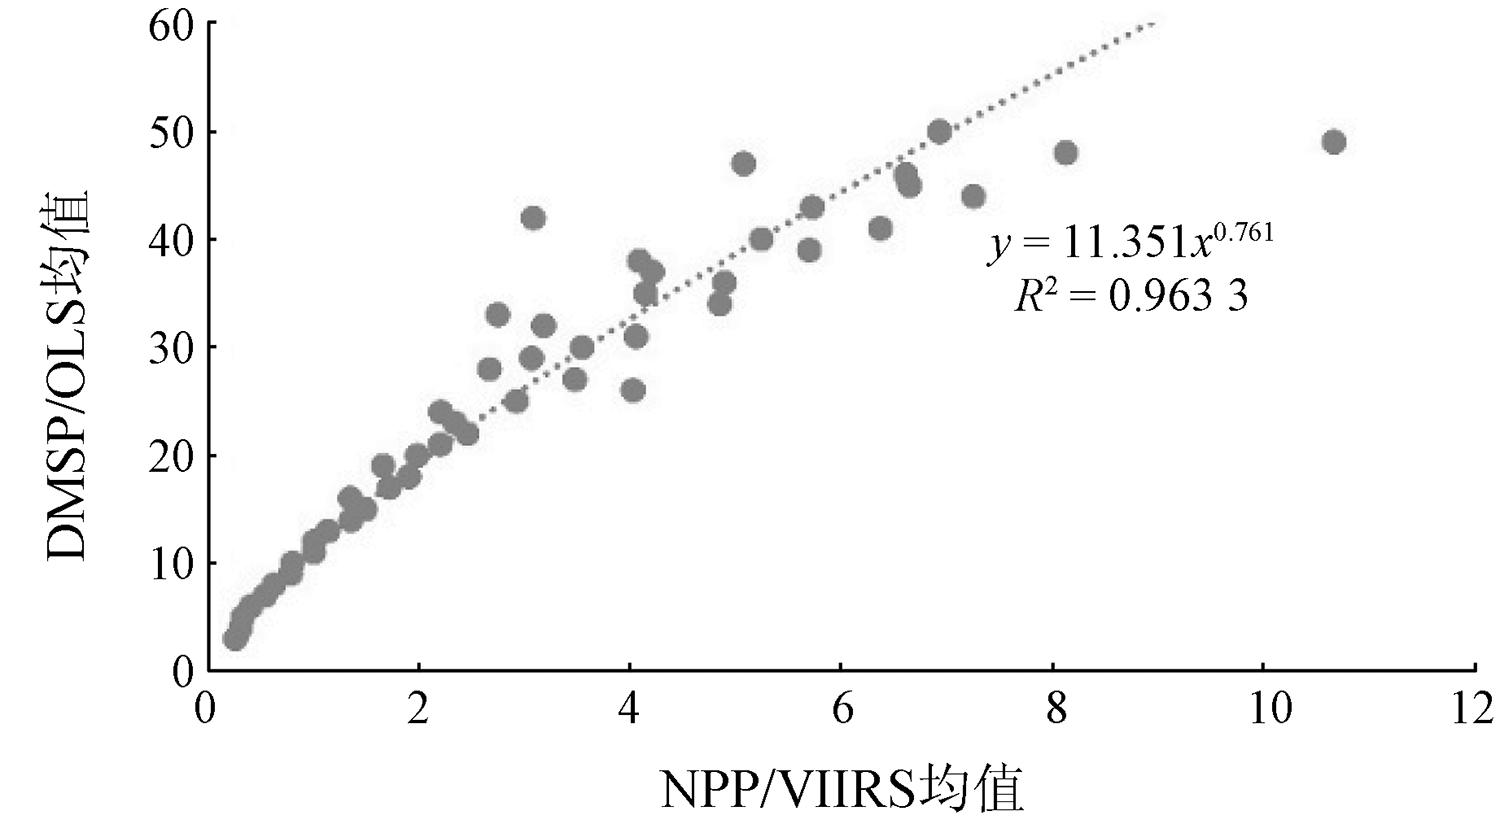
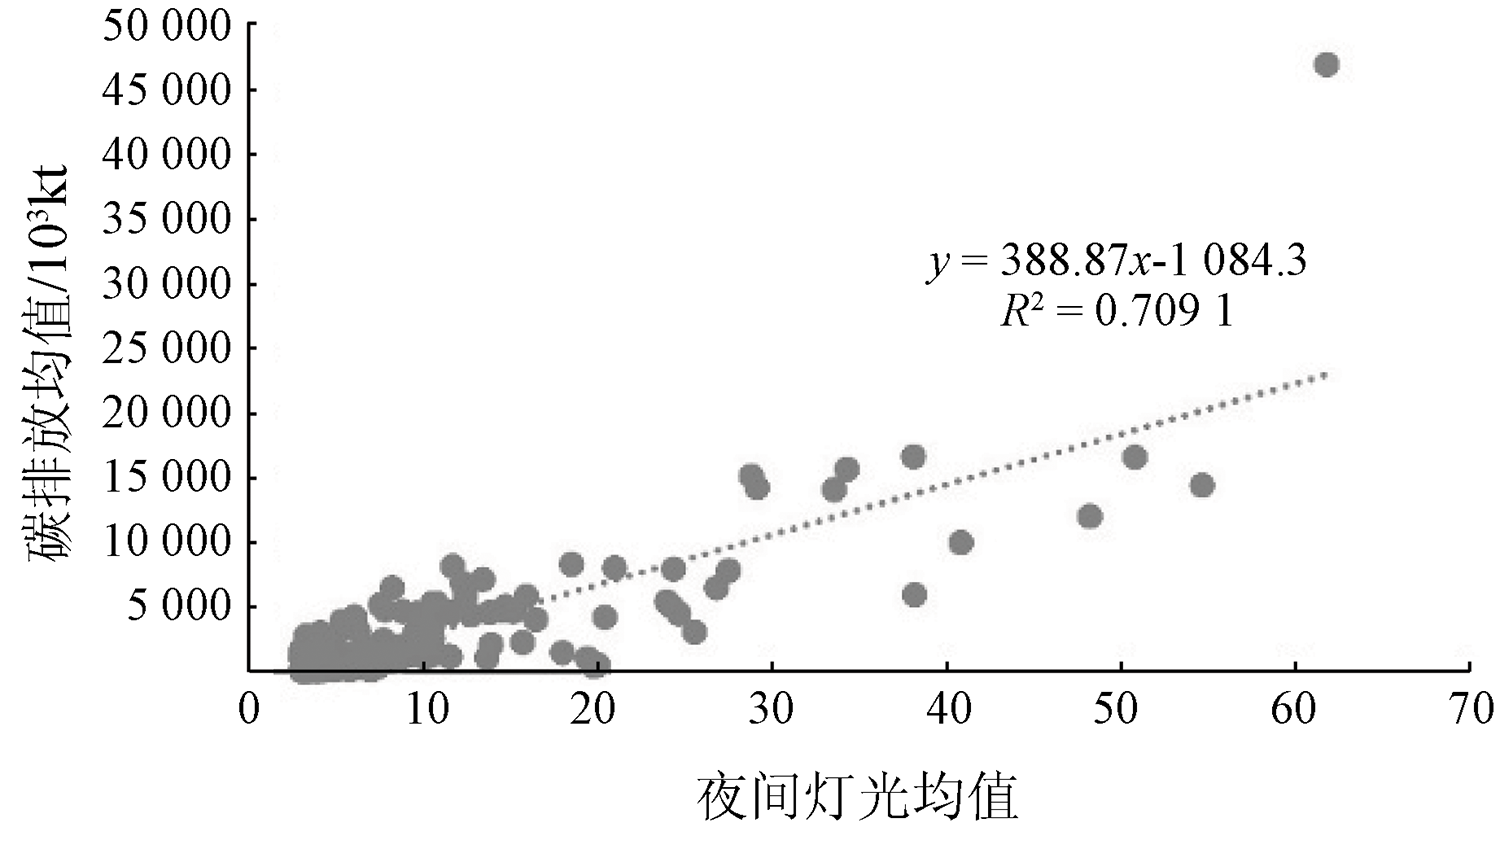
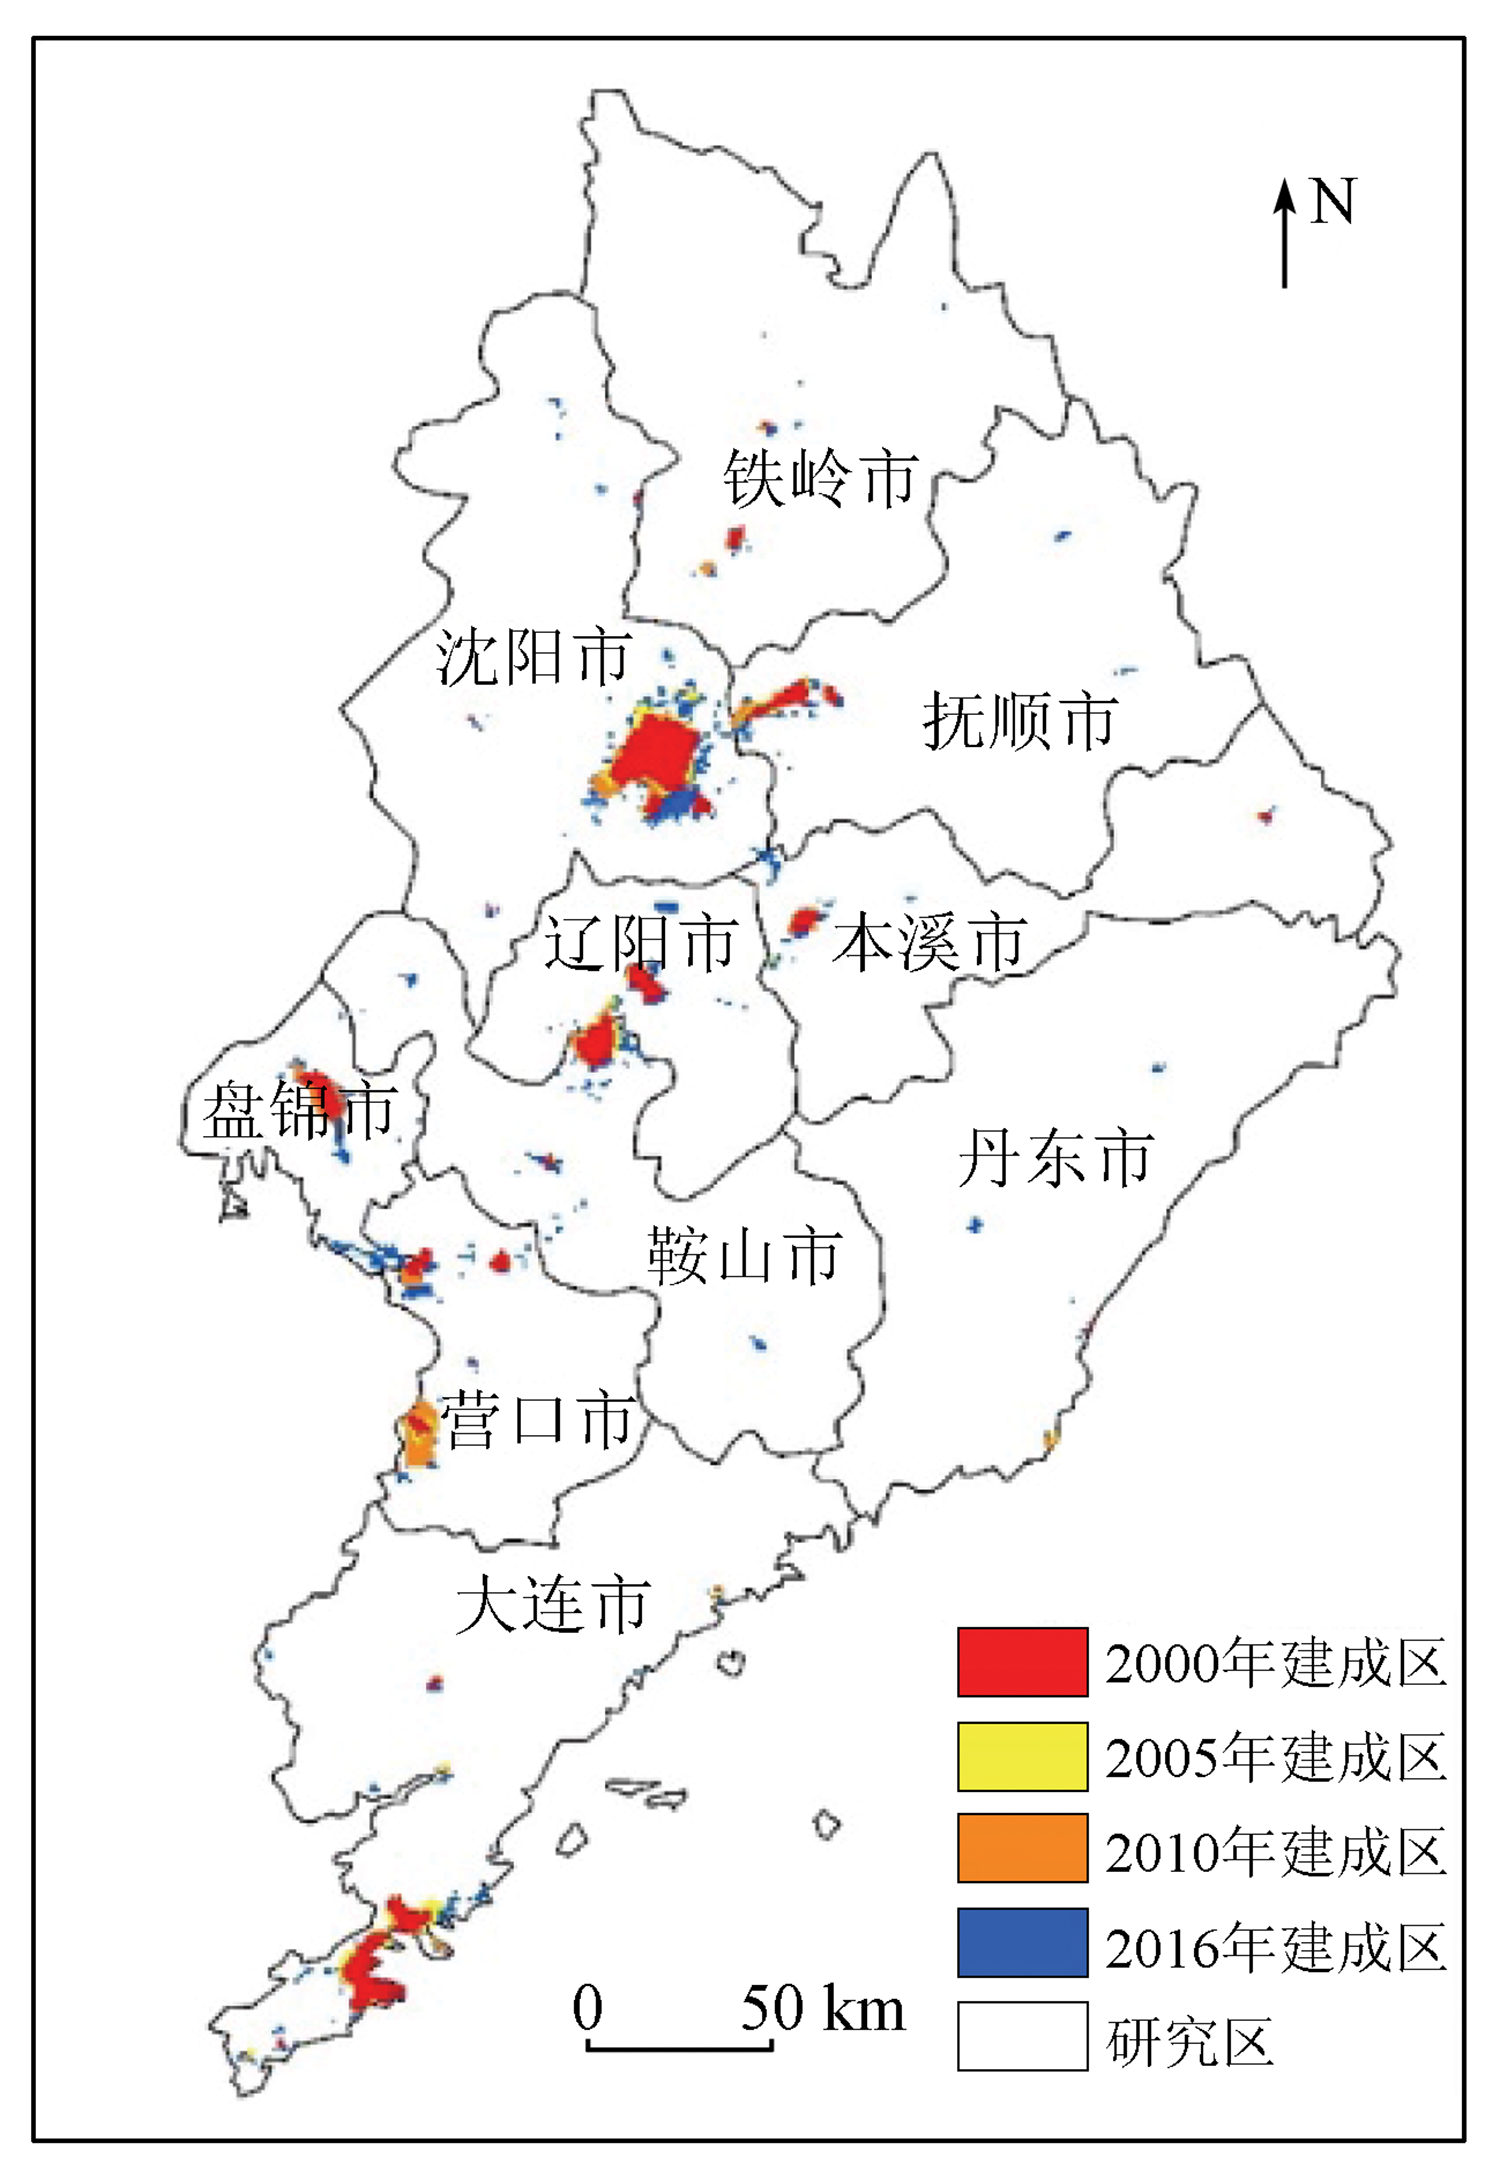
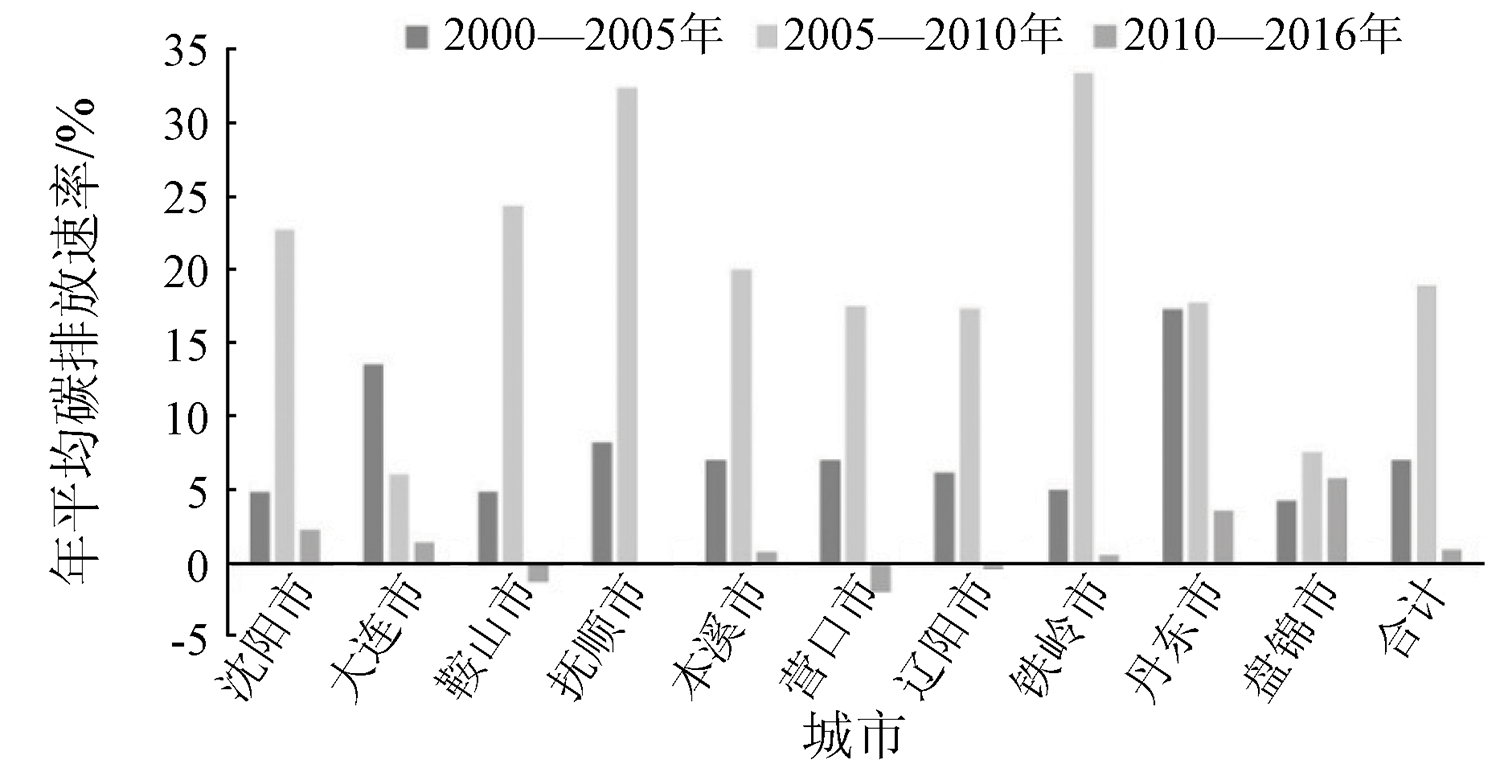
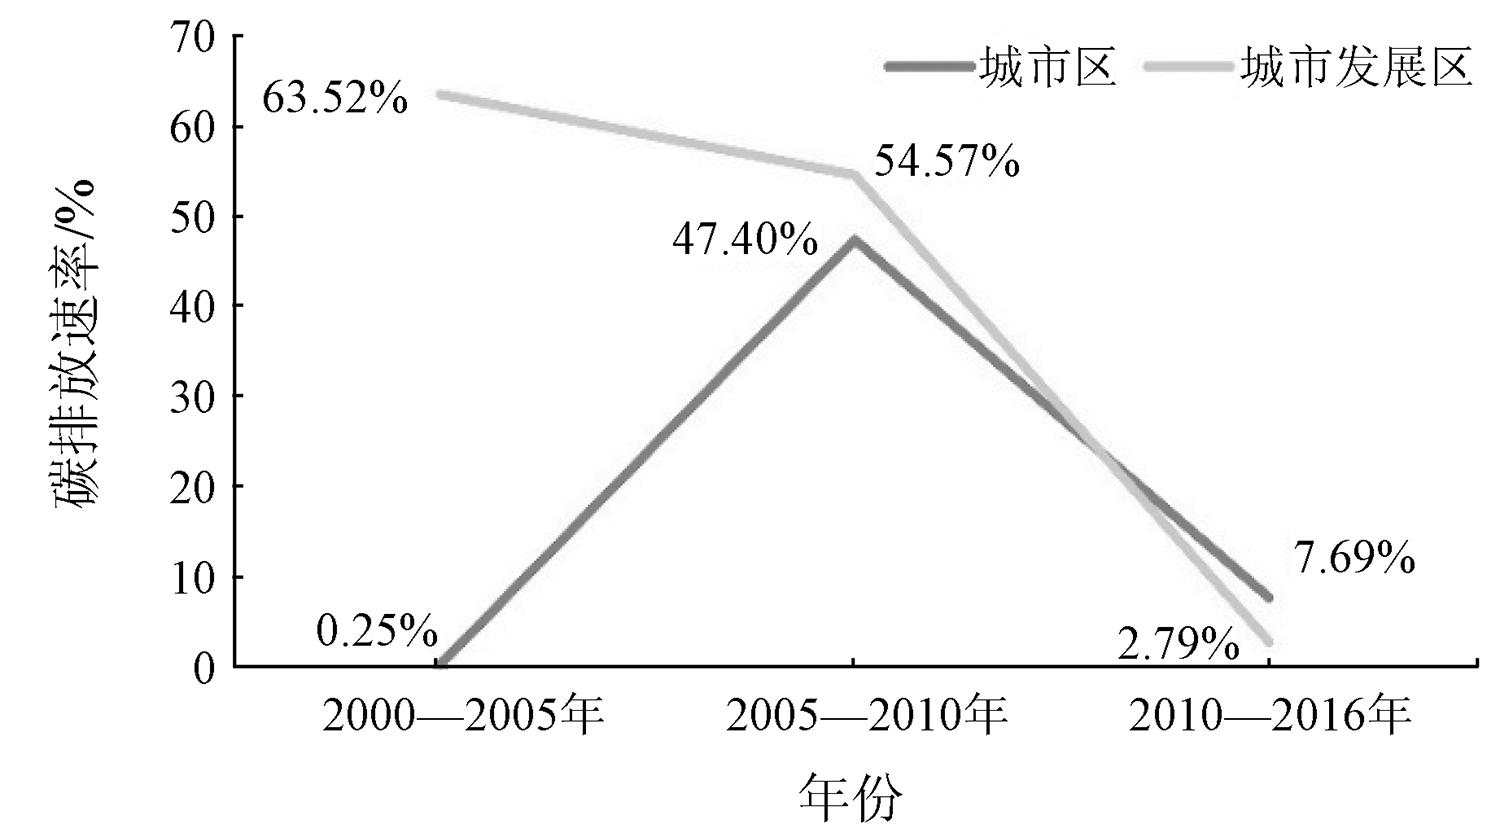
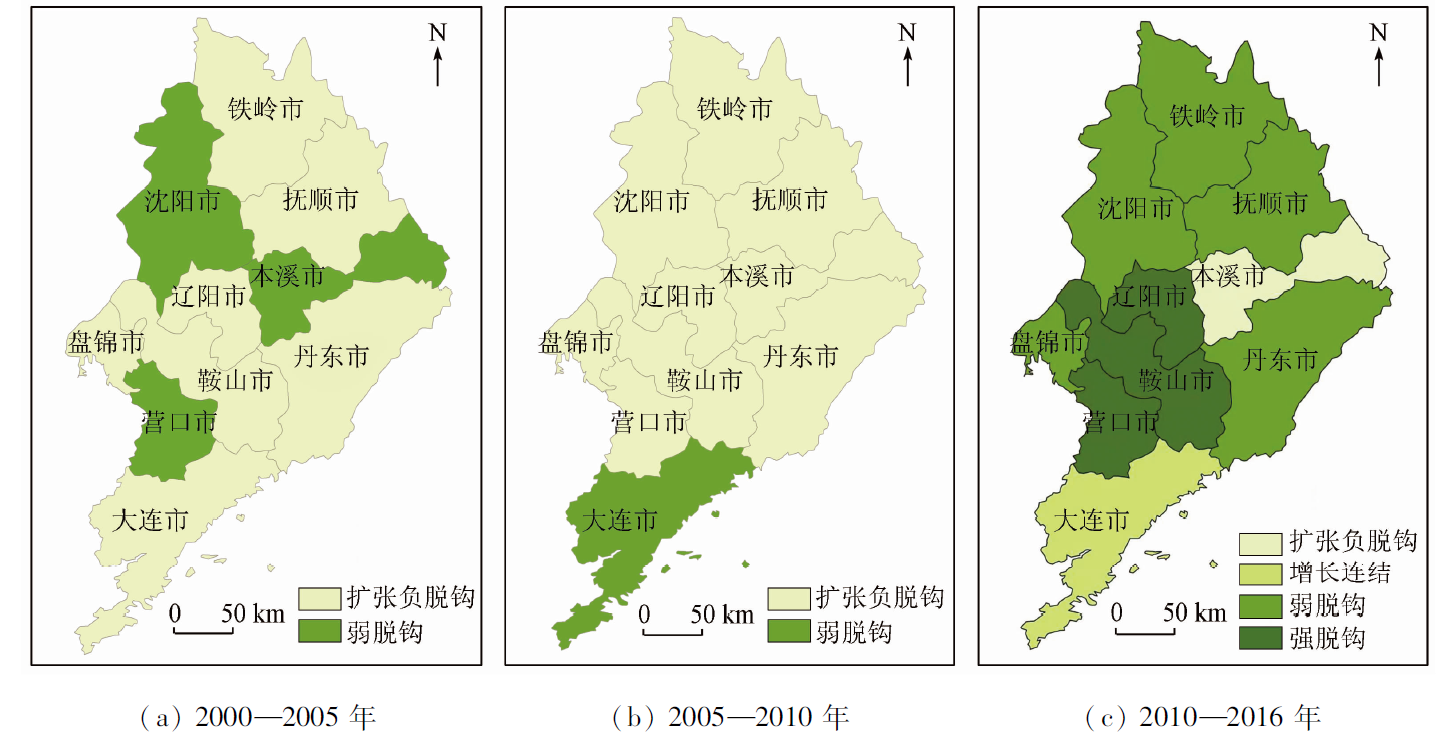
Abstract In this study, the urban expansion of the urban agglomeration in south-central Liaoning Province from 2000 to 2016 was analyzed using the nighttime light remote sensing data. The spatial relationship between urban expansion and carbon emission was quantitatively studied based on the carbon emission data. The spatial-temporal differences of carbon emissions in the study area were analyzed. Moreover, decoupling analysis was made targeting urban expansion index and carbon emissions. The results are as follows. The annual average expansion rate of the study area increased from 3.93% to 5.48%, with the expansion intensity increased from 0.211 to 0.525. The total carbon emission in the study area increased from 63.694 billion tons to 177.246 billion tons during 2000—2016. The annual average carbon emission rate increased from 7.02% to 18.96% and then decreased to 0.96%, experiencing a process from fast to slow. The average local carbon emission showed an increasing trend but varied greatly among cities. The urban expansion of the study area contributed to but also decoupled with carbon emission. The decoupling state changed from expansion negative decoupling to weak decoupling. By 2016, 80% of the cities in the study area had been in the decoupling state. The study results have significant implications for formulating future urban planning and energy conservation and emission reduction policies.
|
| Keywords
nighttime light data
urban expansion
carbon emissions
urban agglomeration in south-central Liaoning Province
|
|
|
|
Issue Date: 27 December 2022
|
|
|
| [1] |
Zhang D, Huang Q X, He H Y, et al. Impacts of urban expansion on ecosystem services in the Beijing-Tianjin-Hebei urban agglomeration,China:A scenario analysis based on the shared socioeconomic pathways[J]. Resources,Conservation and Recycling, 2017, 125:115-130.
doi: 10.1016/j.resconrec.2017.06.003
url: https://linkinghub.elsevier.com/retrieve/pii/S0921344917301568
|
| [2] |
马学广, 唐承辉. 新国家空间理论视角下城市群的国家空间选择性研究[J]. 人文地理, 2019, 34(2):105-115.
|
| [2] |
Ma X G, Tang C H. Study on state spatial selectivity of urban agglomeration from the perspective of new state space theory[J]. Human Geography, 2019, 34(2):105-115.
|
| [3] |
谷国锋, 李俏, 周伊楠. 东北地区城市群经济增长空间关联网络结构演变[J]. 地域研究与开发, 2020, 39(2):14-19.
|
| [3] |
Gu G F, Li Q, Zhou Y N. Evolution of economic growth spatial correlation network structure of urban agglomeration in northeast China[J]. Areal Research and Development, 2020, 39(2):14-19.
|
| [4] |
沈中健, 曾坚. 1996—2017年闽三角城市群区域热岛时空格局演化分析[J]. 安全与环境学报, 2020, 20(4):1567-1578.
|
| [4] |
Shen Z J, Zeng J. Analysis of spatiotemporal patterns and evolution of regional thermal islands in Fujian delta urban agglomeration during decade of 1996—2017[J]. Journal of Safety and Environment, 2020, 20(4):1567-1578.
|
| [5] |
Lin C Y, Chen W C, et al. Numerical study of the impact of urbanization on the precipitation over Taiwan[J]. Atmospheric Environment, 2008, 42:2934-2947.
doi: 10.1016/j.atmosenv.2007.12.054
url: https://linkinghub.elsevier.com/retrieve/pii/S1352231007011995
|
| [6] |
刘凯, 吴怡, 王晓瑜, 等. 中国城市群空间结构对大气污染的影响[J]. 中国人口·资源与环境, 2020, 30(10):28-35.
|
| [6] |
Liu K, Wu Y, Wang X Y, et al. Impact of spatial structure of urban agglomerations on air pollution in China[J]. China Population,Resources and Environment, 2020, 30(10):28-35.
|
| [7] |
范峻恺, 徐建刚. 基于神经网络综合建模的区域城市群发展脆弱性评价——以滇中城市群为例[J]. 自然资源学报, 2020, 35(12):2875-2887.
|
| [7] |
Fan J K, Xu J G. Vulnerability assessment of urban agglomeration based on neural network model: A case study of central Yunnan urban agglomeration[J]. Journal of Natural Resources, 2020, 35(12):2875-2887.
doi: 10.31497/zrzyxb.20201205
url: http://www.jnr.ac.cn/EN/10.31497/zrzyxb.20201205
|
| [8] |
Mvungi A, Hranova R K, Love D J. Impact of home industries on water quality in a tributary of the Marimba River,Harare:Implications for urban water management[J]. Physics and Chemistry of the Earth, 2003, 28:1131-1137.
|
| [9] |
Chang H J. Spatial and temporal variations of water quality in the Han River and its tributaries[J]. Water,Air and Soil Pollution, 2005, 161:267-284.
doi: 10.1007/s11270-005-4286-7
url: http://link.springer.com/10.1007/s11270-005-4286-7
|
| [10] |
Yoshimura C O T, Furumai H, Tockner K. Present state of rivers and streams in Japan[J]. River Research and Applications, 2005, 21 (23):93-112.
doi: 10.1002/rra.835
url: https://onlinelibrary.wiley.com/doi/10.1002/rra.835
|
| [11] |
郭岫垚. 辽宁省碳排放效率时空演变及影响因素研究[D]. 大连: 辽宁师范大学, 2021.
|
| [11] |
Guo X Y. Research on spatial-temporal evolution and influencing factors of carbon emission efficiency in Liaoning Province[D]. Dalian: Liaoning Normal University, 2021.
|
| [12] |
武俊奎, 姜惠敏, 王桂新. 城市规模扩张对碳排放的影响机制研究——基于产业集聚的视角[J]. 产经评论, 2012, 7(4):23-35.
|
| [12] |
Wu J K, Jiang H M, Wang G X. Study on the effect of urban sprawl on carbon emission: Based on industry agglomeration[J]. Industrial Economic Review, 2012, 7(4):23-35.
|
| [13] |
洪银兴, 王振, 曾刚, 等. 长三角一体化新趋势[J]. 上海经济, 2018(3):122-148.
|
| [13] |
Hong Y X, Wang Z, Zeng G, et al. Commentary on the new trend of the integration of the Yangtze River Delta[J]. Shanghai Economy, 2018(3):122-148.
|
| [14] |
李欣欣. 基于夜间灯光数据的辽中南城市群城市空间扩张分析与监测研究[D]. 大连: 辽宁师范大学, 2018.
|
| [14] |
Li X X. The research on characteristics of urban spatial expansion of central and southern Liaoning Province urban agglomeration based on nighttime lights data[D]. Dalian: Liaoning Normal University, 2018.
|
| [15] |
王雨枫, 曹洪军. 哈长—辽中南城市群扩张时空特征及驱动因素[J]. 东北大学学报(自然科学版), 2021, 42(5):755-760.
|
| [15] |
Wang Y F, Cao H J. Spatial-temporal characteristics and driving factors for urban agglomeration in Harbin-Changchun and Central-Southern Liaoning Province[J]. Journal of Northeastern University(Natural Science), 2021, 42(5):755-760.
|
| [16] |
任晓燕, 何艳芬, 王宗明. 基于遥感的辽中南城市群建设用地扩张及其占用耕地的时空特征[J]. 国土资源遥感, 2020, 32(3):98-105.doi:10.6046/gtzyyg.2020.03.13.
doi: 10.6046/gtzyyg.2020.03.13
|
| [16] |
Ren X Y, He Y F, Wang Z M. Spatial-temporal characteristics of construction land expansion and occupation of cultivated land in urban agglomeration of central and southern Liaoning Province based on remote sensing[J]. Remote Sensing for Land and Resources, 2020, 32(3):98-105.doi:10.6046/gtzyyg.2020.03.13.
doi: 10.6046/gtzyyg.2020.03.13
|
| [17] |
曹子阳, 吴志峰, 匡耀求, 等. DMSP/OLS夜间灯光影像中国区域的校正及应用[J]. 地球信息科学, 2015, 17(9):1092-1102.
|
| [17] |
Cao Z Y, Wu Z F, Kuang Y Q, et al. Correction of DMSP/OLS night-time light images and its application in China[J]. Journal of Geo-Information Science, 2015, 17(9):1092-1102.
|
| [18] |
李雪萍, 贡璐. DMSP/OLS和VIIRS/DNB夜间灯光影像的校正及拟合[J]. 测绘通报, 2019, 7:138-146.
|
| [18] |
Li X P, Gong L. Correction and fitting of night light images of DMSP/OLS and VIIRS/DNB[J]. Bulletin of Surveying and Mapping, 2019, 7: 138-146.
|
| [19] |
杨任飞. 基于DMSP/OLS与NPP/VIIRS整合数据的城市群发育过程研究——以长江经济带主要城市群为例[D]. 重庆: 西南大学, 2018.
|
| [19] |
Yang R F. Integrating DMSP/OLS & NPP/VIIRS lighttime light data to the application research of urban agglomeration growth process:A case study of the main urban agglomerations of Yangtze River economic zone[D]. Chongqing: Southwest University, 2018.
|
| [20] |
高宁, 盖迎春, 宋晓谕. 基于夜间灯光数据的西安市城市扩张及驱动因素研究[J]. 遥感技术与应用, 2019, 34(1):207-215.
|
| [20] |
Gao N, Gai Y C, Song X Y. Study of urban expansion and driving factors in Xi’an City based on nighttime light data[J]. Remote Sensing Technology and Application, 2019, 34(1):207-215.
|
| [21] |
周嘉, 王钰萱, 刘学荣, 等. 基于土地利用变化的中国省域碳排放时空差异及碳补偿研究[J]. 地理科学, 2019, 39(12):1955-1961.
doi: 10.13249/j.cnki.sgs.2019.12.014
|
| [21] |
Zhou J, Wang Y X, Liu X R, et al. Spatial temporal differences of carbon emissions and carbon compensation in China based on land use change[J]. Scientia Geographica Sinica, 2019, 39(12):1955-1961.
doi: 10.13249/j.cnki.sgs.2019.12.014
|
| [22] |
王志远, 廖建军, 陈祖展, 等. 城市用地空间扩张与碳排放的相关效应研究——以长沙市为例[J]. 南华大学学报(自然科学版), 2013, 27(2):82-88.
|
| [22] |
Wang Z Y, Liao J J, Chen Z Z, et al. Study of city land expansion and carbon emission correlation effect:Taking Changsha City as an example[J]. Journal of University of South China(Science and Technology), 2013, 27(2):82-88.
|
| [23] |
舒心, 夏楚瑜, 李艳, 等. 长三角城市群碳排放与城市用地增长及形态的关系[J]. 生态学报, 2018, 38(17):6302-6313.
|
| [23] |
Shu X, Xia C Y, Li Y, et al. Relationships between carbon emission,urban growth,and urban forms of urban agglomeration in the Yangtze River Delta[J]. Acta Ecologica Sinica, 2018, 38(17):6302-6313.
|
|
Viewed |
|
|
|
Full text
|
|
|
|
|
Abstract
|
|
|
|
|
Cited |
|
|
|
|
| |
Shared |
|
|
|
|
| |
Discussed |
|
|
|
|
 2022,
Vol. 34
2022,
Vol. 34