|
|
 |
|

|
|
|
Exploring the performance of riparian zones in reducing non-point source pollution by coupling remote sensing with the SWAT model |
LIU Yiyao1( ), WU Taixia1(), WANG Shudong2, JU Maosen3 ), WU Taixia1(), WANG Shudong2, JU Maosen3 |
1. School of Earth Sciences and Engineering, Hohai University, Nanjing 211100, China
2. Aerospace Information Research Institute, Chinese Academy of Sciences, Beijing 100000, China
3. Research and Training Center for River Chief System, Hohai University, Nanjing 210098, China |
|
|
|
|
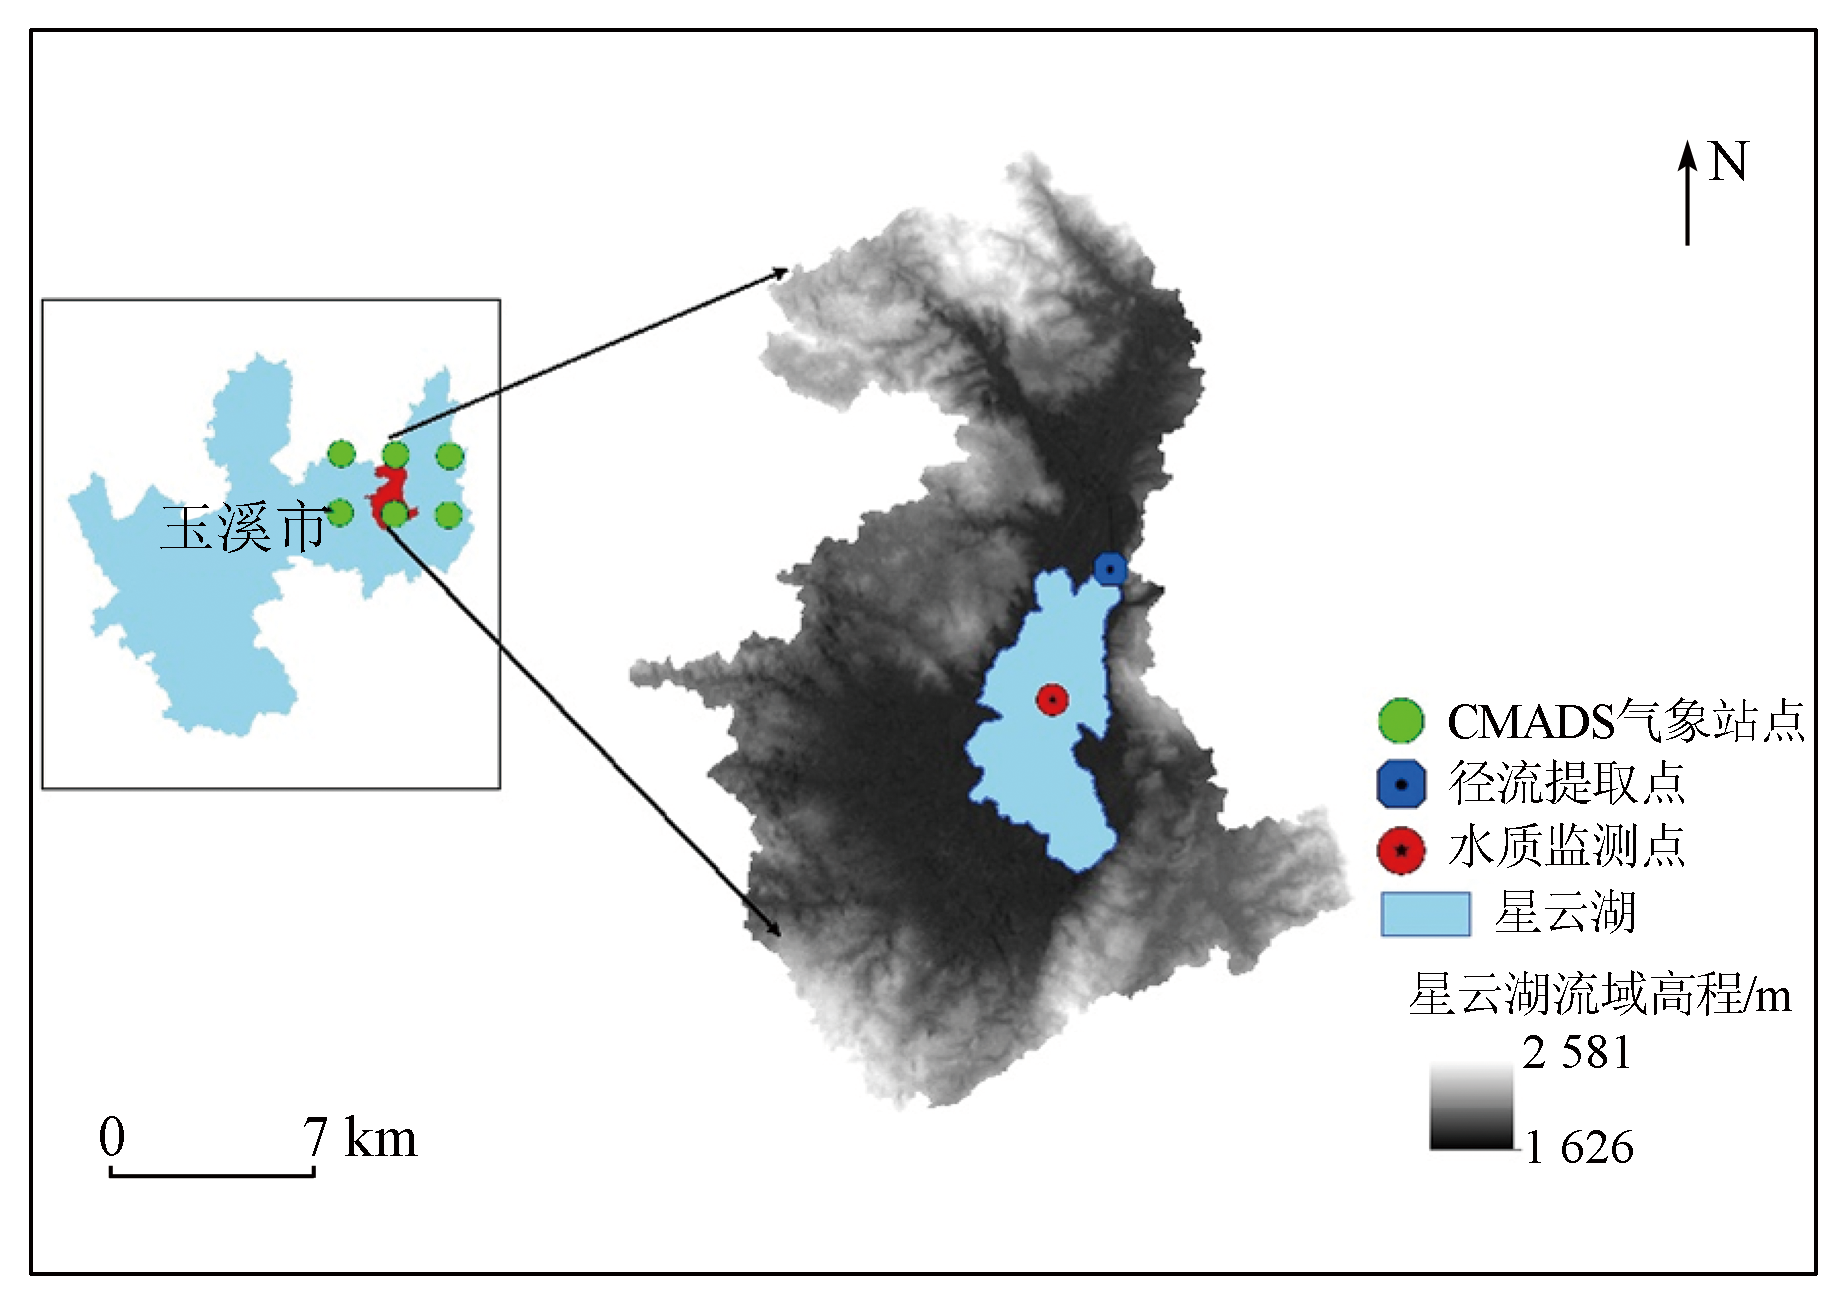
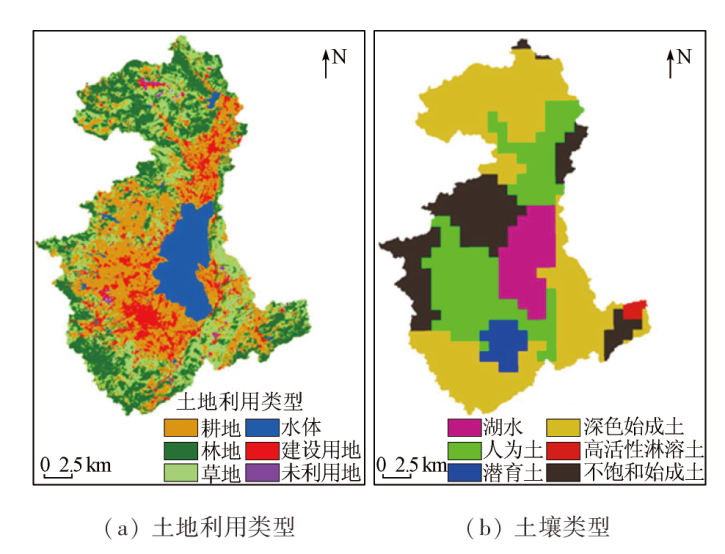
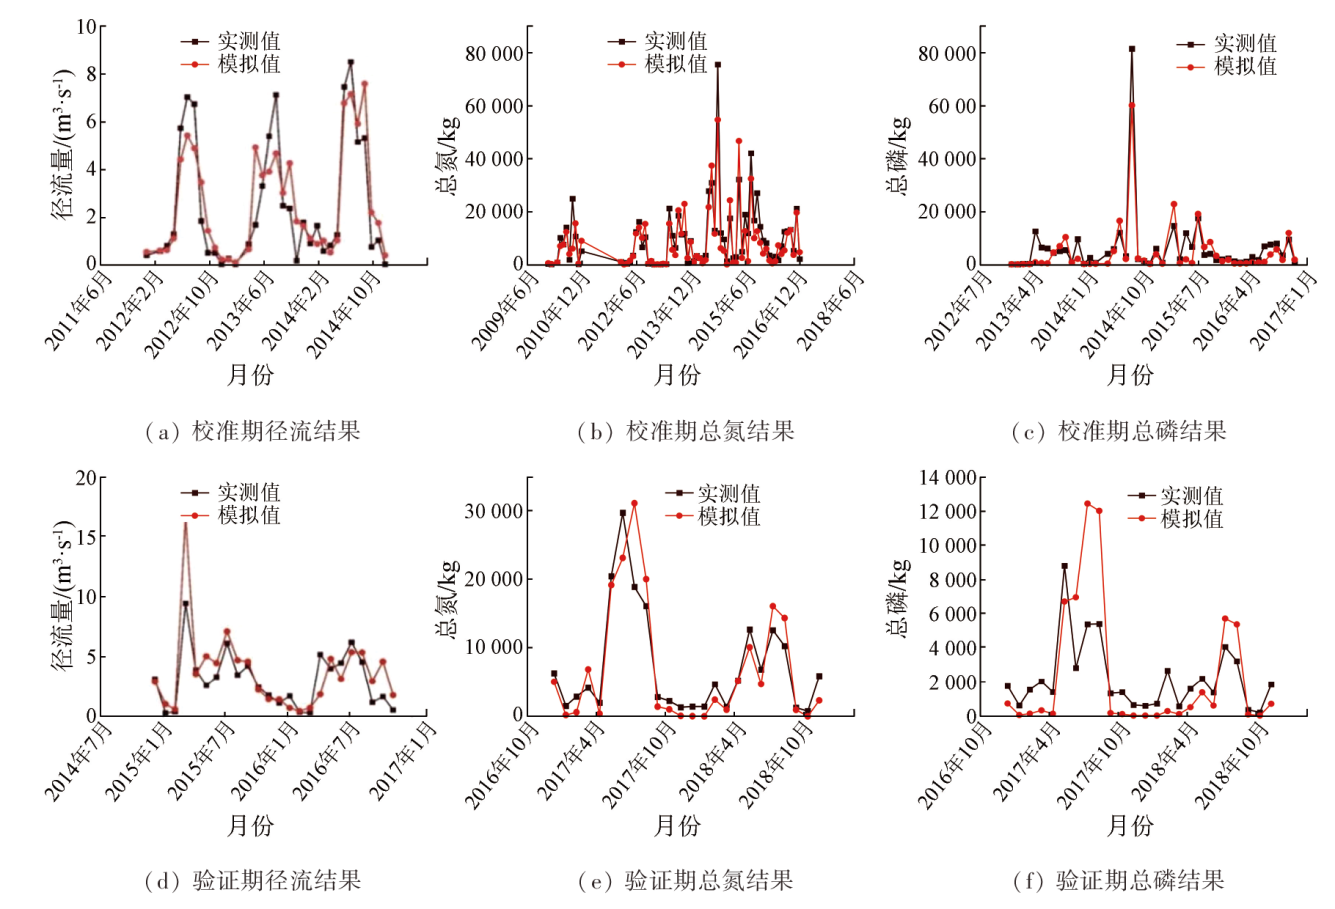
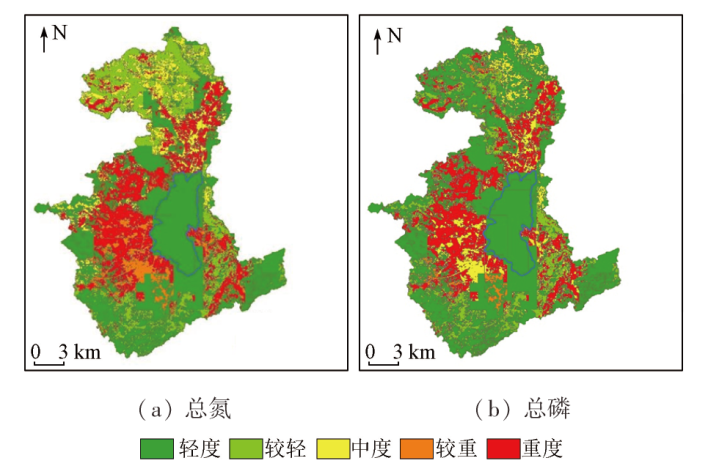
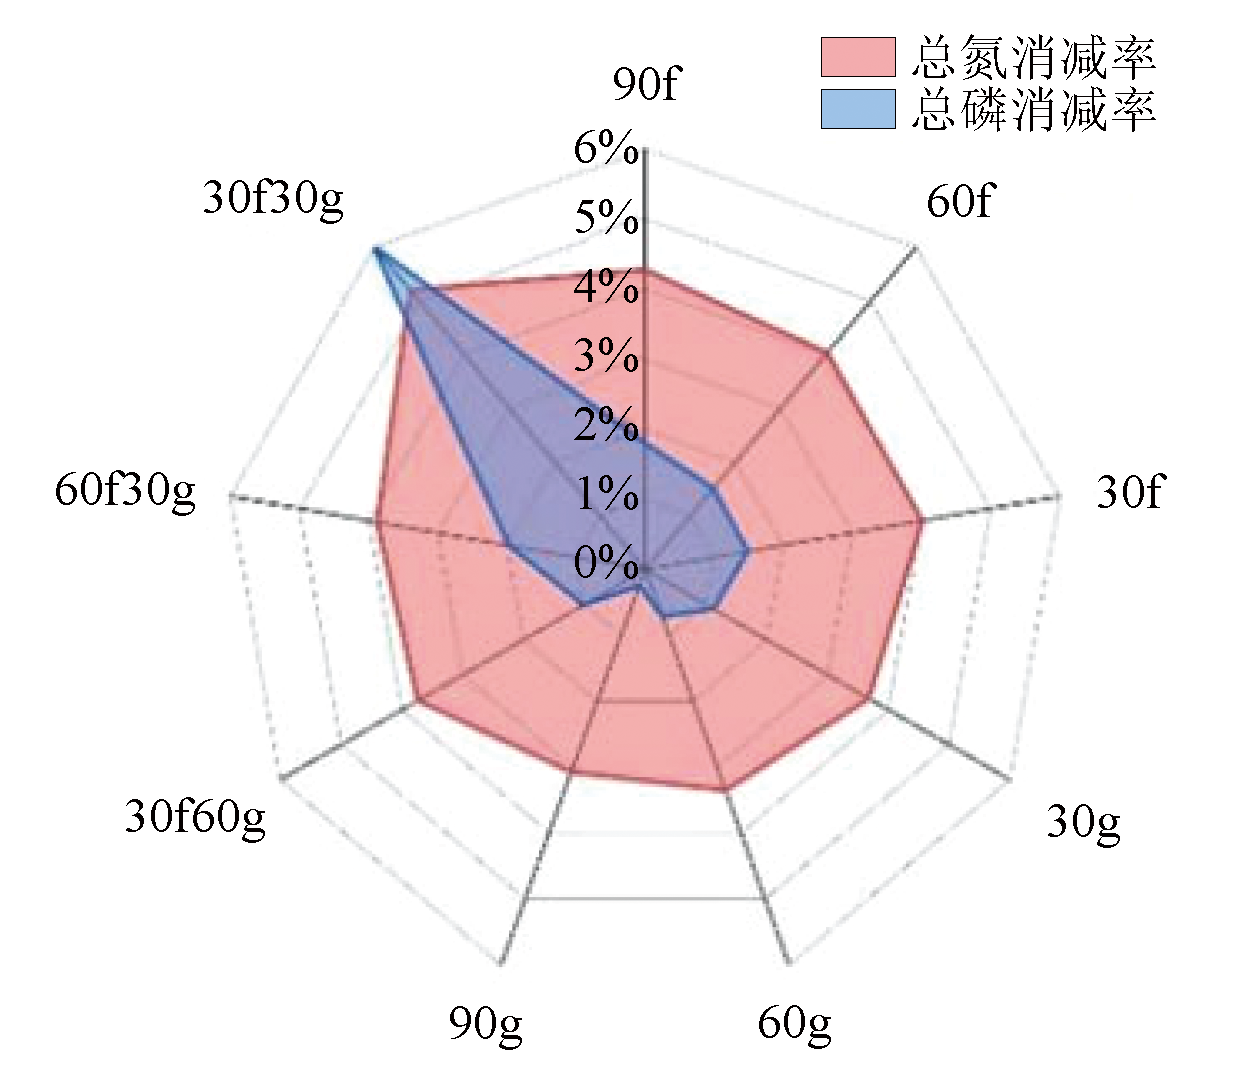
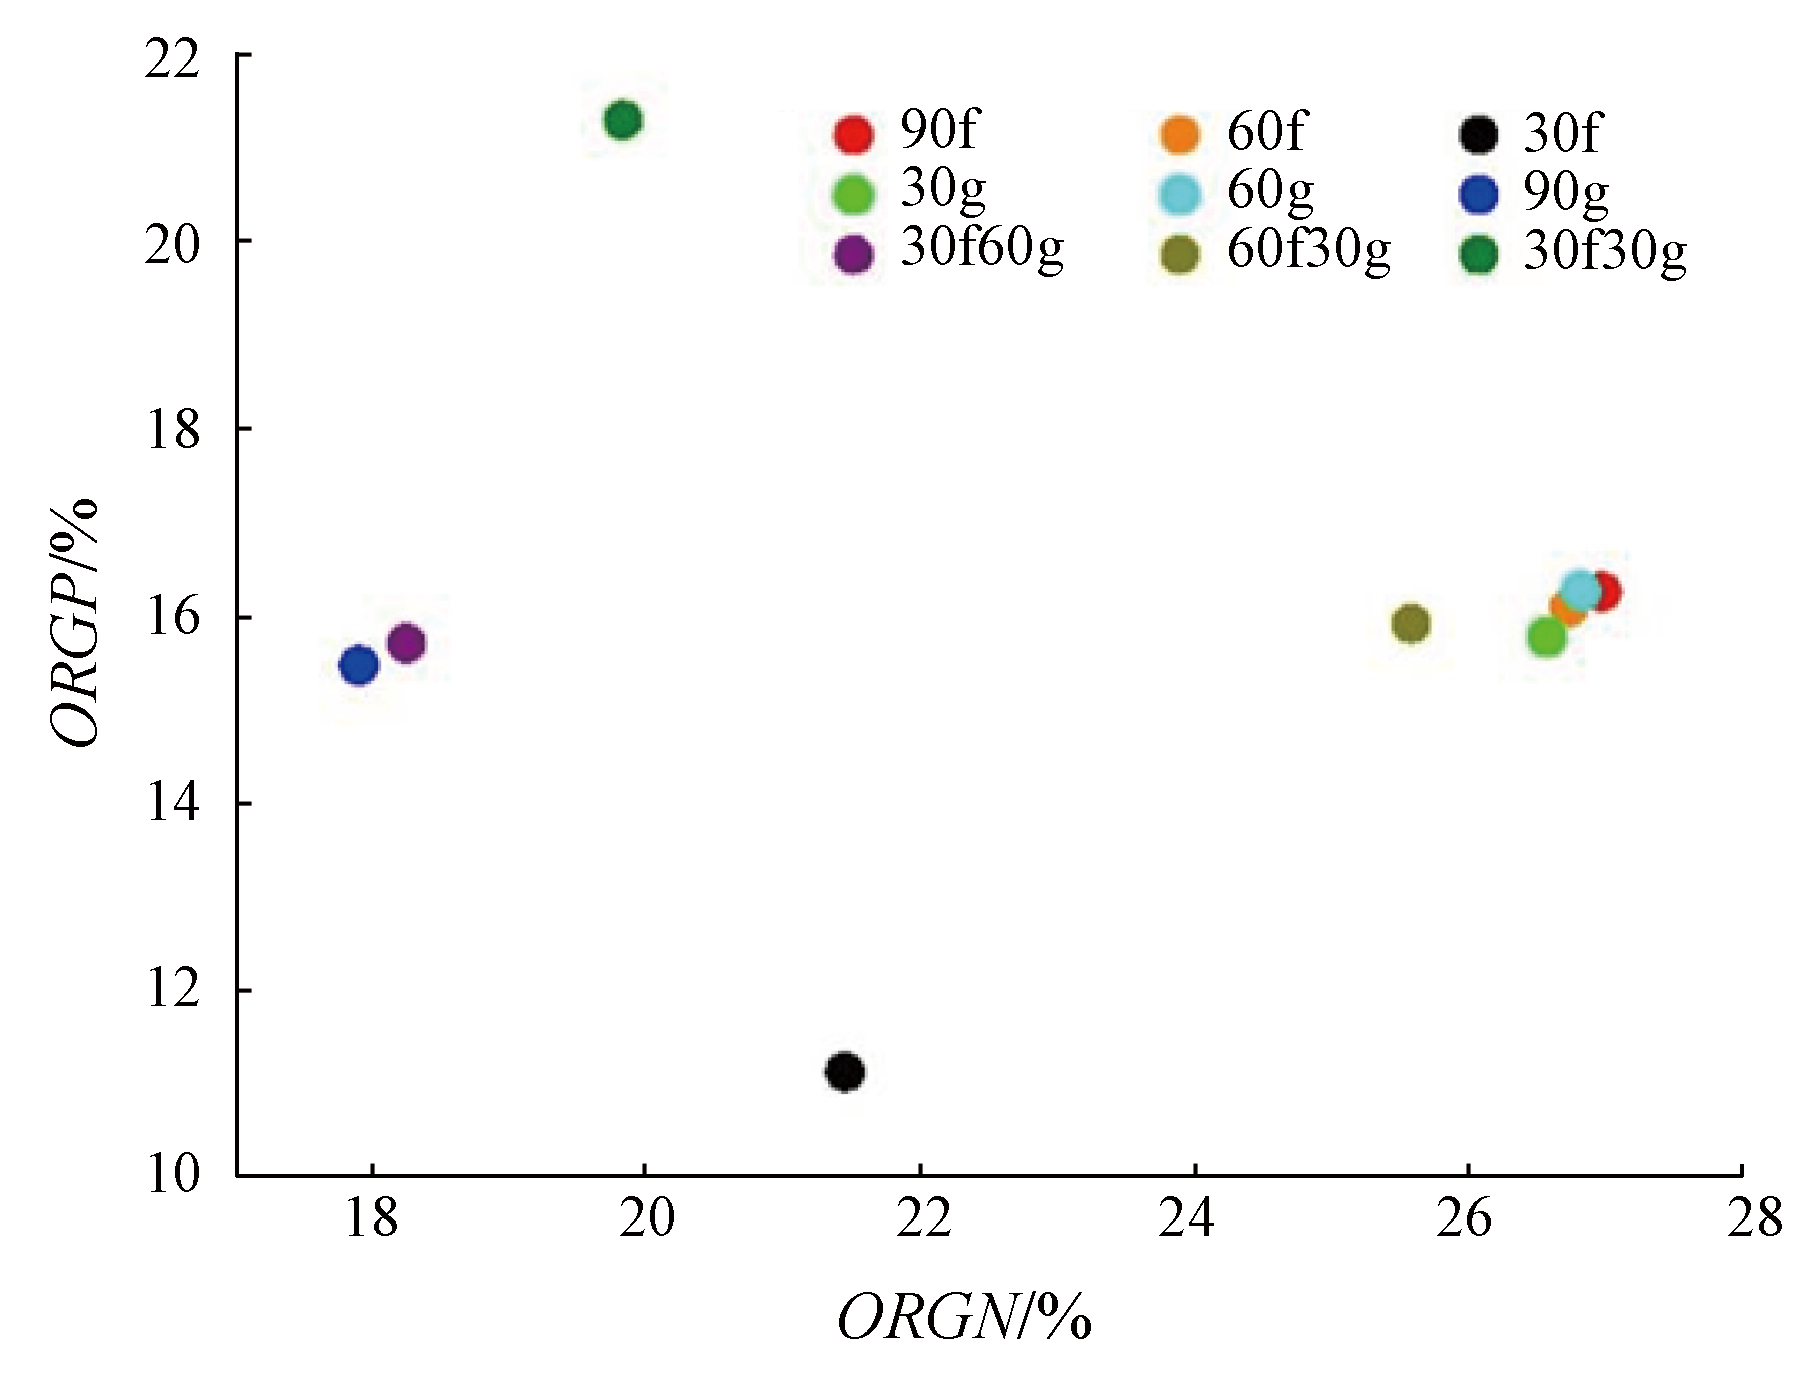
Abstract Riparian zones have been extensively used in non-point source pollution control projects worldwide, and remote sensing has gradually become a significant means of non-point source pollution research. However, combining remote sensing technology with riparian zones for efficient pollution interception effects is still a challenge. With the Xingyun Lake basin in Yunnan Province as the study area, this study established a soil and water assessment tool (SWAT) model by coupling with remote sensing. It created a riparian zone by changing the land use type for scenario simulation, investigating the different effects of various widths and vegetation types on pollutant reduction. The key findings are as follows: ①The created riparian zone exhibited better interception effects for nitrogen compared to phosphorus; ② Concerning different vegetation types in the riparian zone, forest land manifested significantly better pollution interception effects than grassland. Moreover, the pollutant reduction rate gradually increased with an increase in the width of the riparian zone; ③A riparian zone consisting of 30-m-wide forest land and 30-m-wide grassland can reduce total nitrogen production by 5.20% and total phosphorus production by 6.03% while intercepting 19.83% of organic nitrogen and 21.30% of organic phosphorus into the lake, demonstrating the optimal pollution interception effects.
|
| Keywords
SWAT
non-point source pollution
land use
riparian zone
remote sensing
|
|
|
|
Issue Date: 09 May 2025
|
|
|
| [1] |
朱兆良, 孙波, 杨林章, 等. 我国农业面源污染的控制政策和措施[J]. 科技导报, 2005, 23(4):47-51.
|
| [1] |
Zhu Z L, Sun B, Yang L Z, et al. Policy and countermeasures to control non-point pollution of agriculture in China[J]. Science & Technology Review, 2005, 23(4):47-51.
|
| [2] |
叶兆木, 彭瑶, 赵芳, 等. 水环境现状调查及评估方法分析[J]. 环境影响评价, 2020, 42(3):92-96.
|
| [2] |
Ye Z M, Peng Y, Zhao F, et al. Investigation of water environment status and analysis of assessment methods[J]. Environmental Impact Assessment, 2020, 42(3):92-96.
|
| [3] |
国家统计局. 第一次全国污染源普查公报[R]. 北京, 2010.
|
| [3] |
National Bureau of Statistics. Bulletin of the first national pollution source survey[R]. Beijing, 2010.
|
| [4] |
国家发展和改革委员会, 环境保护部, 住房和城乡建设部, 等. 太湖流域水环境综合治理总体方案(2013年修编)[EB/OL]. https://www.ndrc.gov.cn/fzggw/jgsj/dqs/sjdt/201401/W020190909483338371074.pdf.
url: https://www.ndrc.gov.cn/fzggw/jgsj/dqs/sjdt/201401/W020190909483338371074.pdf
|
| [4] |
National Development and Reform Commission, Ministry of Environmental Protection, Ministry of Housing and Urban Rural Development, et al. Overall plan for comprehensive treatment of water environment in Taihu Lake basin (revised in 2013) [EB/OL]. https://www.ndrc.gov.cn/fzggw/jgsj/dqs/sjdt/201401/W020190909483338371074.pdf.
url: https://www.ndrc.gov.cn/fzggw/jgsj/dqs/sjdt/201401/W020190909483338371074.pdf
|
| [5] |
Tu J. Spatially varying relationships between land use and water quality across an urbanization gradient explored by geographically weighted regression[J]. Applied Geography, 2011, 31(1):376-392.
|
| [6] |
Sweeney B W, Bott T L, Jackson J K, et al. Riparian deforestation,stream narrowing,and loss of stream ecosystem services[J]. Proceedings of the National Academy of Sciences of the United States of America, 2004, 101(39):14132-14137.
|
| [7] |
MacFarlane W W, Gilbert J T, Jensen M L, et al. Riparian vegetation as an indicator of riparian condition:Detecting departures from historic condition across the North American West[J]. Journal of Environmental Management, 2017, 202(Pt 2):447-460.
|
| [8] |
Hoang L, van Griensven A, Mynett A. Enhancing the SWAT model for simulating denitrification in riparian zones at the river basin scale[J]. Environmental Modelling & Software, 2017, 93(C):163-179.
|
| [9] |
Krysanova V, White M. Advances in water resources assessment with SWAT:An overview[J]. Hydrological Sciences Journal, 2015:1-13.
|
| [10] |
Malagó A, Bouraoui F, Vigiak O, et al. Modelling water and nutrient fluxes in the Danube River basin with SWAT[J]. The Science of the Total Environment, 2017, 603/604:196-218.
|
| [11] |
夏军, 翟晓燕, 张永勇. 水环境非点源污染模型研究进展[J]. 地理科学进展, 2012, 31(7):941-952.
|
| [11] |
Xia J, Zhai X Y, Zhang Y Y. Progress in the research of water environmental nonpoint source pollution models[J]. Progress in Geography, 2012, 31(7):941-952.
doi: 10.11820/dlkxjz.2012.07.013
|
| [12] |
Turpin N, Bontems P, Rotillon G, et al. AgriBMPWater:Systems approach to environmentally acceptable farming[J]. Environmental Modelling & Software, 2005, 20(2):187-196.
|
| [13] |
常舰. 基于SWAT模型的最佳管理措施(BMPs)应用研究——以西苕溪流域为例[D]. 杭州: 浙江大学, 2017.
|
| [13] |
Chang J. Evaluation for the effectiveness of best management practices(BMPs) based on SWAT model[D]. Hangzhou: Zhejiang University, 2017.
|
| [14] |
Ryu J, Cho J, Kim I J, et al. Technical note:Enhancement of SWAT-REMM to simulate reduction of total nitrogen with riparian buffer[J]. Transactions of the ASABE, 2011, 54(5):1791-1798.
|
| [15] |
Jang S S, Ahn S R, Kim S J. Evaluation of executable best management practices in Haean highland agricultural catchment of South Korea using SWAT[J]. Agricultural Water Management, 2017, 180:224-234.
|
| [16] |
王敏, 张雨桐, 李奇宸, 等. 安徽省兆河流域非点源污染模拟及最佳管理措施[J]. 水土保持通报, 2021, 41(5):127-136,153.
|
| [16] |
Wang M, Zhang Y T, Li Q C, et al. Simulation and optimal management of non-point source pollution in Zhaohe small watershed in Anhui Province[J]. Bulletin of Soil and Water Conservation, 2021, 41(5):127-136,153.
|
| [17] |
云南省统计局. 云南统计年鉴-2019(总第35期)[M]. 北京: 中国统计出版社, 2019.
|
| [17] |
Yunnan Provincial Bureau of Statistics. Yunnan statistical yearbook-2019[M]. Beijing: China Statistics Press, 2019.
|
| [18] |
陈杨. 星云湖水体环境与氮磷空间分布特征研究[D]. 昆明: 云南师范大学, 2020.
|
| [18] |
Chen Y. Characteristics of water environments and spatial distribution of nitrogen and phosphorus in Xingyun Lake[D]. Kunming: Yunnan Normal University, 2020.
|
| [19] |
云南省环境保护厅. 1998—2018云南省环境状况公报[EB/OL]. http://sthjt.yn.gov.cn/hjzl/hjzkgb/.
url: http://sthjt.yn.gov.cn/hjzl/hjzkgb/
|
| [19] |
Yunnan Provincial Department of Environmental Protection. 1998-2018Yunnan environmental status bulletin[EB/OL]. http://sthjt.yn.gov.cn/hjzl/hjzkgb/.
url: http://sthjt.yn.gov.cn/hjzl/hjzkgb/
|
| [20] |
Gong P, Liu H, Zhang M, et al. Stable classification with limited sample:Transferring a 30-m resolution sample set collected in 2015 to mapping 10-m resolution global land cover in 2017[J]. Science Bulletin, 2019, 64(6):370-373.
|
| [21] |
Harrigan S, Zsoter E, Barnard C, et al. River discharge and related historical data from the Global Flood Awareness System,v3.1,Copernicus Climate Change Service (C3S) Climate Data Store (CDS)[Z]. 2021.
|
| [22] |
Arnold J G, Srinivasan R, Muttiah R S, et al. Large area hydrologic modeling and assessment part Ⅰ:Model development1[J]. Journal of the American Water Resources Association, 1998, 34(1):73-89.
|
| [23] |
郭伟, 陈兴伟, 林炳青. SWAT模型参数对土地利用变化的响应及其对不同时间尺度径流模拟的影响[J]. 生态学报, 2021, 41(16):6373-6383.
|
| [23] |
Guo W, Chen X W, Lin B Q. Response of SWAT model parameters to land use change and its effects on the simulation of runoff with different time scales[J]. Acta Ecologica Sinica, 2021, 41(16):6373-6383.
|
| [24] |
张招招, 程军蕊, 毕军鹏, 等. 甬江流域土地利用方式对面源磷污染的影响:基于SWAT模型研究[J]. 农业环境科学学报, 2019, 38(3):650-658.
|
| [24] |
Zhang Z Z, Cheng J R, Bi J P, et al. Impact of land use on non-point sources of phosphorus in the Yong River basin:SWAT model analysis[J]. Journal of Agro-Environment Science, 2019, 38(3):650-658.
|
| [25] |
Neitsch S, Arnold J, Kiniry J, et al. Soil and water assessment tool theoretical documentation,version 2009[Z]. Texas Water Resources Institute Technical Report, 2011.
|
| [26] |
陈海涛, 曹向真. 基于SUFI-2参数最适置信区间的参数优化方法结果对比分析[J]. 节水灌溉, 2021(6):24-30.
|
| [26] |
Chen H T, Cao X Z. Comparative analysis of the results of parameter optimization methods based on the optimal confidence interval of SUFI-2 parameters[J]. Water Saving Irrigation, 2021(6):24-30.
|
| [27] |
李振炜, 于兴修, 姚孝友, 等. 农业非点源污染关键源区识别方法研究进展[J]. 生态学杂志, 2011, 30(12):2907-2914.
|
| [27] |
Li Z W, Yu X X, Yao X Y, et al. Identification approaches of critical source area of agricultural non-point source pollution:A review[J]. Chinese Journal of Ecology, 2011, 30(12):2907-2914.
|
| [28] |
朱鹤健, 陈健飞, 陈松林, 等. 土壤地理学[M].2版. 北京: 高等教育出版社, 2010.
|
| [28] |
Zhu H J, Chen J F, Chen S L, et al. Pedogeography[M].2nd ed. Beijing: Higher Education Press, 2010.
|
| [29] |
Haycock N E, Pinay G. Groundwater nitrate dynamics in grass and poplar vegetated riparian buffer strips during the winter[J]. Journal of Environmental Quality, 1993, 22(2):273-278.
|
| [30] |
Osborne L L, Kovacic D A. Riparian vegetated buffer strips in water-quality restoration and stream management[J]. Freshwater Biology, 1993, 29(2):243-258.
|
| [31] |
Sabater S, Butturini A, Clement J C, et al. Nitrogen removal by riparian buffers along a European climatic gradient:Patterns and factors of variation[J]. Ecosystems, 2003, 6(1):20-30.
|
| [32] |
汤家喜, 孙丽娜, 孙铁珩, 等. 河岸缓冲带对氮磷的截留转化及其生态恢复研究进展[J]. 生态环境学报, 2012, 21(8):1514-1520.
doi: 10.16258/j.cnki.1674-5906(2012)08-1514-07
|
| [32] |
Tang J X, Sun L N, Sun T H, et al. Research advances on retaining and transformation of N and P and ecological restoration of riparian buffer zone[J]. Ecology and Environmental Sciences, 2012, 21(8):1514-1520.
|
| [33] |
申小波. 草本植被过滤带对主要农业面源污染物的拦截效果研究[D]. 长沙: 中南林业科技大学, 2014.
|
| [33] |
Shen X B. Study on interception effects of the main agricultural non-point source pollution by grass vegetative filter strips[D]. Changsha: Central South University of Forestry & Technology, 2014.
|
| [34] |
何聪. 混播草皮缓冲带农业面源污染拦截效果的试验研究[D]. 扬州: 扬州大学, 2012.
|
| [34] |
He C. Mixture sowing turf buffer zone for agricultural non-point source pollution interception effect experimental study[D]. Yangzhou: Yangzhou University, 2012.
|
|
Viewed |
|
|
|
Full text
|
|
|
|
|
Abstract
|
|
|
|
|
Cited |
|
|
|
|
| |
Shared |
|
|
|
|
| |
Discussed |
|
|
|
|
 2025,
Vol. 37
2025,
Vol. 37