|
|
 |
|

|
|
|
Spatiotemporal analysis of economy in China’s primary cities affected by the COVID-19 pandemic based on remote sensing of night light |
LI Ruikai1( ), ZHAO Zongze1(), TANG Xiaojie2, ZHANG Jiayun1, WANG Guan1, ZHANG Lijuan1 ), ZHAO Zongze1(), TANG Xiaojie2, ZHANG Jiayun1, WANG Guan1, ZHANG Lijuan1 |
1. School of Surveying and Land Information Engineering, Henan Polytechnic University, Jiaozuo 454000, China
2. Zhengzhou Technology and Business University, Zhengzhou 451400, China |
|
|
|
|
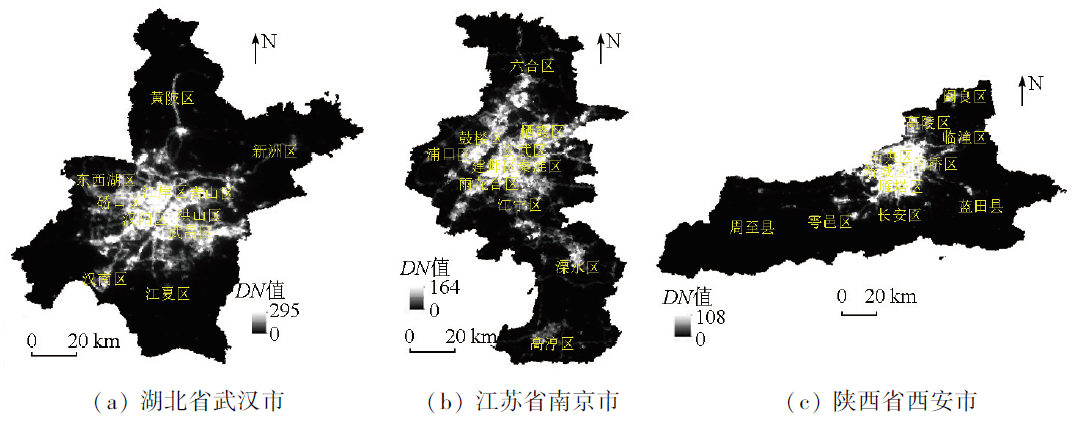
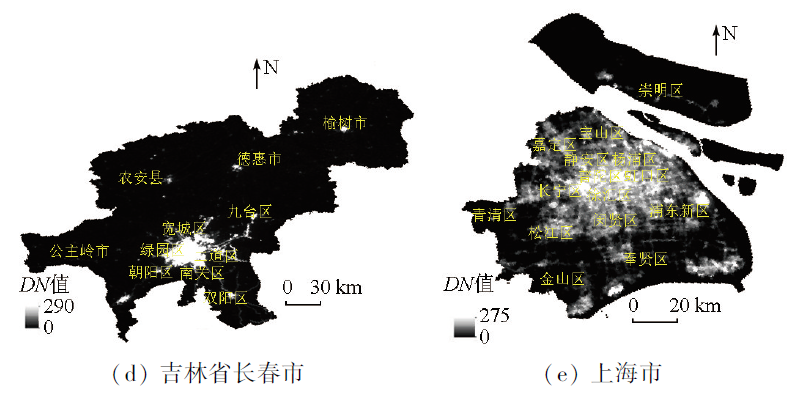
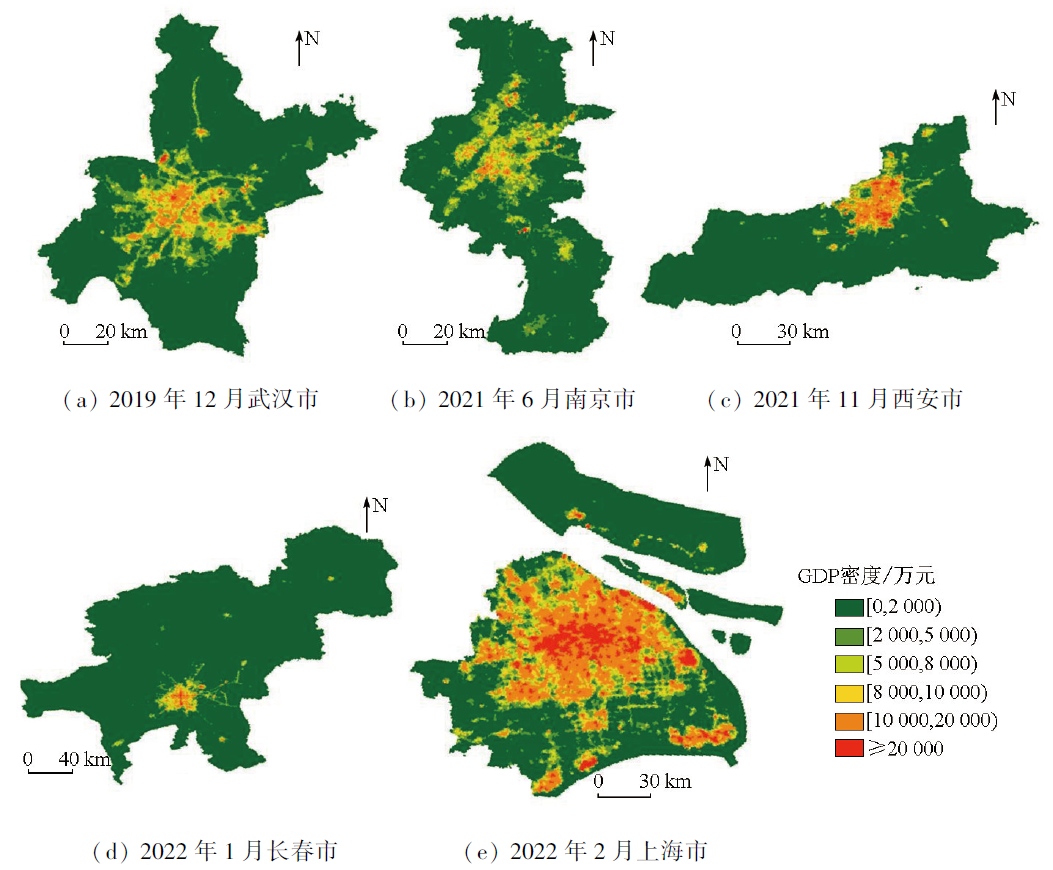
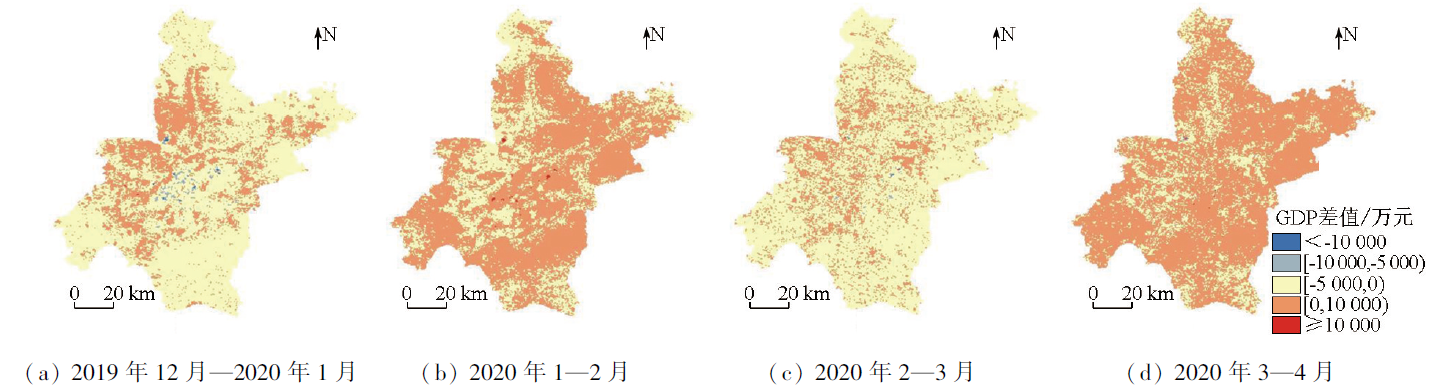
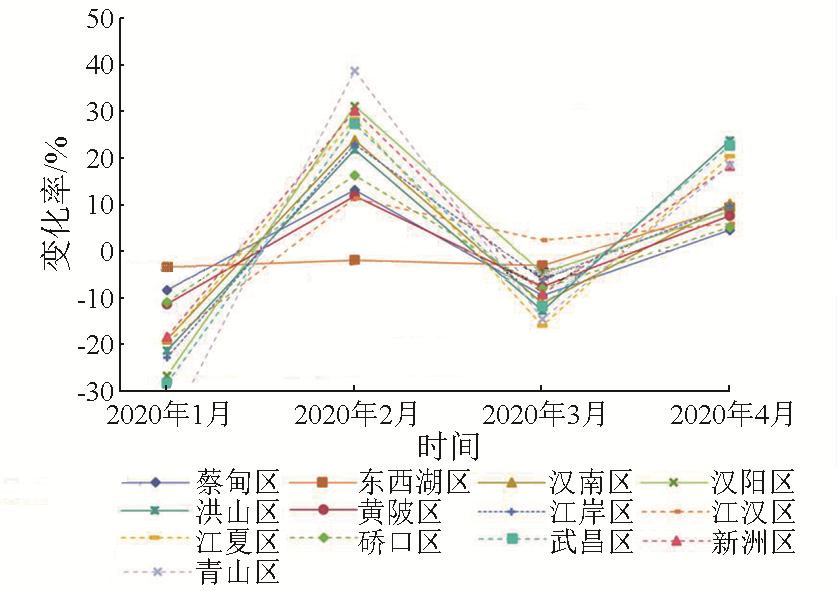
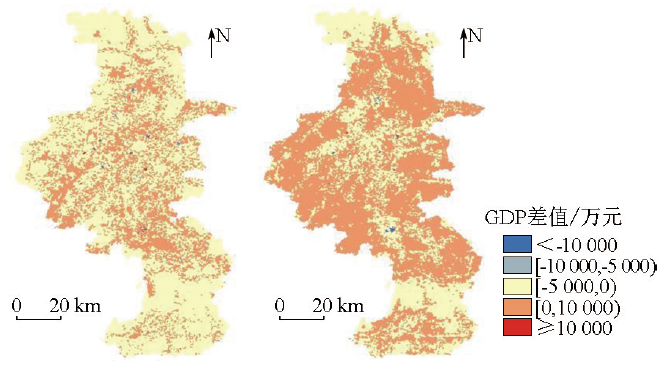
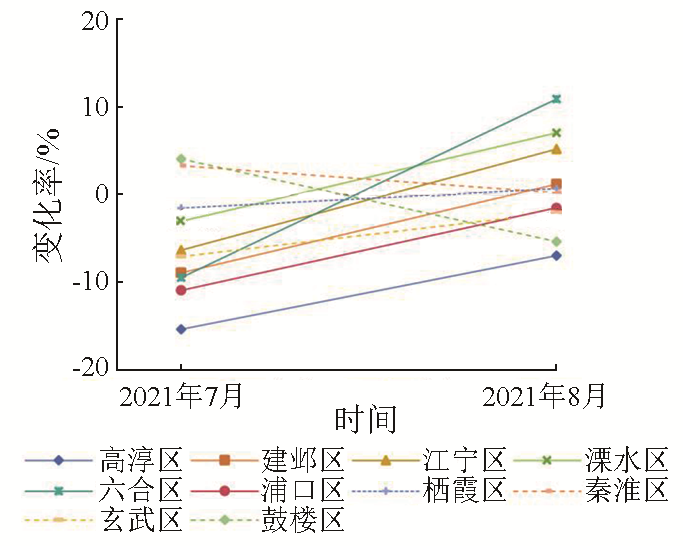
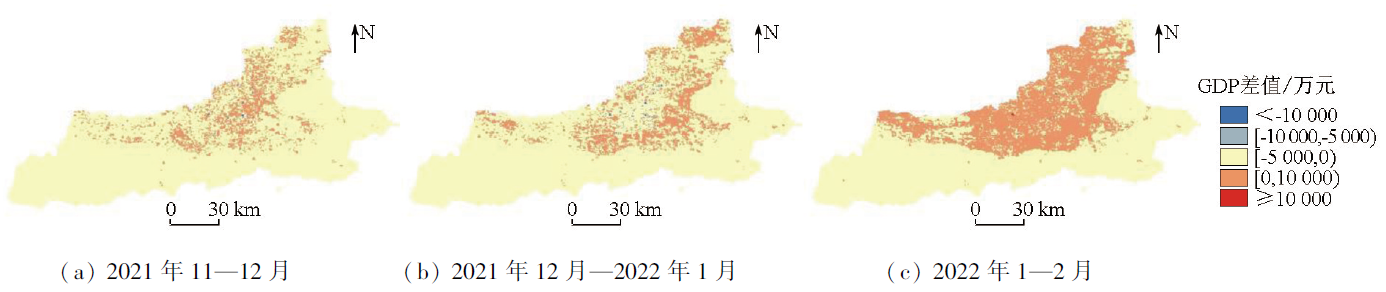
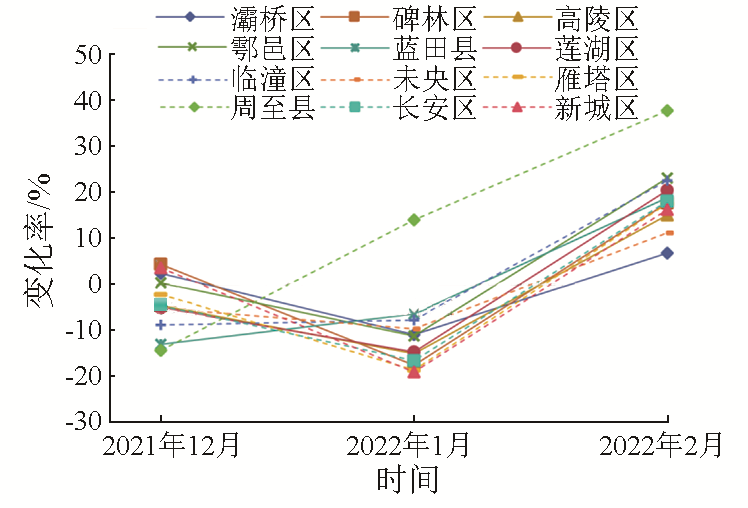
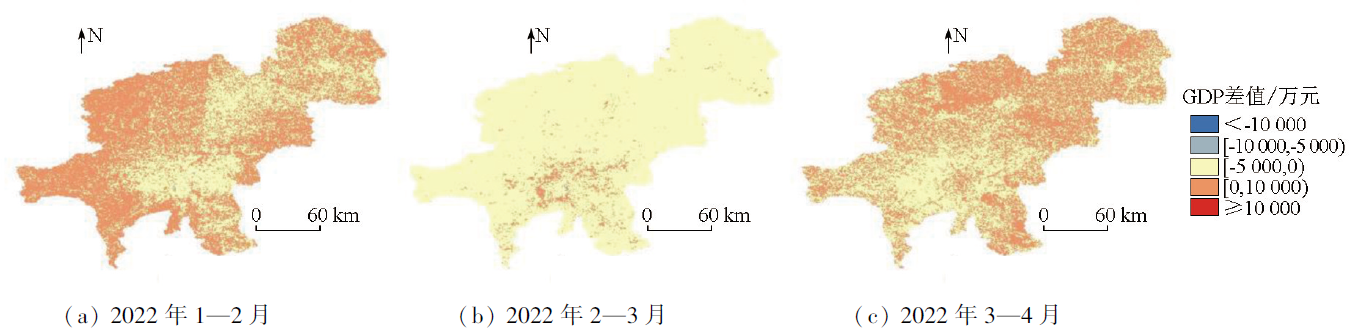
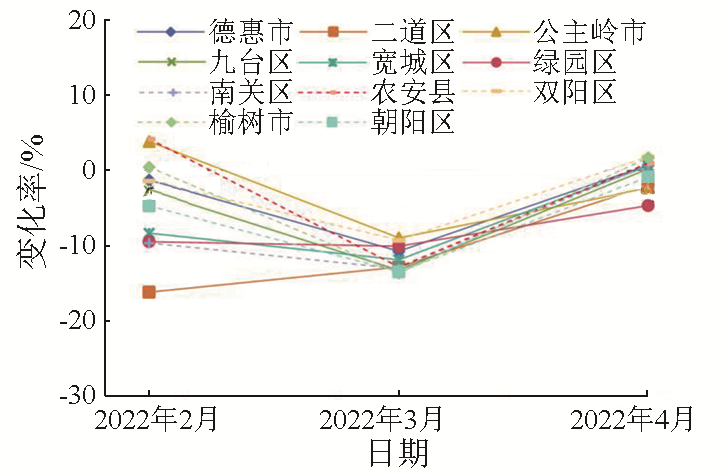
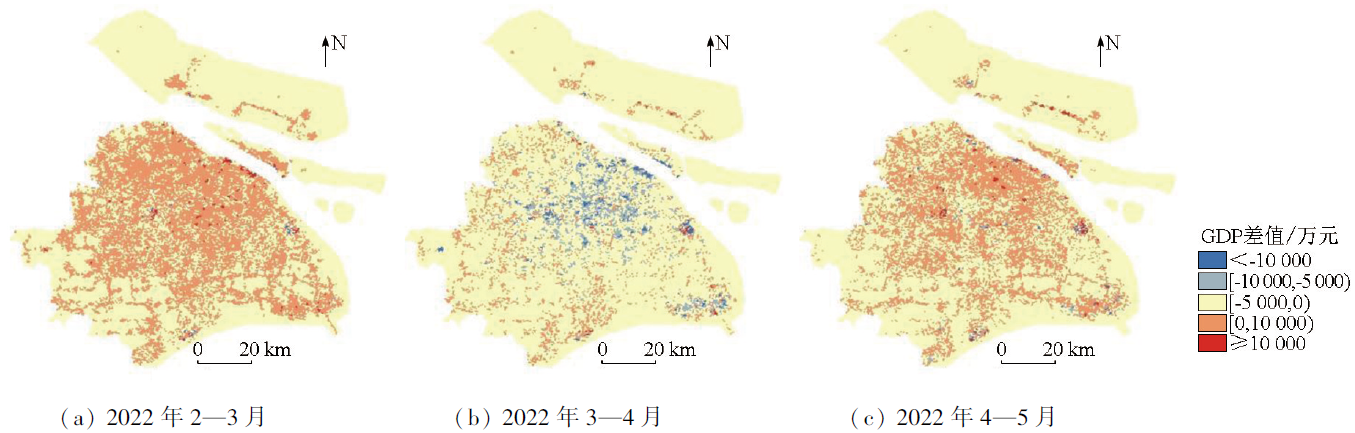
Abstract The Corona Virus Disease 2019 (COVID-19) pandemic significantly affected China’s economy. This study investigated China’s five cities that witnessed large-scale COVID-19 outbreaks based on NPP-VIIRS night light (NTL) data. A fitting model between the NTL index and GDP statistics was established. This model can reflect the monthly economic variations, yielding the spatial distribution of GPD. Finally, this study analyzed the trend in the spatial variations of the economy in the five cities during the COVID-19 pandemic by analyzing the differences in monthly GDP density. The results indicate that the GDP predicted using the GDP spatialization based on the NTL index exhibited relatively small errors and can reflect the impacts of the COVID-19 pandemic on the urban economy in an intuitive and clear manner. Under the influence of mobility policies, the marginal areas of most of the cities experienced economic recession in the early and late stages of the pandemic, with economic growth observed in the middle stage of the pandemic. In contrast, the central areas of the cities experienced economic recession in the middle stage of the pandemic, were subjected to minor impacts in its early stage, and witnessed a rapid economic recovery in its late stage. Additionally, the economy in the central areas of the cities was more resistant to the impacts of the pandemic than that in their marginal areas.
|
| Keywords
night light index
COVID-19
major cities in China
GDP spatialization
spatiotemporal economic changes
|
|
|
|
Issue Date: 17 February 2025
|
|
|
| [1] |
张清敏. 新冠肺炎疫情与全球卫生外交[J]. 当代世界, 2020(4):35-41.
|
| [1] |
Zhang Q M. Global health diplomacy in COVID-19 epidemic[J]. Contemporary World, 2020(4):35-41.
|
| [2] |
Yue W, Gao J, Yang X. Estimation of gross domestic product using multi-sensor remote sensing data:A case study in Zhejiang Pro-vince,East China[J]. Remote Sensing, 2014, 6(8):7260-7275.
|
| [3] |
李德仁, 李熙. 论夜光遥感数据挖掘[J]. 测绘学报, 2015, 44(6):591-601.
doi: 10.11947/j.AGCS.2015.20150149
|
| [3] |
Li D R, Li X. An overview on data mining of nighttime light remote sensing[J]. Acta Geodaetica et Cartographica Sinica, 2015, 44(6):591-601.
doi: 10.11947/j.AGCS.2015.20150149
|
| [4] |
郭永德, 高金环, 马洪兵. Suomi-NPP夜间灯光数据与GDP的空间关系分析[J]. 清华大学学报(自然科学版), 2016, 56(10):1122-1130.
|
| [4] |
Guo Y D, Gao J H, Ma H B. Spatial correlation analysis of Suomi-NPP nighttime light data and GDP data[J]. Journal of Tsinghua University(Science and Technology), 2016, 56(10):1122-1130.
|
| [5] |
顾鹏程, 王世新, 周艺, 等. 基于时间序列DMSP/OLS夜间灯光数据的GDP预测模型[J]. 中国科学院大学学报, 2019, 36(2):188-195.
doi: 10.7523/j.issn.2095-6134.2019.02.006
|
| [5] |
Gu P C, Wang S X, Zhou Y, et al. Estimation of GDP based on long time series of DMSP/OLS nighttime light images[J]. Journal of University of Chinese Academy of Sciences, 2019, 36(2):188-195.
doi: 10.7523/j.issn.2095-6134.2019.02.006
|
| [6] |
陈颖彪, 郑子豪, 吴志峰, 等. 夜间灯光遥感数据应用综述和展望[J]. 地理科学进展, 2019, 38(2):205-223.
doi: 10.18306/dlkxjz.2019.02.005
|
| [6] |
Chen Y B, Zheng Z H, Wu Z F, et al. Review and prospect of application of nighttime light remote sensing data[J]. Progress in Geo-graphy, 2019, 38(2):205-223.
|
| [7] |
余柏蒗, 王丛笑, 宫文康, 等. 夜间灯光遥感与城市问题研究: 数据、方法、应用和展望[J]. 遥感学报, 2021, 25(1):342-364.
|
| [7] |
Yu B L, Wang C X, Gong W K, et al. Nighttime light remote sen-sing and urban studies: Data,methods,applications,and prospects[J]. National Remote Sensing Bulletin, 2021, 25(1):342-364.
|
| [8] |
韩向娣, 周艺, 王世新, 等. 夜间灯光遥感数据的 GDP 空间化处理方法[J]. 地球信息科学学报, 2012, 14(1):128-136.
doi: 10.3724/SP.J.1047.2012.00128
|
| [8] |
Han X D, Zhou Y, Wang S X, et al. GDP spatialization in China based on nighttime imagery[J]. Journal of Geo-information Science, 2012, 14(1):128-136.
|
| [9] |
刘杨, 李宏伟, 杨斌程, 等. 基于遥感数据和POI数据的GDP空间化研究——以北京市为例[J]. 地域研究与开发, 2021, 40(2):27-32,39.
|
| [9] |
Liu Y, Li H W, Yang B C, et al. Spatialization of GDP based on remote sensing data and POI data:A case study of Beijing City[J]. Areal Research and Development, 2021, 40(2):27-32,39.
|
| [10] |
Dai Z, Hu Y, Zhao G. The suitability of different nighttime light data for GDP estimation at different spatial scales and regional levels[J]. Sustainability, 2017, 9(2):305.
|
| [11] |
孙久文, 周孝伦. 多维视角下的长三角城市群空间结构及其影响因素——基于NPP-VIIRS夜间灯光数据和高德人口迁徙数据[J]. 经济地理, 2023, 43(5):78-88.
doi: 10.15957/j.cnki.jjdl.2023.05.009
|
| [11] |
Sun J W, Zhou X L. Spatial structure and influencing factors of the Yangtze River Delta urban agglomeration from a multidimensional perspective:Based on NPP-VIIRS nighttime lighting data and Gaode’s population migration data[J]. Economic Geography, 2023, 43(5):78-88.
|
| [12] |
李翔, 朱江, 尹向东, 等. 利用珞珈一号夜间灯光数据的广东省GDP空间化[J]. 遥感信息, 2021, 36(2):40-45.
|
| [12] |
Li X, Zhu J, Yin X D, et al. Spatializing GDP of Guangdong Pro-vince based on Luojia No.1 night light data[J]. Remote Sensing Information, 2021, 36(2):40-45.
|
| [13] |
Zhao Z, Tang X, Wang C, et al. Analysis of the spatial and temporal evolution of the GDP in Henan Province based on nighttime light data[J]. Remote Sensing, 2023, 15(3):716.
|
| [14] |
江泽霖, 邓健, 栾海军, 等. 基于逐日夜间灯光遥感的新冠肺炎疫情变化信息快速提取——以北京市为例[J]. 测绘通报, 2022 (7):43-48.
doi: 10.13474/j.cnki.11-2246.2022.0201
|
| [14] |
Jiang Z L, Deng J, Luan H J, et al. Rapid extraction of COVID-19 information based on nighttime light remote sensing:A case study of Beijing[J]. Bulletin of Surveying and Mapping, 2022(7):43-48.
|
| [15] |
陶金花, 范萌, 顾坚斌, 等. 新冠病毒疫情期间复工复产卫星遥感监测[J]. 遥感学报, 2020, 24(7):824-836.
|
| [15] |
Tao J H, Fan M, Gu J B, et al. Satellite observations of the return-to-work over China during the period of COVID-19[J]. Journal of Remote Sensing, 2020, 24(7):824-836.
|
| [16] |
Elvidge C D, Ghosh T, Hsu F C, et al. The dimming of lights in China during the COVID-19 pandemic[J]. Remote Sensing, 2020, 12(17):2851.
|
| [17] |
Liu Q, Sha D, Liu W, et al. Spatiotemporal patterns of COVID-19 impact on human activities and environment in mainland China using nighttime light and air quality data[J]. Remote Sensing, 2020, 12(10):1576.
|
| [18] |
Shao Z, Tang Y, Huang X, et al. Monitoring work resumption of Wuhan in the COVID-19 epidemic using daily nighttime light[J]. Photogrammetric Engineering and Remote Sensing, 2021, 87(3):195-204.
|
| [19] |
裴韬, 王席, 宋辞, 等. COVID-19疫情时空分析与建模研究进展[J]. 地球信息科学学报, 2021, 23(2):188-210.
doi: 10.12082/dqxxkx.2021.200434
|
| [19] |
Pei T, Wang X, Song C, et al. Review on spatiotemporal analysis and modeling of COVID-19 pandemic[J]. Journal of Geo-information Science, 2021, 23(2):188-210.
|
| [20] |
Zhao M, Cheng W, Zhou C, et al. GDP spatialization and economic differences in South China based on NPP-VIIRS nighttime light imagery[J]. Remote Sensing, 2017, 9(7):673.
|
|
Viewed |
|
|
|
Full text
|
|
|
|
|
Abstract
|
|
|
|
|
Cited |
|
|
|
|
| |
Shared |
|
|
|
|
| |
Discussed |
|
|
|
|
 2025,
Vol. 37
2025,
Vol. 37