1.School of Resources and Environment Science, Xinjiang University, Urumqi 830046, China 2.Key Laboratory of Oasis Ecology, Xinjiang University, Urumqi 830046, China
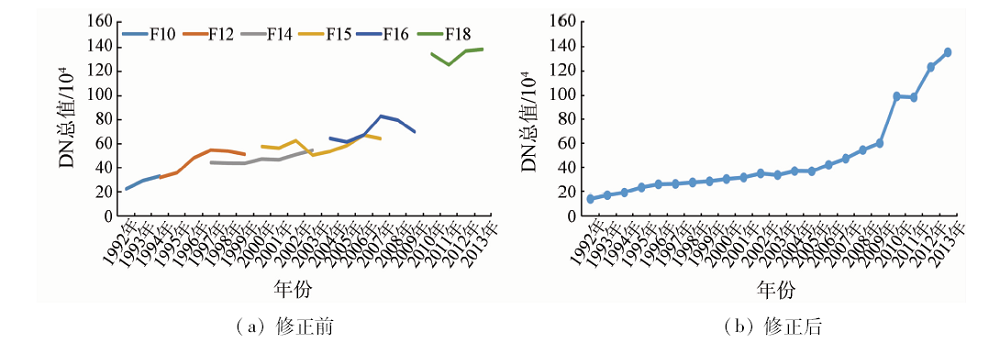
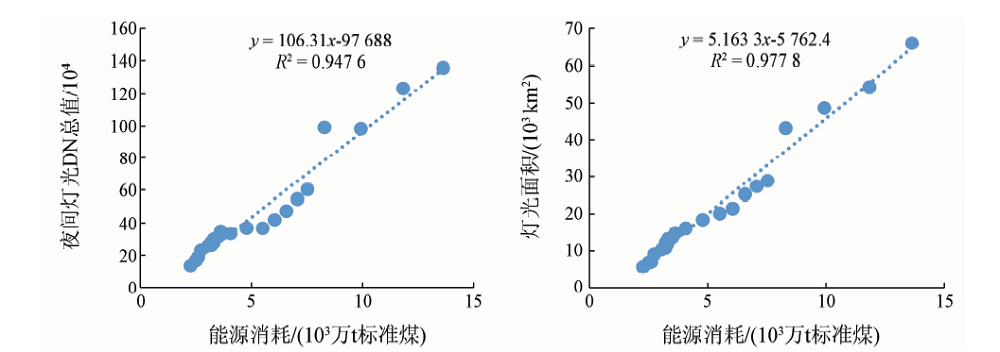
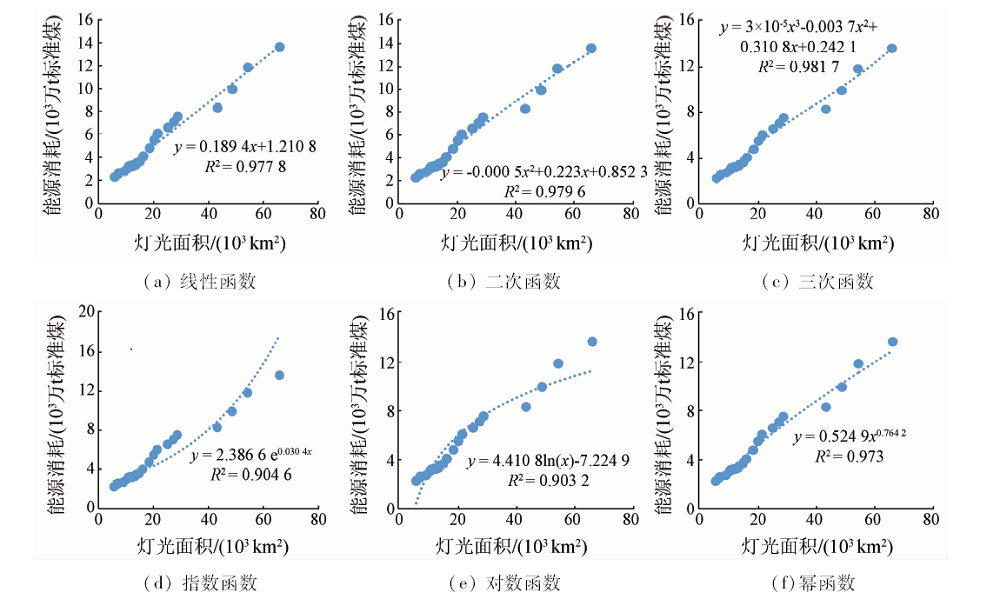
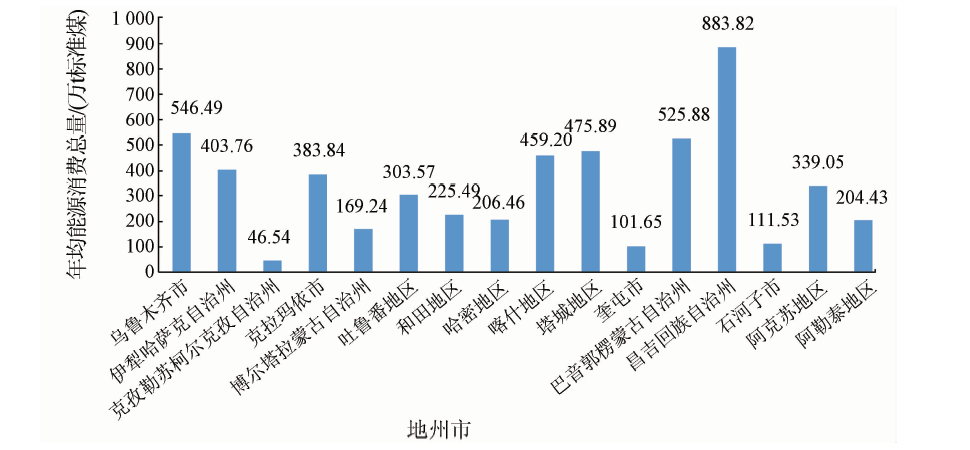
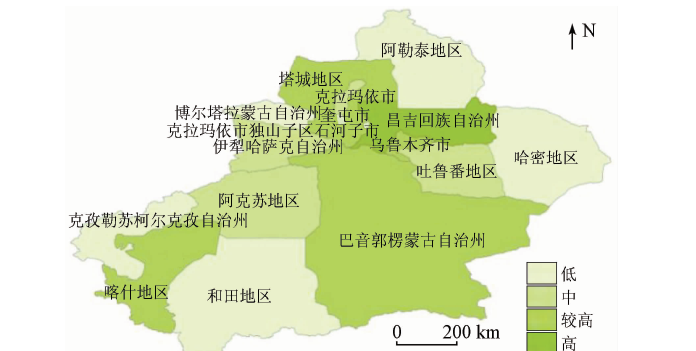
All the energy problems in different countries or regions are facing great challenges. The timely and accurate grasp of the spatial dynamic change of energy consumption can make reasonable layout to occupy the initiative, make the optimal allocation of energy structure and put forward the feasible solution. In this paper, the authors put forward the combined DMSP/OLS night light data from 1992 to 2013 and Xinjiang statistical yearbook and the application of mathematical statistics and analysis method, selected the average light intensity, DN value and light area as independent variables by using multiple regression analysis. Considering the downscaling and modifying the model, the authors made the simulation of the Xinjiang state municipal energy consumption data, and made grading of the spatial distribution difference of annual simulation data. It is found that Changji, Urumqi, Tacheng and Kashihave relatively high energy consumption level. This paper puts forward a new method for the study of dynamic energy consumption in Xinjiang.
范小晶, 张永福, 程珍珍. 基于DMSP/OLS夜间灯光数据的新疆1992—2013年能源消费研究[J]. 国土资源遥感, 2019, 31(1): 212-219.
Xiaojing FAN, Yongfu ZHANG, Zhenzhen CHENG. Research on energy consumption of Xinjiang based on DMSP/OLS night light data from 1992 to 2013. Remote Sensing for Land & Resources, 2019, 31(1): 212-219.
Dai Y D, Lyu B, Feng C . China total energy consumption control and energy conservation during the 13th five-year period[J]. Journal of Beijing Institute of Technology(Social Sciences Edition), 2015,17(1):1-7.
[2]
Welch R . Monitoring urban population and energy utilization patterns from satellite data[J]. Remote sensing of Environment, 1980,9(1):1-9.
doi: 10.1016/0034-4257(80)90043-7
[3]
Elvidge C D, Baugh K E, Kihn E A , et al. Relation between satellite observed visible-near infrared emissions,population,economic activity and electric power consumption[J]. International Journal of Remote Sensing, 1997,18(6):1373-1379.
doi: 10.1080/014311697218485
[4]
Chand T R K, Badarinath K V S, Elvidge C D , et al. Spatial characterization of electrical power consumption patterns over India using temporal DMSP-OLS night-time satellite data[J]. International Journal of Remote Sensing, 2009,30(3):647-661.
doi: 10.1080/01431160802345685
[5]
Amaral S, Câmara G , Monteiro A M V,et al.Estimating population and energy consumption in Brazilian Amazonia using DMSP night-time satellite data[J]. Computers,Environment and Urban Systems, 2005,29(2):179-195.
doi: 10.1016/j.compenvurbsys.2003.09.004
[6]
Doll C N H . CIESIN Thematic Guide to Night-time Light Remote Sensing and Its Applications[R]. Palisades,NY:Center for International Earth Science Information Network of Columbia University, 2008.
[7]
Letu H, Hara M, Yagi H , et al. Estimating energy consumption from night-time DMPS/OLS imagery after correcting for saturation effects[J]. International Journal of Remote Sensing, 2010,31(16):4443-4458.
doi: 10.1080/01431160903277464
[8]
Takashima M, Hayashi H, Kimura H, et al. Earthquake damaged area estimation using DMSP/OLS night-time imagery-application for Hanshin-Awaji Earthquake[C]// IEEE International Geoscience and Remote Sensing Symposium.Honolulu:IEEE, 2000,1:336-338.
Wu J S, Niu Y, Peng J , et al. Research on energy consumption dynamic among prefecture-level cities in China based on DMSP/OLS nighttime light[J]. Geographical Research, 2014,33(4):625-634.
Li T, He C Y, Yang Y , et al. Understanding electricity consumption changes in Chinese mainland from 1995 to 2008 by using DMSP/OLS stable nighttime light time series data[J]. Acta Geographica Sinica, 2011,66(10):1403-1412.
Yang X C, Kang L L, Zhang B , et al. Electricity consumption estimation using multi-sensor remote sensing data:A case study of Zhejiang Province[J]. Scientia Geographica Sinica, 2013,33(6):718-723.
[13]
Zhao N, Ghosh T, Samson E L . Mapping spatio-temporal changes of Chinese electric power consumption using night-time imagery[J]. International Journal of Remote Sensing, 2012,33(20):6304-6320.
doi: 10.1080/01431161.2012.684076
Su Y X, Chen X Z, Ye Y Y , et al. The characteristics and mechanisms of carbon emissions from energy consumption in China using DMSP/OLS night light imageries[J]. Acta Geographica Sinica, 2013,68(11):1513-1526.
Wang Q, Yuan T, Zheng X Q . GDP gross analysis at province-level in China based on night-time light satellite imagery[J]. Urban Development Studies, 2013,20(7):44-48.
Zou J G, Chen Y H, Tian J , et al. Construction of the calibration model for DMSP/OLS nighttime light images based on ArcGIS[J]. Journal of Geomatics, 2014,39(4):33-37.
Ren Y F, Fang C L . Spatial pattern and evaluation of eco-efficiency in counties of the Beijing-Tianjin-Hebei Urban Agglomeration[J]. Progress in Geography, 2017,36(1):87-98.
Sun W, Jin X B, Zhang Z H , et al. Characteristics of new manufacturing land and coupling analysis with urban system in Chinese major urban agglomerations[J]. Progress in Geography, 2016,35(12):1483-1493.
Li S S, Yang S N, Liu X F . Spatiotemporal variability of extreme precipitation in north and south of the Qinling—Huaihe region and influencing factors during 1960—2013[J]. Progress in Geography, 2015,34(3):354-363.
Liu L . Urban sprawl metrics based on night-time light data for metropolitan areas[J]. Remote Sensing for Land and Resources, 2018,30(2):208-213.doi: 10.6046/gtzyyg.2018.02.28.
Liu J, Xin X, Liu B , et al. Urban expansion mapping and driving factor analysis of Ordos City during the period of 2000—2013 based on DMSP/OLS nighttime light data[J]. Remote Sensing for Land and Resources, 2018,30(1):166-172.doi: 10.6046/gtzyyg.2018.01.23.
Li Z G, Hu D Y, Li J H , et al. Simulation and spatialization of GDP in poverty areas based on night light imagery[J]. Remote Sensing for Land and Resources, 2016,28(2):168-174.doi: 10.6046/gtzyyg.2016.02.26.
 2019, Vol. 31
  ), 程珍珍1,2