Please wait a minute...
 
国土资源遥感  2020, Vol. 32 Issue (2): 81-87    DOI: 10.6046/gtzyyg.2020.02.11
  技术方法 本期目录 | 过刊浏览 | 高级检索 |
基于NPP/VIIRS卫星夜光数据的新建高铁站所在县域的GDP估算模型
屈辰阳1,2,3, 张莉2,3, 汪鸣泉2,3, 王茂华2,3
1.中国科学院大学微电子学院,北京 100049
2.中国科学院低碳转化科学与工程重点实验室,上海 201210
3.中国科学院上海高等研究院上海碳数据与碳评估研究中心,上海 201210
GDP estimation model of county areas based on NPP/VIIRS satellite nighttime light data
Chenyang QU1,2,3, Li ZHANG2,3, Mingquan WANG2,3, Maohua WANG2,3
1. School of Microelectronics, University of Chinese Academy of Sciences, Beijing 100049, China
2. Key Laboratory of Low-Coal Conversion Science and Engineering, Chinese Academy of Sciences, Shanghai 201210, China
3. Shanghai Carbon Data Research Center, Shanghai Advanced Research Institute, Chinese Academy of Sciences, Shanghai 201210, China
全文: PDF(2599 KB)   HTML  
输出: BibTeX | EndNote (RIS)      
摘要 

基于美国的新一代对地观测卫星NPP/VIIRS卫星夜光数据,构建面板回归模型,以我国25个中西部首次开通高铁的县域为研究对象,对其2013—2018年间县域GDP进行经济估算。首先,对公开的NPP/VIIRS数据进行基于最大估计的矫正处理; 然后,建立夜间灯光-GDP的面板回归模型; 最后,进行GDP估算。结果显示25个县中,有16个县的相关系数(R2)达到了0.9以上,6个县级区域的R2在0.85~0.9之间,证实NPP/VIIRS卫星夜光数据的变化与新建高铁站所在县域的经济增长呈现较好和长期平稳的正相关性。对高铁与县级经济发展的影响做了简要分析,认为通过面板回归模型来拟合NPP/VIIRS卫星夜光数据并推算新建高铁站所在县域GDP的方法是可行的。

服务
把本文推荐给朋友
加入引用管理器
E-mail Alert
RSS
作者相关文章
屈辰阳
张莉
汪鸣泉
王茂华
关键词 NPP/VIIRS卫星夜光数据新建高铁站县域经济估算面板数据回归分析    
Abstract

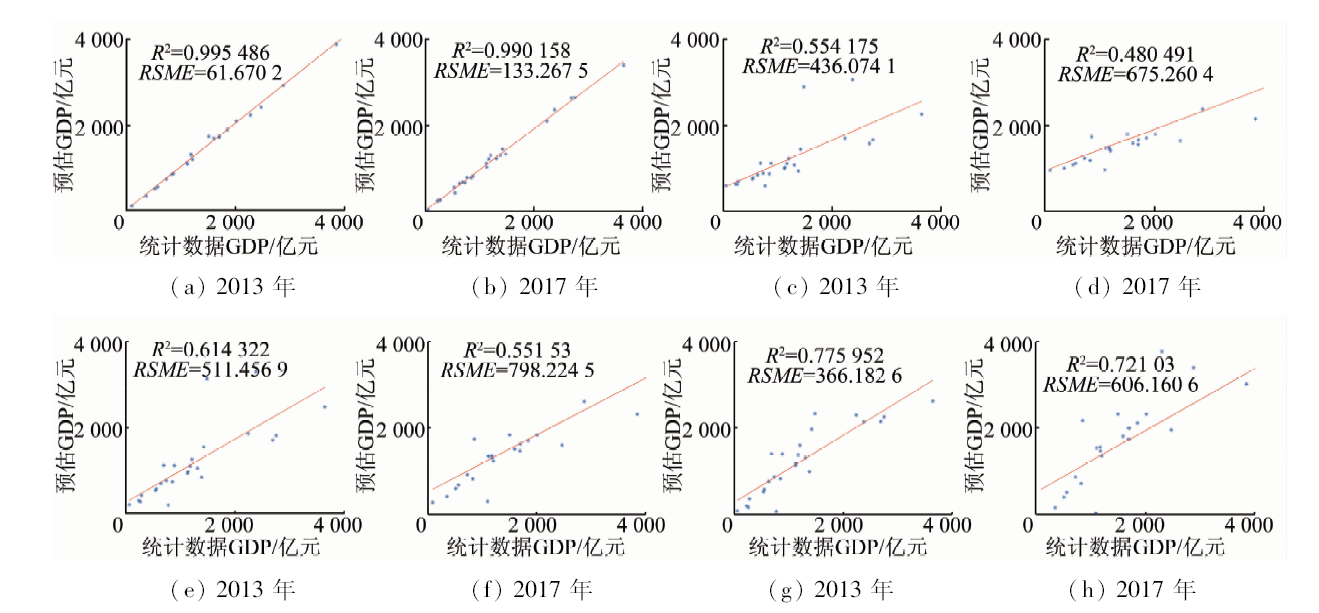
Based on the NPP/VIIRS nighttime lighting data, the authors constructed a panel regression model to estimate the county GDP of some counties where the new high-speed railway was located in 2013—2018. In this paper, the NPP/VIIRS data was firstly based on the maximum estimation of the correction process, and the night light-GDP panel regression model was established for GDP estimation. The results show that, among the 25 counties, 16 counties have a correlation coefficient R2 of 0.9 or more. The R2 of the six county-level regions is between 0.85 and 0.9, which confirms that the NPP/VIIRS satellite nighttime lighting data changes and the economic growth of the county where the new high-speed railway station is located shows a good and long-term stable positive correlation. At the same time, the authors made a brief analysis of the impact of high-speed rail and county-level economic development, and argued that it is feasible for the panel data model to fit the NPP/VIIRS satellite nighttime lighting data and to estimate the GDP of the counties where the new high-speed railway is located.

Key wordsNPP/VIIRS nighttime light data    new high-speed railway station    county economic estimation    panel data analysis
收稿日期: 2019-04-19      出版日期: 2020-06-18
:  TP79  
基金资助:中国科学院洁净能源创新研究院合作基金项目“变革性洁净能源关键技术对我国碳排放达峰目标的贡献及其减排路径研究”(DNL180101)
作者简介: 屈辰阳(1995-),男,硕士,主要从事卫星数据处理、遥感图像分类的应用研究。Email: qucy@sari.ac.cn。
引用本文:   
屈辰阳, 张莉, 汪鸣泉, 王茂华. 基于NPP/VIIRS卫星夜光数据的新建高铁站所在县域的GDP估算模型[J]. 国土资源遥感, 2020, 32(2): 81-87.
Chenyang QU, Li ZHANG, Mingquan WANG, Maohua WANG. GDP estimation model of county areas based on NPP/VIIRS satellite nighttime light data. Remote Sensing for Land & Resources, 2020, 32(2): 81-87.
链接本文:  
https://www.gtzyyg.com/CN/10.6046/gtzyyg.2020.02.11      或      https://www.gtzyyg.com/CN/Y2020/V32/I2/81
县级行政区域
贵州 安龙、册亨、盘州、兴义
云南 呈贡、富源、广南、陆良、罗平、弥勒、师宗、石林、宜良
广西 隆安、平果、田东、田林
四川 广汉、剑阁、江油、青川
陕西 城固、佛坪、宁强、洋县
Tab.1  所选区域名称
Fig.1  矫正前后的TNL平均值对比
序列
阶数
LLC检验 ADF-Fisher检验
零阶 一阶差分 零阶 一阶差分
TNL -2.124 5 -12.580 2 1.758 2 -18.526 7
GDP 1.513 5 -8.785 2 4.192 3 -11.226 7
Tab.2  面板数据的单位根检验结果
种类 Panel Group
v-统计量 rho-统计量 PP-统计量 ADF-统计量 rho-统计量 PP-统计量 ADF-统计量
GDP -0.691 4 -3.878 1 0.275 5 -3.936 6 0.511 2 -4.377 5 -1.834 8
Tab.3  协整检验结果
县域 α β R2
安龙 -8.687 9 0.451 2 0.934 818

贵州
册亨 -128.542 8 0.800 6 0.989 821
盘州 -7 475.443 6 1.445 7 0.913 424
兴义 -1 483.823 4 0.335 4 0.995 886
富源 -974.728 8 0.573 6 0.446 155
呈贡 79.291 2 0.145 1 0.898 707
广南 234.877 7 0.360 4 0.907 995
陆良 -404.317 6 0.726 0 0.961 307
云南 罗平 -873.509 1 0.765 8 0.826 104
弥勒 316.027 7 0.388 9 0.928 302
师宗 3 454.222 1 -0.940 6 0.916 207
石林 290.737 4 0.154 3 0.819 312
宜良 443.285 0 0.383 8 0.835 792
城固 100.488 1 0.744 7 0.970 234

陕西
佛坪 30.623 7 0.185 4 0.658 605
宁强 -119.314 6 0.736 5 0.831 916
洋县 291.047 8 0.416 3 0.924 146
隆安 121.387 9 0.407 4 0.916 377

广西
平果 -2127.954 9 1.031 8 0.929 706
田东 476.060 4 0.348 3 0.901 103
田林 -485.302 8 1.104 7 0.925 872
广汉 6 942.120 3 -0.739 4 0.539 354

四川
剑阁 -581.125 3 5.370 6 0.994 888
江油 -4216.557 4 1.470 6 0.979 202
青川 -177.005 6 1.114 4 0.945 177
Tab.4  各地区面板回归模型参数
Fig.2  各地GDP估算结果
Fig.3  4种回归模型的GDP统计-预测对比
县域 模拟GDP/亿元 统计GDP/亿元 误差/%
册亨 59.54 58.12 2.385 0
盘州 596.52 596.5 0.003 4
兴义 446.34 450.07 -0.835 7
呈贡 248.76 249.9 -0.458 3
弥勒 298.63 300 -0.458 8
石林 85.46 85.6 -0.163 8
城固 252.31 260.4 -3.206 4
佛坪 9.81 10.8 -10.091 7
宁强 86.6 89.05 -2.829 1
洋县 131.33 130.1 0.936 6
广汉 407.43 438 -7.503 1
江油 431.59 428 0.831 8
青川 39.09 39.1 -0.025 6
总计 3 093.41 3 135.64 -1.346 8
Tab.5  部分县域2018年GDP预测与统计数据对比
[1] 方大春, 孙明月. 高速铁路对长三角城市群经济发展影响评估——基于DID模型的实证研究[J]. 华东经济管理, 2016,30(2):42-47.
Fang D C, Sun M Y. An evaluation on the impact of high-speed rail on economic development of city clusters in the Yangtze River Delta[J]. East China Economic Management, 2016,30(2):42-47.
[2] 李新光, 黄安民, 张永起. 高铁对区域经济发展的影响评估——基于DID模型对福建省的实证分析[J].现代城市研究, 2017(4):125-132.
Li X G, Huang A M, Zhang Y Q. The impact of high-speed railway on regional economic development:An empirical analysis of Fujian Province based on DID model[J].Modern Urban Research, 2017(4):125-132.
[3] 江威, 何国金, 刘慧婵. NPP/VIIRS和DMSP/OLS夜光数据模拟社会经济参量对比[J]. 遥感信息, 2016,31(4):28-34.
Jiang W, He G J, Liu H C. Modelling regional socio-economic parameters based on comparison of NPP/VIIRS and DMSP/OLS nighttime light imagery[J]. Remote Sensing Information, 2016,31(4):28-34.
[4] 刘佳, 辛鑫, 刘斌, 等. 基于DMSP/OLS夜间灯光影像的2000—2013年鄂尔多斯市城市扩张遥感制图与驱动因子分析[J]. 国土资源遥感, 2018,30(1):166-172.doi: 10.6046/gtzyyg.2018.01.23.
Liu J, Xin X, Liu B, et al. Urban expansion mapping and driving factor analysis of Ordos City during the period of 2000—2013 based on DMSP/OLS nighttime light data[J]. Remote Sensing for Land and Resources, 2018,30(1):166-172.doi: 10.6046/gtzyyg.2018.01.23.
[5] 周红妹, 高阳, 葛伟强, 等. 城市扩展与热岛空间分布变化关系研究——以上海为例[J].生态环境, 2008(1):163-168.
Zhou H M, Gao Y, Ge W Q, et al. The research on the relationship between the urban expansion and the change of the urban heat island distribution in Shanghai Area[J].Ecology and Environment, 2008(1):163-168.
[6] 金平斌, 徐鹏飞. 基于DMSP/OLS夜间灯光数据的城镇化进程及格局研究——以杭州市为例[J]. 国土资源遥感, 2017,29(4):205-213.doi: 10.6046/gtzyyg.2017.04.31.
Jin P F, Xu P F. A study of urbanization progress and spatial pattern using DMSP/OLS nighttime light data:A case study of Hangzhou City[J]. Remote Sensing for Land and Resources, 2017,29(4):205-213.doi: 10.6046/gtzyyg.2017.04.31.
[7] 舒松, 余柏蒗, 吴健平, 等. 基于夜间灯光数据的城市建成区提取方法评价与应用[J]. 遥感技术与应用, 2011,26(2):169-176.
Shu S, Yu B L, Wu J P, et al. Methods for deriving urban built-up area using night-light data:Assessment and application[J]. Remote Sensing Technology and Application, 2011,26(2):169-176.
[8] 李欣欣, 王利, 何飞. 基于NPP/VIIRS夜间灯光数据和土地利用数据的人口分布图绘制——以大连金普新区为例[J]. 遥感信息, 2018,33(4):35-41.
Li X X, Wang L, He F. Population distribution map drawing based on NPP/VIIRS nighttime light remote sensing images and land use data:A case study in Jinpu New Area[J]. Remote Sensing Information, 2018,33(4):35-41.
[9] Ghosh T, Anderson S, Rebecca L. et al. Estimation of Mexico’s informal economy and remittances using nighttime imagery[J]. Remote Sensing, 2009,1(3):418-444.
[10] Henderson J V, Storeygard A, Weil D N. Measuring economic growth from outer space[J]. American Economic Review, 2012,102(2):994-1028.
[11] 徐康宁, 陈丰龙, 刘修岩. 中国经济增长的真实性:基于全球夜间灯光数据的检验[J]. 经济研究, 2015,50(9):17-29,57.
Xu K N, Chen F L, Liu X Y. The truth of China economic growth:Evidence from global night-time light data[J]. Economic Research Journal, 2015,50(9):17-29,57.
[12] 徐银凤, 汪德根. 中国城市空间结构的高铁效应研究进展与展望[J]. 地理科学进展, 2018,37(9):1216-1230.
Xu Y F, Wang D G. Research progress and prospects of high-speed rail effects on urban spatial structure in China[J]. Progress in Geography, 2018,37(9):1216-1230.
[13] Li X, Xu H, Chen X, et al. Potential of NPP-VIIRS nighttime light imagery for modeling the regional economy of China[J]. Remote Sensing, 2013,5(6):3057-3081.
[14] Shi K, Yun C, Yu B, et al. Modeling spatiotemporal CO2(carbon dioxide) emission dynamics in China from DMSP-OLS nighttime stable light data using panel data analysis[J]. Applied Energy, 2016,168(2):523-533.
[15] 潘文卿. 外商投资对中国工业部门的外溢效应:基于面板数据的分析[J]. 世界经济, 2003,26(6):3-7,80.
Pan W Q. The spillover effect of foreign investment on China’s industrial sector:Analysis based on panel data[J]. World Economy, 2003,26(6):3-7,80.
[16] 陈立俊, 王克强. 中国城市化发展与产业结构关系的实证分析[J]. 中国人口·资源与环境, 2010,20(s1):17-20.
Chen L J, Wang K Q. Analysis of the relationship between Chinese urbanization and industry structure[J]. China Population,Resources and Environment, 2010,20(s1):17-20.
[17] 刘金全, 于惠春. 我国固定资产投资和经济增长之间影响关系的实证分析[J]. 统计研究, 2002,19(1):26-29.
Liu J Q, Yu H C. An empirical analysis of the relationship between fixed assets investment and economic growth in China[J]. Statistical Research, 2002,19(1):26-29.
[18] 张俊. 高铁建设与县域经济发展——基于卫星灯光数据的研究[J]. 经济学, 2017,16(4):1533-1562.
Zhang J. High-speed rail construction and county economic development:The research of satellite light data[J]. China Economic Quarterly, 2017,16(4):1533-1562.
[19] 李宗光, 胡德勇, 李吉贺, 等. 基于夜间灯光数据的连片特困区GDP估算及其空间化[J]. 国土资源遥感, 2016,28(2):168-174.doi: 10.6046/gtzyyg.2016.02.26.
Li Z G, Hu D Y, Li J H, et al. Simulation and specialization of GDP in poverty areas based on night light imagery[J]. Remote Sensing for Land and Resources, 2016,28(2):168-174.doi: 10.6046/gtzyyg.2016.02.26.
[20] 刘璐. 基于夜间灯光数据的城市群蔓延指标[J]. 国土资源遥感, 2018,30(2):208-213.doi: 10.6046/gtzyyg.2018.02.28.
Liu L. Urban sprawl metrics based on night-time light data for metropolitan areas[J]. Remote Sensing for Land and Resources, 2018,30(2):208-213.doi: 10.6046/gtzyyg.2018.02.28.
[1] 宋奇, 冯春晖, 马自强, 王楠, 纪文君, 彭杰. 基于1990—2019年Landsat影像的干旱区绿洲土地利用变化与模拟[J]. 自然资源遥感, 2022, 34(1): 198-209.
[2] 任超锋, 蒲禹池, 张福强. 顾及地理空间信息的无人机影像匹配像对提取方法[J]. 自然资源遥感, 2022, 34(1): 85-92.
[3] 臧丽日, 杨树文, 申顺发, 薛庆, 秦肖伟. 耦合分水岭与形态学的特殊纹理影像配准算法[J]. 自然资源遥感, 2022, 34(1): 76-84.
[4] 潘建平, 徐永杰, 李明明, 胡勇, 王春晓. 结合相关系数和特征分析的植被区域自动变化检测研发[J]. 自然资源遥感, 2022, 34(1): 67-75.
[5] 薛白, 王懿哲, 刘书含, 岳明宇, 王艺颖, 赵世湖. 基于孪生注意力网络的高分辨率遥感影像变化检测[J]. 自然资源遥感, 2022, 34(1): 61-66.
[6] 江娜, 陈超, 韩海丰. 海岸带地类统计模型中DEM空间尺度优选方法[J]. 自然资源遥感, 2022, 34(1): 34-42.
[7] 吴芳, 李瑜, 金鼎坚, 李天祺, 郭华, 张琦洁. 无人机三维地障信息提取技术应用于航空物探飞行轨迹规划[J]. 自然资源遥感, 2022, 34(1): 286-292.
[8] 王茜, 任广利. 高光谱遥感异常信息在阿尔金索拉克地区铜金矿找矿工作中的应用[J]. 自然资源遥感, 2022, 34(1): 277-285.
[9] 刘文, 王猛, 宋班, 余天彬, 黄细超, 江煜, 孙渝江. 基于光学遥感技术的冰崩隐患遥感调查及链式结构研究——以西藏自治区藏东南地区为例[J]. 自然资源遥感, 2022, 34(1): 265-276.
[10] 姚金玺, 张志, 张焜. 基于GEE的诺木洪洪积扇植被时空变化特征、成因及趋势分析[J]. 自然资源遥感, 2022, 34(1): 249-256.
[11] 武艺杰, 孔雪松. 江苏省“生态-农业-建设”用地空间格局模拟及发展模式选择[J]. 自然资源遥感, 2022, 34(1): 238-248.
[12] 张秦瑞, 赵良军, 林国军, 万虹麟. 改进遥感生态指数的宜宾市三江汇合区生态环境评价[J]. 自然资源遥感, 2022, 34(1): 230-237.
[13] 胡盈盈, 戴声佩, 罗红霞, 李海亮, 李茂芬, 郑倩, 禹萱, 李宁. 2001—2015年海南岛橡胶林物候时空变化特征分析[J]. 自然资源遥感, 2022, 34(1): 210-217.
[14] 孙一鸣, 张宝钢, 吴其重, 刘奥博, 高超, 牛静, 何平. 国产微景一号小卫星影像的城市裸地识别应用[J]. 自然资源遥感, 2022, 34(1): 189-197.
[15] 郑修诚, 周斌, 雷惠, 黄祺宇, 叶浩林. 基于GEE的杭州湾慈溪段潮滩提取及时空变化分析[J]. 自然资源遥感, 2022, 34(1): 18-26.
Viewed
Full text


Abstract

Cited

  Shared   
  Discussed   
京ICP备05055290号-2
版权所有 © 2015 《自然资源遥感》编辑部
地址:北京学院路31号中国国土资源航空物探遥感中心 邮编:100083
电话:010-62060291/62060292 E-mail:zrzyyg@163.com
本系统由北京玛格泰克科技发展有限公司设计开发