1. The Key Laboratory for Silviculture and Conservation of Ministry of Education, Beijing Forestry University, Beijing 100083, China 2. China Aero Geophysical Survey and Remote Sensing Center for Natrual Resources, Beijing 100083, China
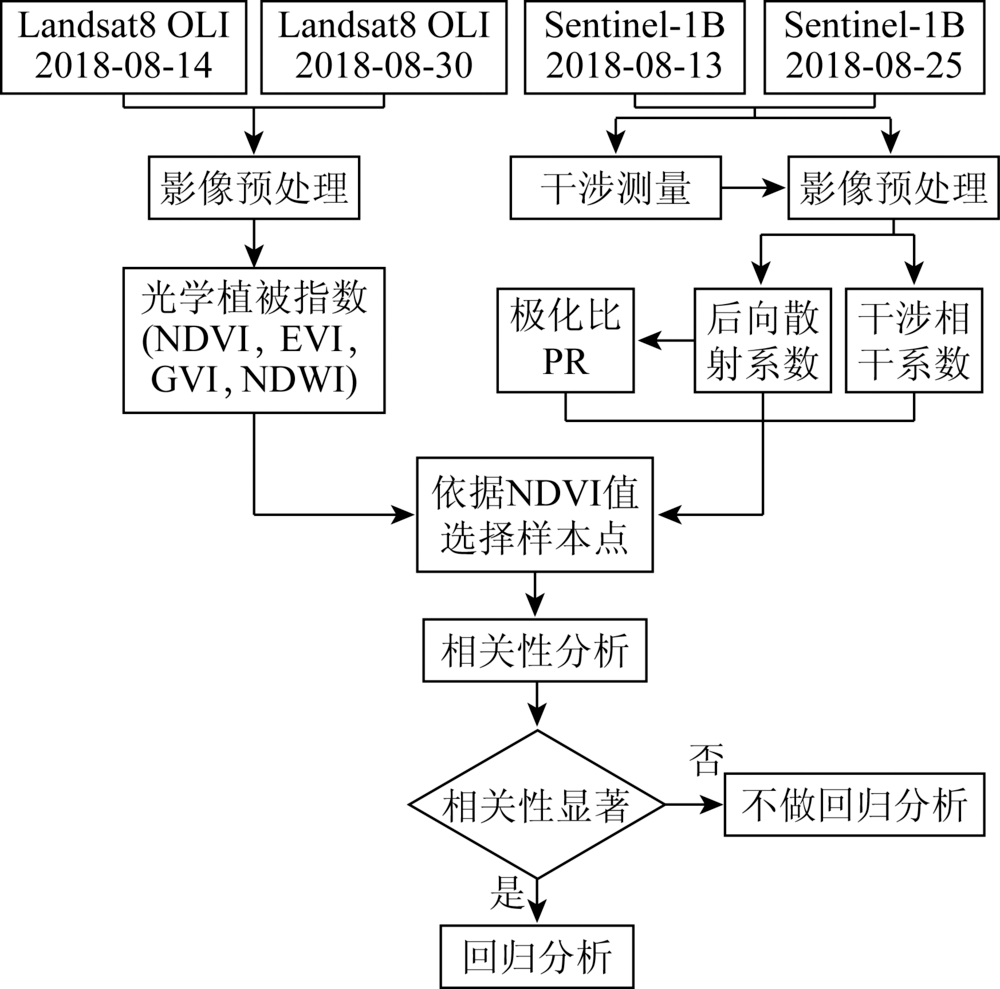
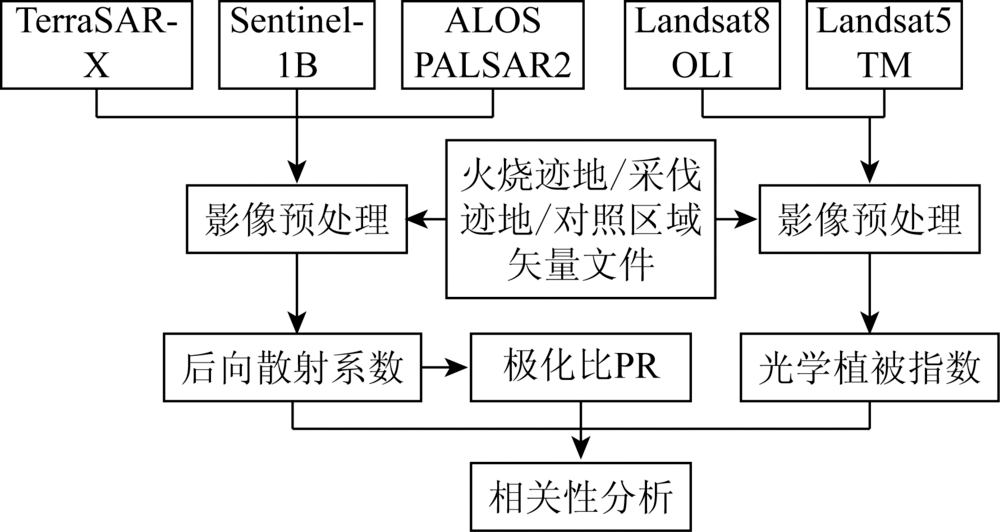
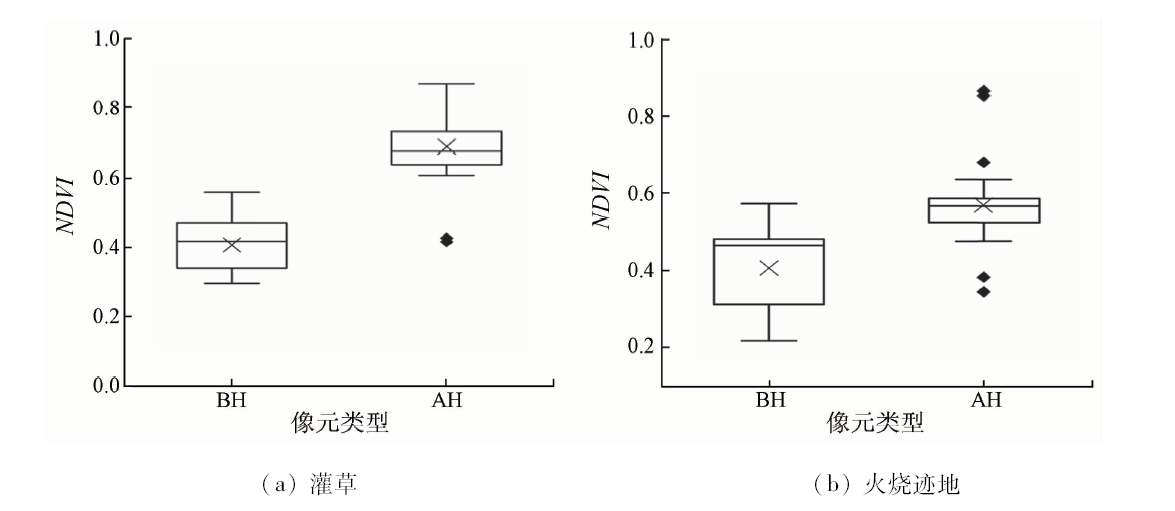
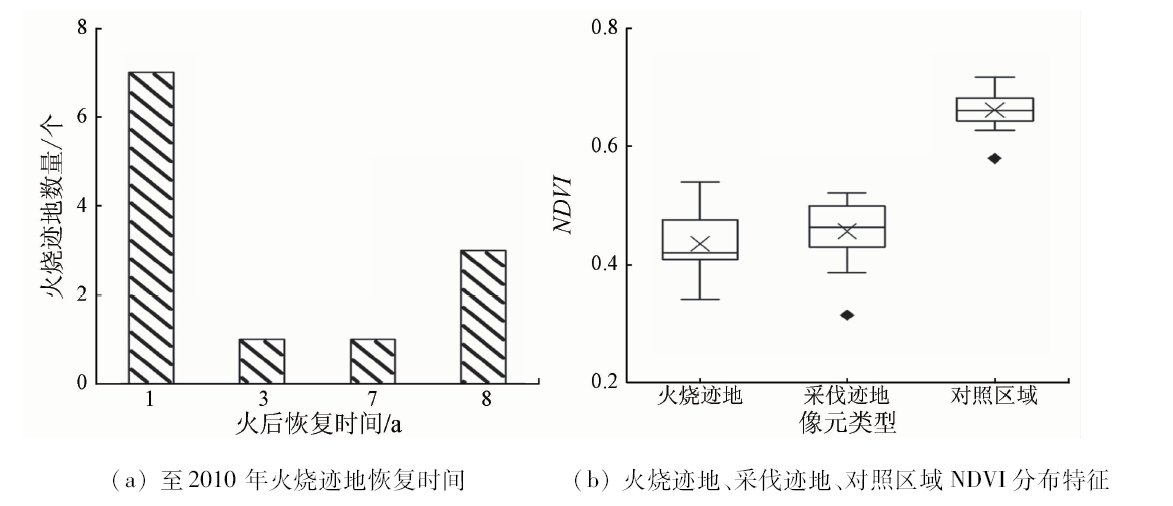
Vegetation index is an important approach in vegetation monitoring and investigation. SAR data are free with weather condition observing data day and night. Building relationships between SAR data and vegetation indices can contribute to fusing two data to improve temporal monitoring in forest of mountain areas. Therefore, the authors made a statistical analysis between vegetation indices including NDVI, EVI, GVI, NDWI and C band SAR data and then made a comparison about difference of correlation between NDVI, NDWI and X, C, L band SAR data in different forest disturbances in Genhe forest region of Da Hinggan Mountains in Inner Mongolia. The results are as follows: ①PR and interferometry coefficients both have significant negative correlations with optical vegetation indices, PR has strong linear correlations with NDVI, EVI, GVI (R2=0.40~0.49), and interferometry coefficients have strong linear correlations with all optical indices (R2=0.43~0.51). ②Ground cover can affect linear regression between VH and NDVI. Scrub-grass land and fires scars with thick vegetation layer and forest land have a strong linear correlation with NDVI (R2=0.64~0.76). ③The correlations are different for different forest disturbances: In fires scars, NDVI has significant negative correlations with X- band HH, and C band PR and NDWI have a significant positive correlation with C band VH. In deforestation areas, L-band PR has significant negative correlations with NDVI, and L band VV and VH have significant positive correlations with NDWI. In undisturbed forest land, C-band PR has significant negative correlations with NDVI and NDWI.
王川, 范景辉, 林思美, 饶月明, 黄华国. 光学遥感植被指数与SAR遥感参数的相关性及其主要影响因素研究[J]. 国土资源遥感, 2020, 32(2): 130-137.
Chuan WANG, Jinghui FAN, Simei LIN, Yueming RAO, Huaguo HUANG. Study of the correlation between optical vegetation index and SAR data and the main affecting factors. Remote Sensing for Land & Resources, 2020, 32(2): 130-137.
Xue J, Yu L F, Lin Q N, Using Sentinel-1 multi-temporal InSAR data to monitor the damage degree of shoot beetle in Yunnan pine forest.Remote Sensing for Land and Resources. 2018,30(4):111-117.doi: 10.6046/gtzyyg.2018.04.17.
[3]
Reiche J, Verbesselt J, Hoekman D, et al. Fusing Landsat and SAR time series to detect deforestation in the tropics[J]. Remote Sensing of Environment, 2015,156(156):276-293.
doi: 10.1016/j.rse.2014.10.001
[4]
Capodici F, D’urso G, Maltese A. Investigating the relationship between X-band SAR data from COSMO-SkyMed satellite and NDVI for LAI detection[J]. Remote Sensing, 2013,5(3):1389-1404.
[5]
Gebhardt S, Huth J, Nguyen L D, et al. A comparison of TerraSAR-X Quadpol backscattering with RapidEye multispectral vegetation indices over rice fields in the Mekong Delta,Vietnam[J]. International Journal of Remote Sensing, 2012,33(24):7644-7661.
[6]
Stendardi L, Karlsen S R, Niedrist G, et al. Exploiting time series of Sentinel-1 and Sentinel-2 imagery to detect meadow phenology in mountain regions[J]. Remote Sensing, 2019,11(5):542.
[7]
Baghdadi N, Boyer N, Todoroff P, et al. Potential of SAR sensors TerraSAR-X,ASAR/ENVISAT and PALSAR/ALOS for monitoring sugarcane crops on Reunion Island[J]. Remote Sensing of Environment, 2009,113(8):1724-1738.
[8]
Wang X, Ge L, Li X. Pasture monitoring using SAR with Cosmo-skymed,Envisat ASAR,and ALOS PALSAR in Otway,Australia[J]. Remote Sensing, 2013,5(7):3611-3636.
doi: 10.3390/rs5073611
[9]
Tanase M A, Santoro M, De l R J, et al.Sensitivity of X-,C-,and L-band SAR backscatter to burn severity in mediterranean pine forests[J]. IEEE Transactions on Geoscience and Remote Sensing, 2010,48(10):3663-3675.
Gao Y N, Zhang W C. Comparison test and research progress of topographic correction on remotely sensed data[J]. Geographical Research, 2008,27(2):467-477.
[11]
Lievens H, Verhoest N E C.On the Retrieval of soil moisture in wheat fields from L-band SAR based on water cloud modeling,the IEM,and effective roughness parameters[J]. IEEE Geoscience and Remote Sensing Letters, 2011,8(4):740-744.
doi: 10.1109/LGRS.2011.2106109
[12]
Rouse J W, Haas R H, Schell J A, et al. Monitoring vegetation systems in the great plains with ERTS[J]. NASA Special Publication, 1973,351:309.
[13]
Hui Q L, Huete A. Feedback based modification of the NDVI to minimize canopy background and atmospheric noise[J]. IEEE Transactions on Geoscience and Remote Sensing, 1995,33(2):457-465.
doi: 10.1109/TGRS.36
[14]
Baig M H A, Zhang L, Tong S, et al. Derivation of a tasselled cap transformation based on Landsat8 at-satellite reflectance[J]. Remote Sensing Letters, 2014,5(5):423-431.
doi: 10.1080/2150704X.2014.915434
[15]
Gao B C. NDWI—A normalized difference water index for remote sensing of vegetation liquid water from space[J]. Remote sensing of Environment, 1996,58(3):257-266.
doi: 10.1016/S0034-4257(96)00067-3
Hou X H, Liu S H, Gao S, et al. Comparison between Prosail model and Landsat8 images in inversion of water content of wheat canopy[J]. Journal of Triticeae Crops, 2018,38(4):493-497.
[17]
Woodhouse I H. 微波遥感导论[M]. 北京: 科学出版社, 2014.
Woodhouse I H. Introduction to microwave remote sensing[M]. Beijing: Science Press, 2014.
[18]
王超, 张红, 刘智. 星载合成孔径雷达干涉测量[M]. 北京: 科学出版社, 2002.
Wang C, Zhang H, Liu Z. Spaceborne synthetic aperture Radar interferometry[M]. Beijing: Science Press, 2002.
[19]
Jung J, Yun S H, Kim D J, et al. Damage-mapping algorithm based on coherence model using multitemporal polarimetric-interferometric SAR data[J]. IEEE Transactions on Geoscience and Remote Sensing, 2018,56(3):1520-1532.
doi: 10.1109/TGRS.2017.2764748
[20]
Ulaby F T. Handbook of Radar scattering statistics for terrain[M]. Norwood,MA:Artech House, 1989.
[21]
Enquist B J, Niklas K J. Global allocation rules for patterns of biomass partitioning in seed plants[J]. Science, 2002,295(5559):1517-1520.
[22]
West G B, Enquist B J, Brown J H. A general quantitative theory of forest structure and dynamics[J]. Proceedings of the National Academy of Sciences, 2009,106(17):7040-7045.
[23]
Huang H, Zhang Z, Ni W, et al. Extending RAPID model to simulate forest microwave backscattering[J], Remote Sensing of Environment, 2018,217:272-291.
doi: 10.1016/j.rse.2018.08.011
 2020, Vol. 32
  )
)