Origin of surface substrate for soil salinization and alkalization in the Songnen Plain
MA Min1,2(), ZUO Zhen3,4, HAN Yandong3,4, QIU Ye3,4, QIAO Mudong3,4()
1. Key Laboratory of Coupling Process and Effect of Natural Resources Elements, Ministry of Natural Resources, Beijing 100055, China 2. Integrated Natural Resources Survey Center, China Geological Survey, Beijing 100055, China 3. Hohhot General Survey of Natural Resources Center, China Geological Survey, Hohhot 010010, China 4. Innovation Base for Yellow River-Big Black River Water Resources Development and Eco-Environmental Effect, Hohhot 010010, China
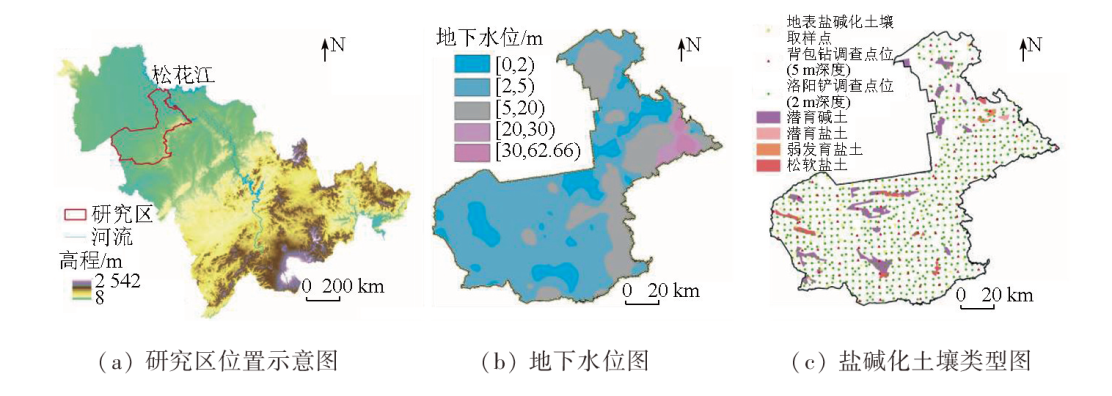
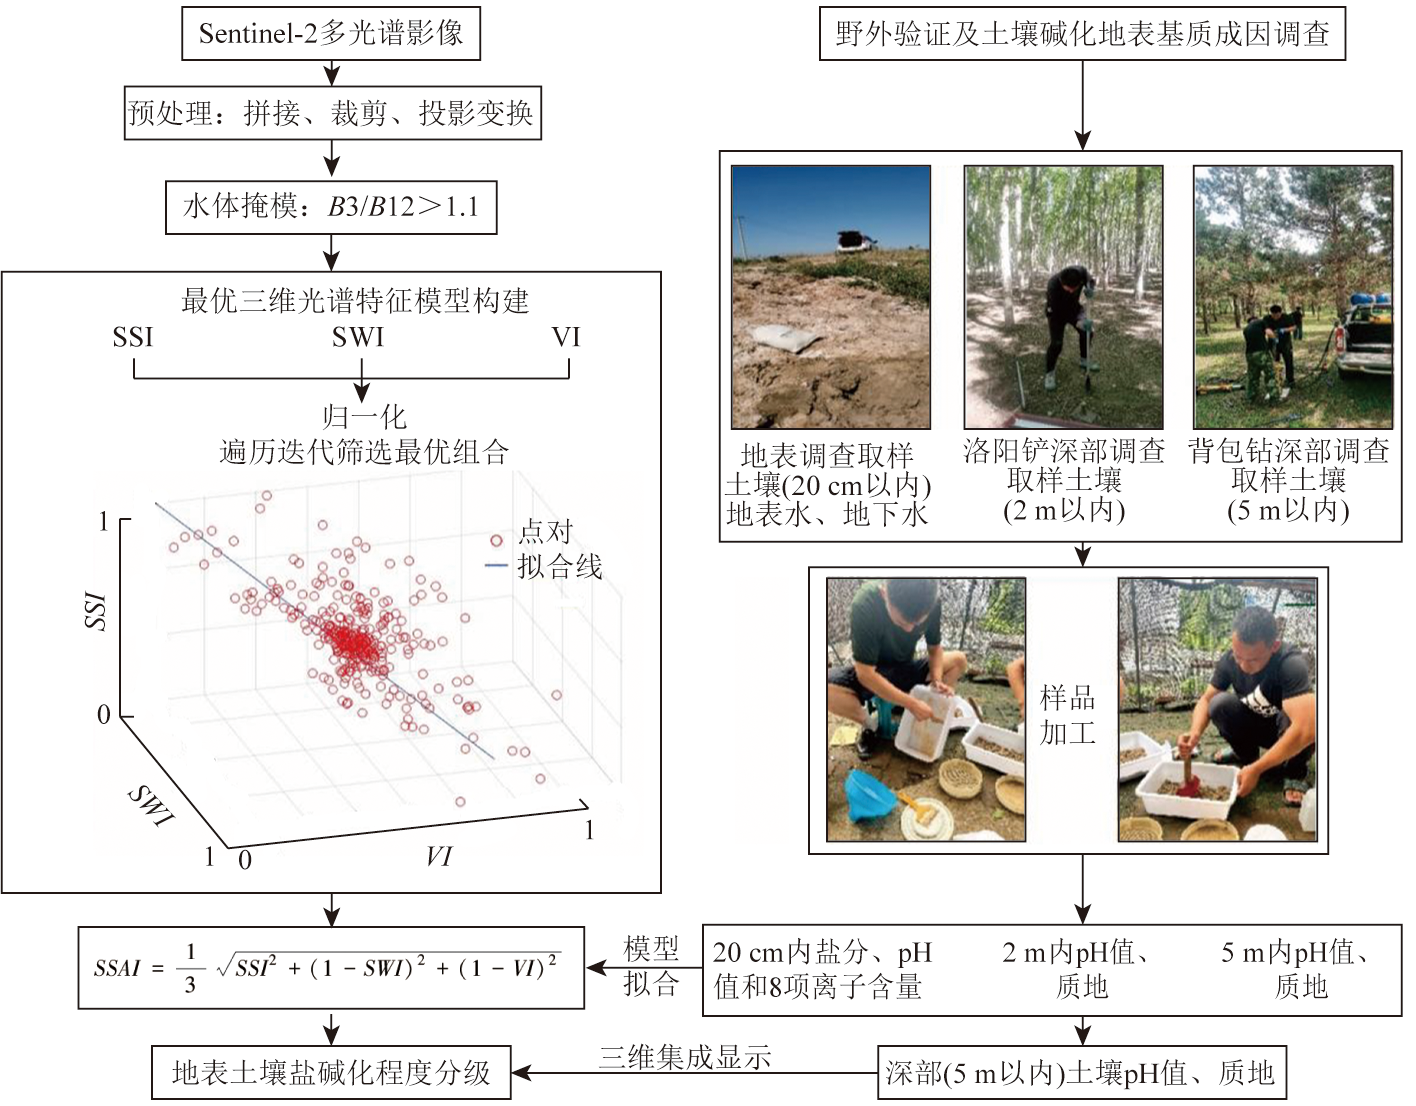
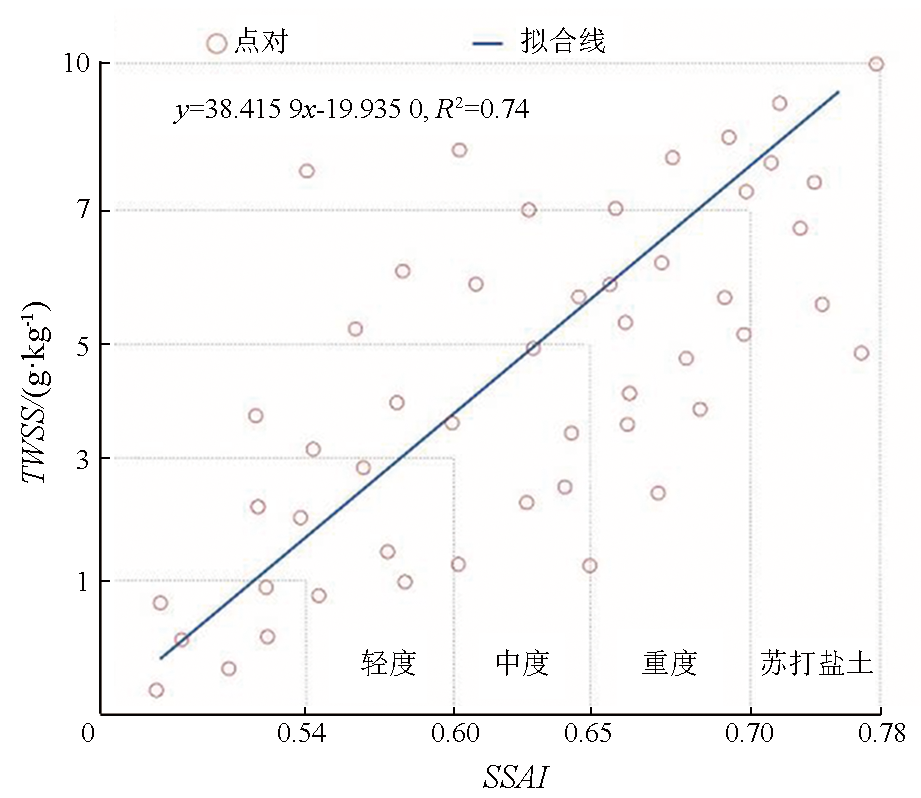
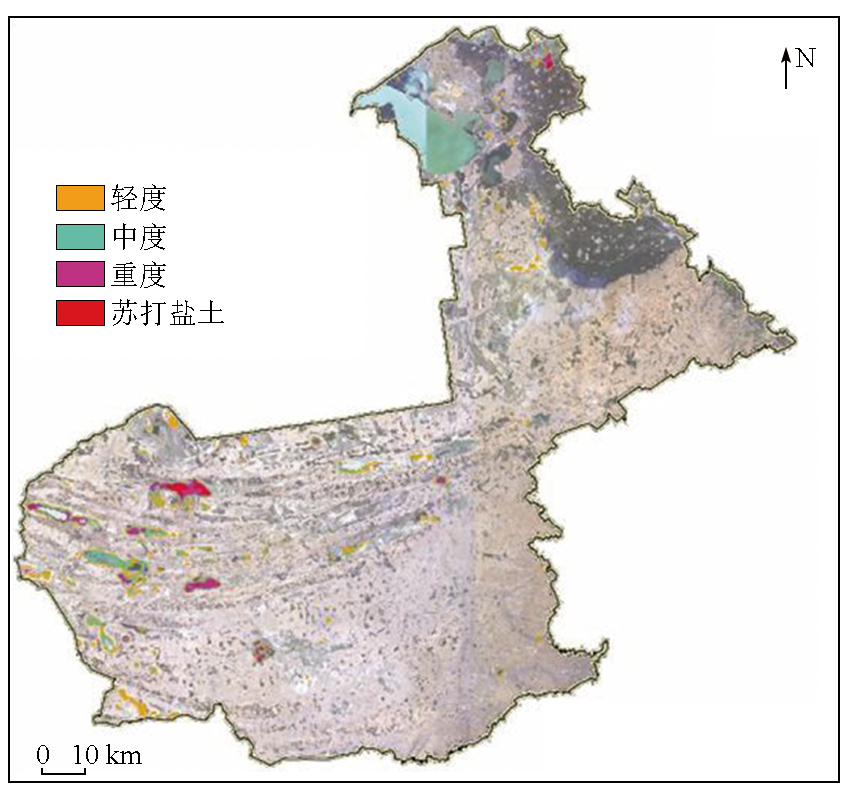
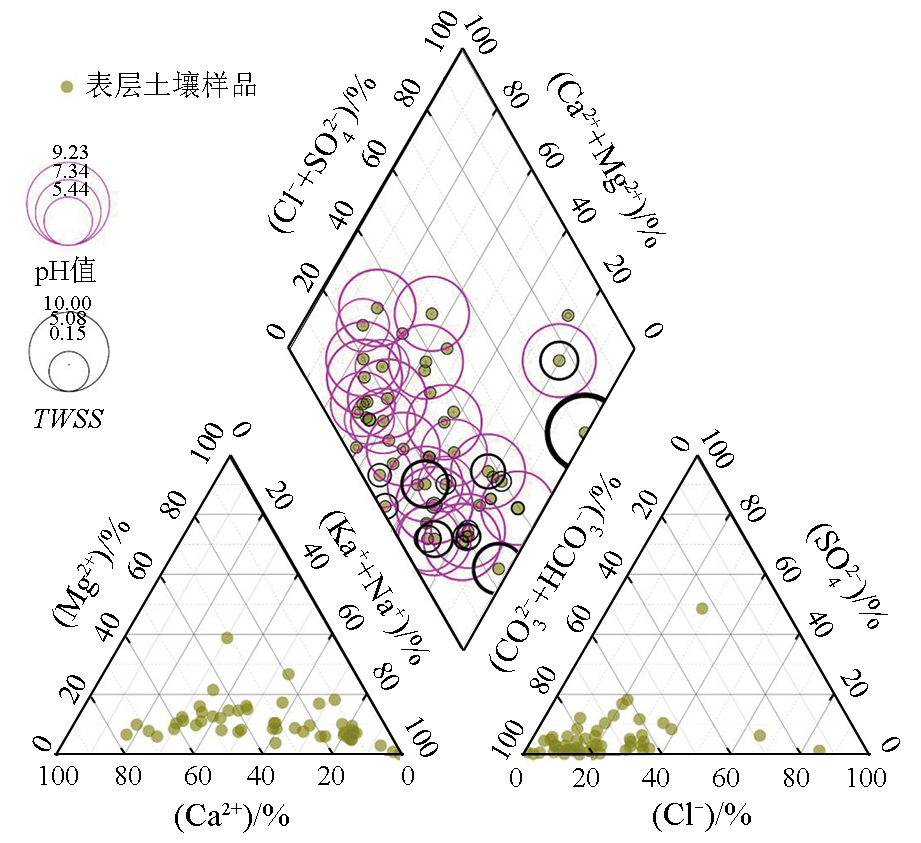
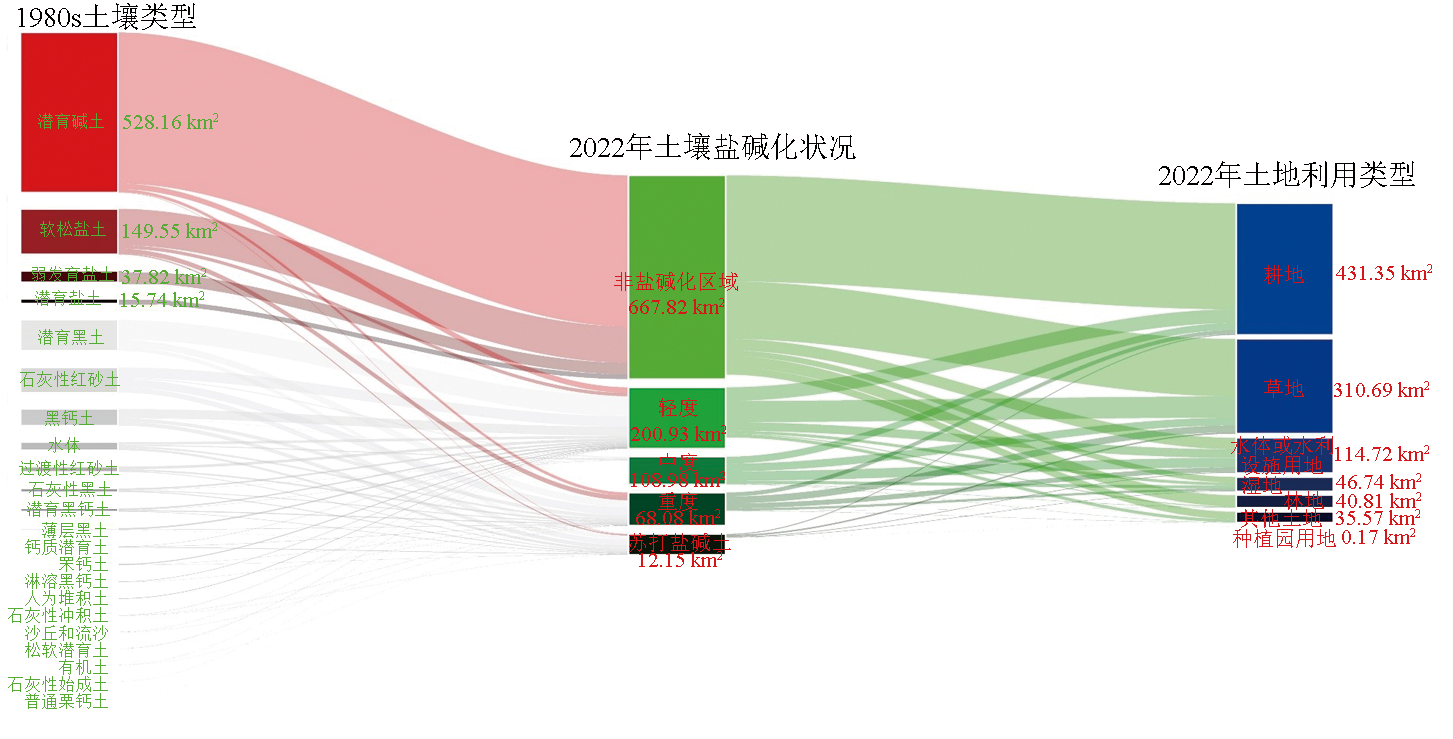
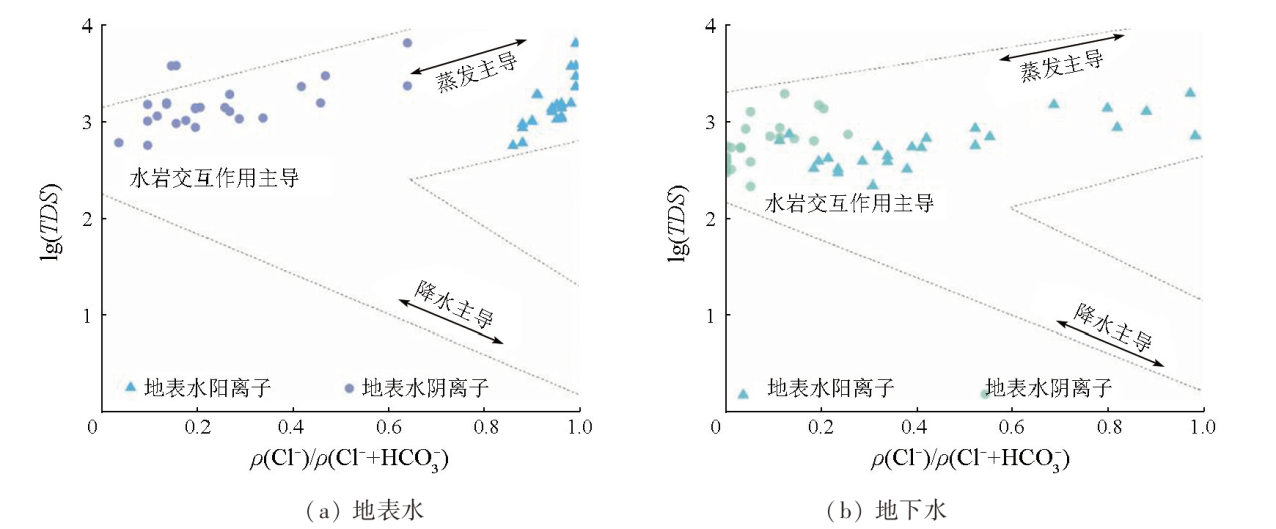
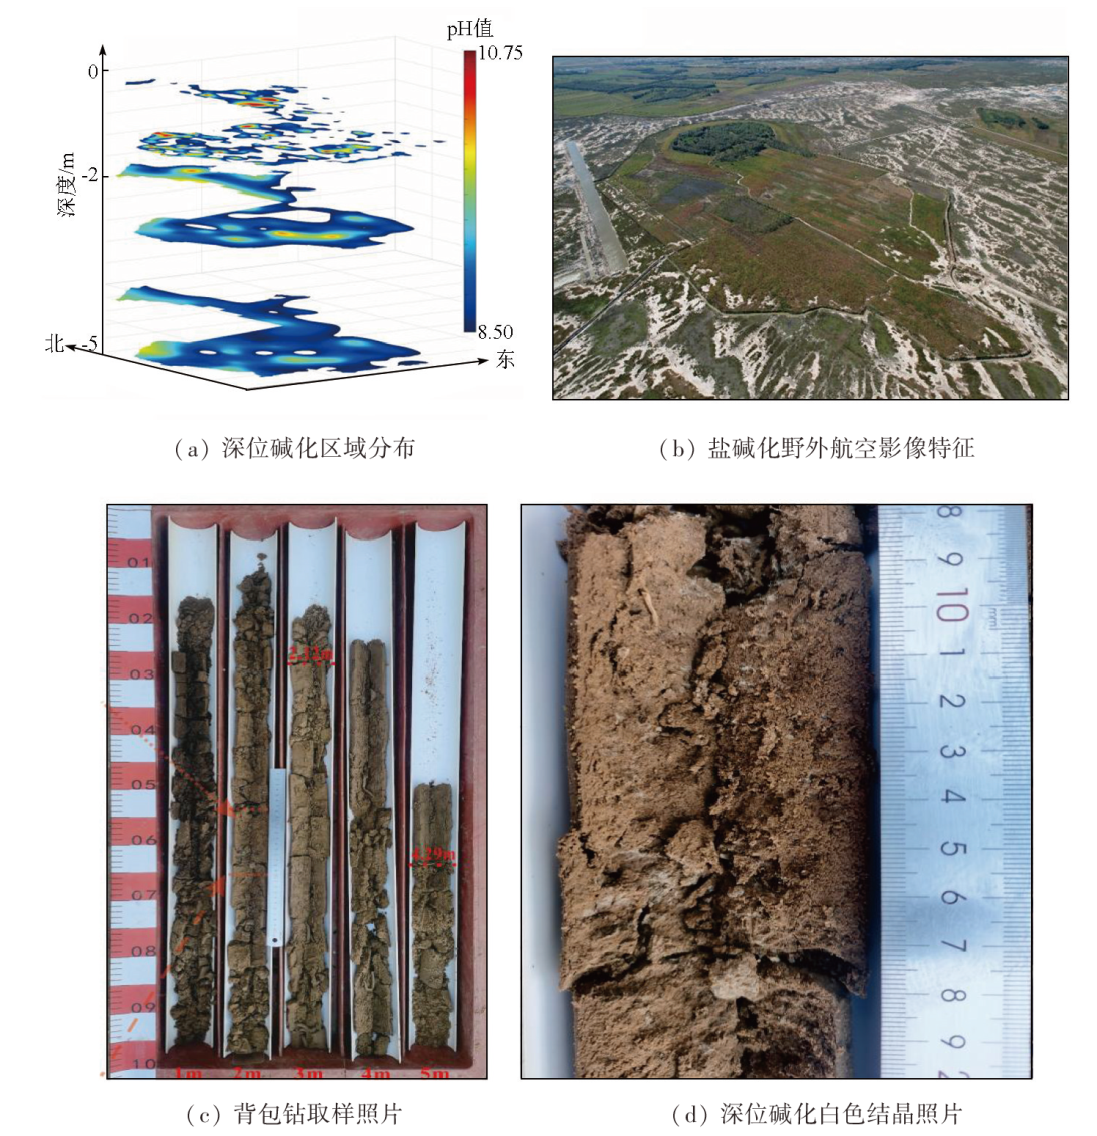
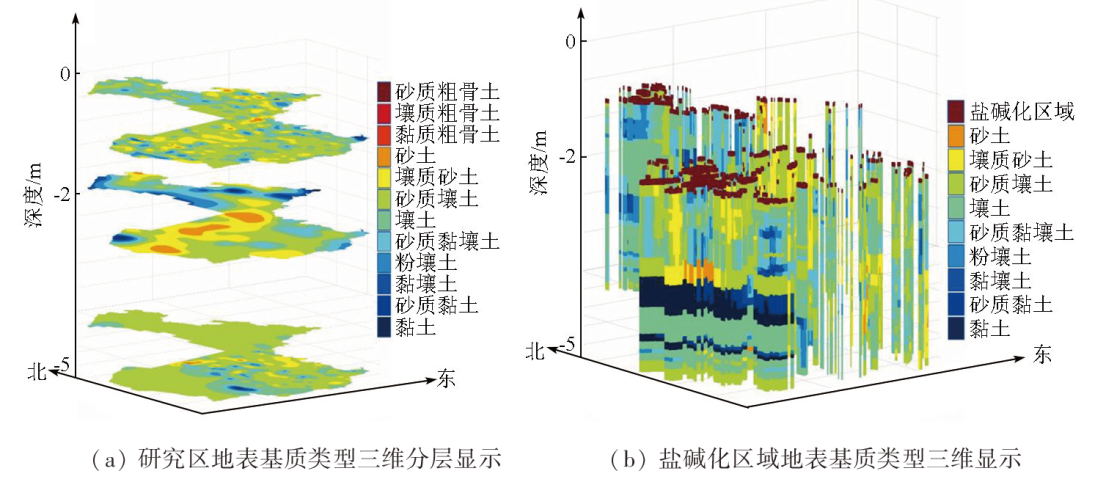
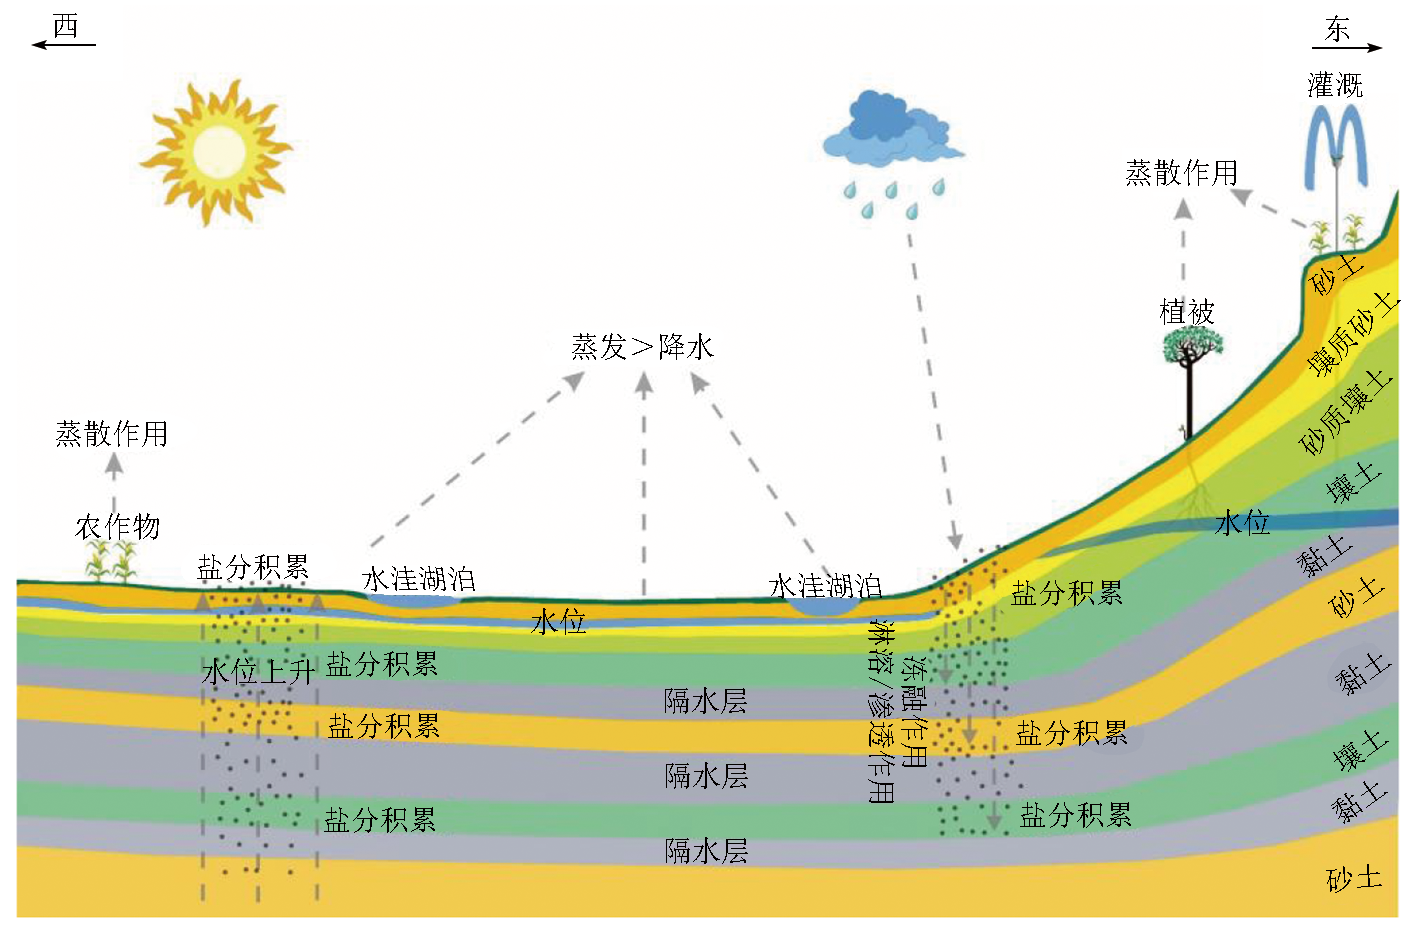
To determine the origin of surface substrate for soil salinization and alkalization in the Songnen Plain, this study investigated Songyuan City based on Sentinel-2 multispectral images. Considering various commonly used indices like the soil salinity index (SSI), soil water index (SWI), and vegetation index (VI), this study constructed the optimal 3D spectral feature model to calculate the soil salinization-alkalization index (SSAI) for inversion of the soil salinization-alkalization status. Surface water and groundwater in areas subjected to soil salinization and alkalization were sampled to test their salt ion concentrations, followed by the analysis of salt ion sources according to the groundwater levels. The surface substrate was explored through planar grid layout and vertical stratified sampling. A total of 2 362 soil samples were collected in various layers within a depth of 5 m to test their pH and texture for the construction of a 3D surface substrate model. The results of this study reveal a positive linear correlation between the inversion result of remote sensing data and the topsoil salt content (coefficient of determination: R2=0.74). The study area was characterized by alkalization of sodium bicarbonate, with soil salt ions originating primarily from groundwater. The deep multilayer argillaceous soils acted as an aquiclude to prevent the downward infiltration, migration, and dilution of salt ions along with water. This surface substrate condition serves as the objective cause of soil salinization and alkalization in the study area.
马敏, 左震, 韩燕东, 邱野, 乔牡冬. 松嫩平原土壤盐碱化地表基质成因研究[J]. 自然资源遥感, 2025, 37(2): 128-139.
MA Min, ZUO Zhen, HAN Yandong, QIU Ye, QIAO Mudong. Origin of surface substrate for soil salinization and alkalization in the Songnen Plain. Remote Sensing for Natural Resources, 2025, 37(2): 128-139.
Ivushkin K, Bartholomeus H, Bregt A K, et al. Global mapping of soil salinity change[J]. Remote Sensing of Environment, 2019, 231:111260.
[2]
FAO. Global map of salt affected soils version 1.0[EB/OL]. [2023-10-17]. https://www.fao.org/soils-portal/data-hub/soil-maps-and-databases/global-map-of-salt-affected-soils/en/.
[3]
Setia R, Gottschalk P, Smith P, et al. Soil salinity decreases global soil organic carbon stocks[J]. Science of the Total Environment, 2013, 465:267-272.
[4]
刘兴土. 松嫩平原退化土地整治与农业发展[M]. 北京: 科学出版社, 2001: 15-350.
Liu X T. Regulation and agricultural development of degraded land in Songnen Plain[M]. Beijing: Science Press, 2001: 15-350.
Yang F, Luo J M, Wang Z C. Water-salt transformation law and regulation mechanism in salinization area of Songnen Plain[M]. Beijing: China Environmental Science Press, 2014:15-201.
[6]
王遵亲. 中国盐渍土[M]. 北京: 科学出版社, 1993.
Wang Z Q. Saline soil in China[M]. Beijing: Science Press, 1993.
[7]
Zaman M, Shahid S A, Heng L. Guideline for salinity assessment,mitigation and adaptation using nuclear and related techniques[M]. Cham,Switzerland: Springer Open, 2018.
Zhao P M, Jia Z Q. Study on ecological management of saline-alkali land in west of Northeast Plain[J]. Water Resources & Hydropower of Northeast China, 2020, 38(5):47-49,72.
[9]
Everitt J, Escobar D, Gerbermann A H, et al. Detecting saline soils with video imagery[J]. Photogrammetric Engineering and Remote Sensing (USA), 1988, 54(9):1283-1287.
[10]
Metternicht G, Zinck J A. Spatial discrimination of salt- and sodium-affected soil surfaces[J]. International Journal of Remote Sensing, 1997, 18(12):2571-2586.
[11]
Bell D, Menges C, Ahmad W, et al. Vegetation correction of airSAR data for mapping soil salinity in a tropical coastal environment[J]. Annual Congress of the Australian Society for Liminology, 2000:78-78.
[12]
Salcedo F P, Cutillas P P, Cabañero J J A, et al. Use of remote sensing to evaluate the effects of environmental factors on soil salinity in a semi-arid area[J]. Science of the Total Environment, 2022, 815:152524.
[13]
Zhang Y, Hou K, Qian H, et al. Characterization of soil salinization and its driving factors in a typical irrigation area of Northwest China[J]. Science of the Total Environment, 2022, 837:155808.
Zhang Q L, Hu J, Gao Y Z, et al. Spatiotemporal variations of soil water and saline-alkali in compound ecosystem of sand and mea-dow in the Songnen Plain[J]. Chinese Agricultural Science Bulletin, 2021, 37(20):49-58.
Lu J, Zhang X J, Ye P S, et al. Remote sensing monitoring of salinization in Hetao irrigation district based on SI-MSAVI feature space[J]. Remote Sensing for Land and Resources, 2020, 32(1):169-175.doi:10.6046/gtzyyg.2020.01.23.
Zhang S Y, Yue C, Yuan G L, et al. Salinization inversion model based on ENDVI-SI3 characteristic space and risk assessment[J]. Remote Sensing for Natural Resources, 2022, 34(4):136-143.doi:10.6046/zrzyyg.2021349.
[17]
Suweis S, Rinaldo A, Van der Zee A T M, et al. Stochastic modeling of soil salinity[J]. Geophysical Research Letters, 2010, 37(7):1-5.
[18]
Perri S, Molini A, Hedin L O, et al. Contrasting effects of aridity and seasonality on global salinization[J]. Nature Geoscience, 2022, 15:375-381.
[19]
张殿发. GIS支持下的吉林西部平原土地盐碱化研究[D]. 长春: 长春科技大学, 2000.
Zhang D F. Study on soil salinization in the western plain of Jilin Province based on GIS[D]. Changchun: Changchun University of Science and Technology, 2000.
Lin N F, Bounlom V, Tang J, et al. Study on the relation between the formation of saline-alkali soil and the Neotectonic Movement[J]. World Geology, 2005, 24(3):282-288,311.
[21]
方洪宾. 松辽平原第四纪地质环境与黑土退化[M]. 北京: 地质出版社, 2009.
Fang H B. Quaternary geological environment and black soil degradation in Songliao Plain[M]. Beijing: Geological Publishing House, 2009.
[22]
Han Y, Ge H, Xu Y, et al. Estimating soil salinity using multiple spectral indexes and machine learning algorithm in Songnen Plain,China[J]. IEEE Journal of Selected Topics in Applied Earth Observations and Remote Sensing, 1912, 16:7041-7050.
[23]
Yu H, Wang Z, Mao D, et al. Spatiotemporal variations of soil salinization in China’s West Songnen Plain[J]. Land Degradation & Development, 2023, 34:2366-2378.
[24]
Fan Y, An F, Ma H, et al. Variations on soil salinity and sodicity and its driving factors analysis under microtopography in different hydrological conditions[J]. Water, 2016, 8:227.
[25]
Qin Y, Bai Y, Chen G, et al. The effects of soil freeze-thaw processes on water and salt migrations in the western Songnen Plain,China[J]. Scientific Reports, 2021, 11(1):3888.
Wang J K, Wang T Y, Zhang X D, et al. An approach to the changes of black soil quality (I): Changes of the indices of black soil with the year(s) of reclamation[J]. Journal of Shenyang Agricultural University, 2002, 33(1):43-47.
Zhan T, Zeng F M, Xie Y Y, et al. Magnetostratigraphic dating of a drill core from the Northeast Plain of China:Implications for the evolution of Songnen paleo-lake[J]. Chinese Science Bulletin, 2019, 64(11):1179-1190.
[28]
FAO. Harmonized world soil database v12.[EB/OL]. [2024-03-13]. https://www.fao.org/soils-portal/soil-survey/soil-maps-and-databases/harmonized-world-soil-database-v12/en/.
[29]
Steven M D, Malthus T J, Danson F M, et al. Monitoring responses of vegetation to stress[C]// 18th Annual Conference of the Remote Sensing Society Remote Sensing from Research to Operation, 1992:369-377.
[30]
Bastiaanssen W G M, Molden D J, Makin I W. Remote sensing for irrigated agriculture:Examples from research and possible applications[J]. Agricultural Water Management, 2000, 46(2):137-155.
[31]
Bannari A, Guedon A M, El-Harti A, et al. Characterization of slightly and moderately saline and sodic soils in irrigated agricultural land using simulated data of advanced land imaging (EO-1) sensor[J]. Communications in Soil Science and Plant Analysis, 2008, 39(19/20):2795-2811.
[32]
Zhang T T, Zeng S L, Gao Y, et al. Using hyperspectral vegetation indices as a proxy to monitor soil salinity[J]. Ecological Indicators, 2011, 11(6):1552-1562.
[33]
Khan N M, Rastoskuev V V, Sato Y, et al. Assessment of hydrosaline land degradation by using a simple approach of remote sensing indicators[J]. Agricultural Water Management, 2005, 77(1/2/3):96-109.
[34]
Allbed A, Kumar L, Aldakheel Y Y. Assessing soil salinity using soil salinity and vegetation indices derived from IKONOS high-spatial resolution imageries:Applications in a date palm dominated region[J]. Geoderma, 2014, 230:1-8.
[35]
Zewdu S, Suryabhagavan K V, Balakrishnan M. Geo-spatial approach for soil salinity mapping in Sego Irrigation Farm,South Ethiopia[J]. Journal of the Saudi Society of Agricultural Sciences, 2017, 16(1):16-24.
Zhao R, Cui X M, Liu C. Inversion estimation of soil organic matter content based on GF-5 hyperspectral remote sensing image[J]. China Environmental Science, 2020, 40(8):3539-3545.
[37]
Abuelgasim A, Ammad R. Mapping soil salinity in arid and semi-arid regions using Landsat 8 OLI satellite data[J]. Remote Sensing Applications:Society and Environment, 2019, 13:415-425.
[38]
Al-Khaier F. Soil salinity detection using satellite remote sensing[Z]. Enschede in Netherlands:International Institute for Geo-information Science and Earth Observation, 2003.
[39]
Bouaziz M, Matschullat J, Gloaguen R. Improved remote sensing detection of soil salinity from a semi-arid climate in Northeast Brazil[J]. Comptes Rendus Geoscience, 2011, 343(11/12):795-803.
[40]
Tran T V, Tran D X, Myint S W, et al. Examining spatiotemporal salinity dynamics in the Mekong River Delta using Landsat time series imagery and a spatial regression approach[J]. Science of the Total Environment, 2019, 687:1087-1097.
[41]
El Kader Douaoui A, Nicolas H, Walter C. Detecting salinity hazards within a semiarid context by means of combining soil and remote-sensing data[J]. Geoderma, 2006, 134(1/2):217-230.
[42]
Allbed A, Kumar L, Sinha P. Soil salinity and vegetation cover change detection from multi-temporal remotely sensed imagery in Al Hassa Oasis in Saudi Arabia[J]. Geocarto International, 2018, 33(8):830-846.
[43]
Abbas A, Khan S. Using remote sensing techniques for appraisal of irrigated soil salinity[C]// MODSIM07-Land, Water and Environmental Management: Integrated Systems for Sustainability,Proceedings, 2007:2632-2638.
[44]
Abbas A, Khan S, Hussain N, et al. Characterizing soil salinity in irrigated agriculture using a remote sensing approach[J]. Physics and Chemistry of the Earth,Parts A/B/C, 2013, 55:43-52.
[45]
Li X, Li Y, Wang B, et al. Analysis of spatial-temporal variation of the saline-sodic soil in the west of Jilin Province from 1989 to 2019 and influencing factors[J]. CATENA, 2022, 217:106492.
[46]
Scudiero E, Skaggs T H, Corwin D L. Regional scale soil salinity evaluation using Landsat 7,western San Joaquin Valley,California,USA[J]. Geoderma Regional, 2014, 2:82-90.
[47]
Masoud A A, Koike K. Arid land salinization detected by remotely-sensed landcover changes:A case study in the Siwa region,NW Egypt[J]. Journal of Arid Environments, 2006, 66(1):151-167.
[48]
Wang J, Ding J, Yu D, et al. Machine learning-based detection of soil salinity in an arid desert region,Northwest China:A comparison between Landsat8 OLI and Sentinel-2 MSI[J]. Science of the Total Environment, 2020, 707:136092.
[49]
Sadeghi M, Jones S B, Philpot W D. A linear physically-based model for remote sensing of soil moisture using short wave infrared bands[J]. Remote Sensing of Environment, 2015, 164:66-76.
[50]
Wang L, Qu J J. NMDI:A normalized multi-band drought index for monitoring soil and vegetation moisture with satellite remote sensing[J]. Geophysical Research Letters, 2007, 34(20):1-5.
[51]
Maffei C, Leone A P, Vella M, et al. Retrieval of vegetation moisture indicators for dynamic fire risk assessment with simulated MODIS radiance[C]// 2007 IEEE International Geoscience and Remote Sensing Symposium.Barcelona,Spain.IEEE, 2007:4648-4651.
[52]
Xiao X, Boles S, Liu J, et al. Mapping paddy rice agriculture in Southern China using multi-temporal MODIS images[J]. Remote Sensing of Environment, 2005, 95(4):480-492.
[53]
Huete A R. A soil-adjusted vegetation index (SAVI)[J]. Remote Sensing of Environment, 1988, 25(3):295-309.
[54]
Pearson R, Miller L D. Remote mapping of standing crop biomass for estimation of the productivity of the shortgrass prairie,Pawnee National Grasslands,Colorado[J]. Remote Sensing of Environment,VIII, 1972:1357-1381.
[55]
Richardson A J, Wiegand C L. Distinguishing vegetation from soil background information[J]. Photogrammetric Engineering & Remote Sensing, 1977, 43(12):1541-1552.
[56]
Baret F, Guyot G. Potentials and limits of vegetation indices for LAI and APAR assessment[J]. Remote Sensing of Environment, 1991, 35(2/3):161-173.
[57]
Crist E P. A TM Tasseled Cap equivalent transformation for reflectance factor data[J]. Remote Sensing of Environment, 1985, 17(3):301-306.
[58]
Karavanova E I, Shrestha D P, Orlov D S. Application of remote sensing techniques for the study of soil salinity in semi-arid Uzbekistan[M]//Response to Land Degradation. Boca Raton: CRC Press, 2019:261-273.
[59]
Abrol I, Yadav J S P, Massoud F. Salt-affected soils and their management[M]. Rome,Italy: Food & Agriculture Organization, 1988,39.
[60]
Schoeneberger P, Wysocki D, Benham E, et al. Field book for describing and sampling soils,version 2.0[M]. Lincoln,OR,USA: Natural Resources Conservation Service,National Soil Survey Center, 2002:2-72.
[61]
Ibrakhimov M, Khamzina A, Forkutsa I, et al. Groundwater table and salinity:Spatial and temporal distribution and influence on soil salinization in Khorezm Region (Uzbekistan,Aral Sea Basin)[J]. Irrigation and Drainage Systems, 2007, 21(3):219-236.
[62]
Luo J, Yang F, Wang Y, et al. Mechanism of soil sodification at the local scale in Songnen Plain,Northeast China,as affected by shallow groundwater table[J]. Arid Land Research and Management, 2011, 25:234-256.
[63]
Yang F, Zhang G, Yin X, et al. Study on capillary rise from shallow groundwater and critical water table depth of a saline-sodic soil in western Songnen Plain of China[J]. Environmental Earth Sciences, 2011, 64(8):2119-2126.
 2025, Vol. 37
  ), 左震3,4, 韩燕东3,4, 邱野3,4, 乔牡冬3,4(