Please wait a minute...
 
自然资源遥感  2025, Vol. 37 Issue (2): 235-245    DOI: 10.6046/zrzyyg.2023370
  海岸带空间资源及生态健康遥感监测专栏 本期目录 | 过刊浏览 | 高级检索 |
基于GEE和时序主被动影像的广西北部湾红树林时空动态监测研究
邓建明1,2(), 姚航3, 付波霖3(), 顾森1, 唐婕1, 甘园园4
1.广西壮族自治区水文中心,南宁 530023
2.贵港水文中心,贵港 537110
3.桂林理工大学测绘地理信息学院,桂林 541006
4.广西沿海水文中心,钦州 535000
Monitoring the spatiotemporal dynamics of mangrove forests in Beibu Gulf, Guangxi Zhuang Autonomous Region, China, using Google Earth Engine and time-series active and passive remote sensing images
DENG Jianming1,2(), YAO Hang3, FU Bolin3(), GU Sen1, TANG Jie1, GAN Yuanyuan4
1. Hydrology Center of Guangxi Zhuang Autonomous Region, Nanning 530023, China
2. Guigang Hydrology Center, Guigang 537110, China
3. College of Geomatics and Geoinformation, Guilin University of Technology, Guilin 541006, China
4. Guangxi Coastal Hydrology Center, Qinzhou 535000, China
全文: PDF(7478 KB)   HTML  
输出: BibTeX | EndNote (RIS)      
摘要 红树林是生物多样性丰富、生产力最高的海洋生态系统之一。该文以广西北部湾为研究区,基于谷歌地球引擎(Google Earth Engine, GEE)云平台,以1985—2019年Landsat、Sentinel和PALSAR系列主被动影像为数据源,整合光谱波段、光谱指数、纹理特征、数字高程模型(digital elevation model,DEM)和后向散射系数等构建多源数据集并建立了14种分类方案,利用面向对象的随机森林算法构建红树林遥感识别模型,实现北部湾红树林长时间序列时空动态变化监测。结果表明: ①面向对象的随机森林算法对红树林具有较高的识别能力,其中2019年方案3获得最高的总体精度为96.3%,Kappa系数为0.956,比1995年方案1总体精度高16.3%,Kappa系数高0.195; ②不同分类方案对于北部湾不同地物的生产者精度和用户精度存在差异,其中红树林获得了最高的用户精度高于94.6%,生产者精度高于92.0%; ③1985—2019年北部湾红树林面积呈增加态势,年变化率为6.63%,红树林面积由内陆向沿海区域扩张。本文结果为保护红树林可持续管理提供参考,验证了基于GEE云平台开展红树林长期时空动态变化监测的可行性。
服务
把本文推荐给朋友
加入引用管理器
E-mail Alert
RSS
作者相关文章
邓建明
姚航
付波霖
顾森
唐婕
甘园园
关键词 北部湾红树林Google Earth Engine主被动影像随机森林算法动态监测    
Abstract

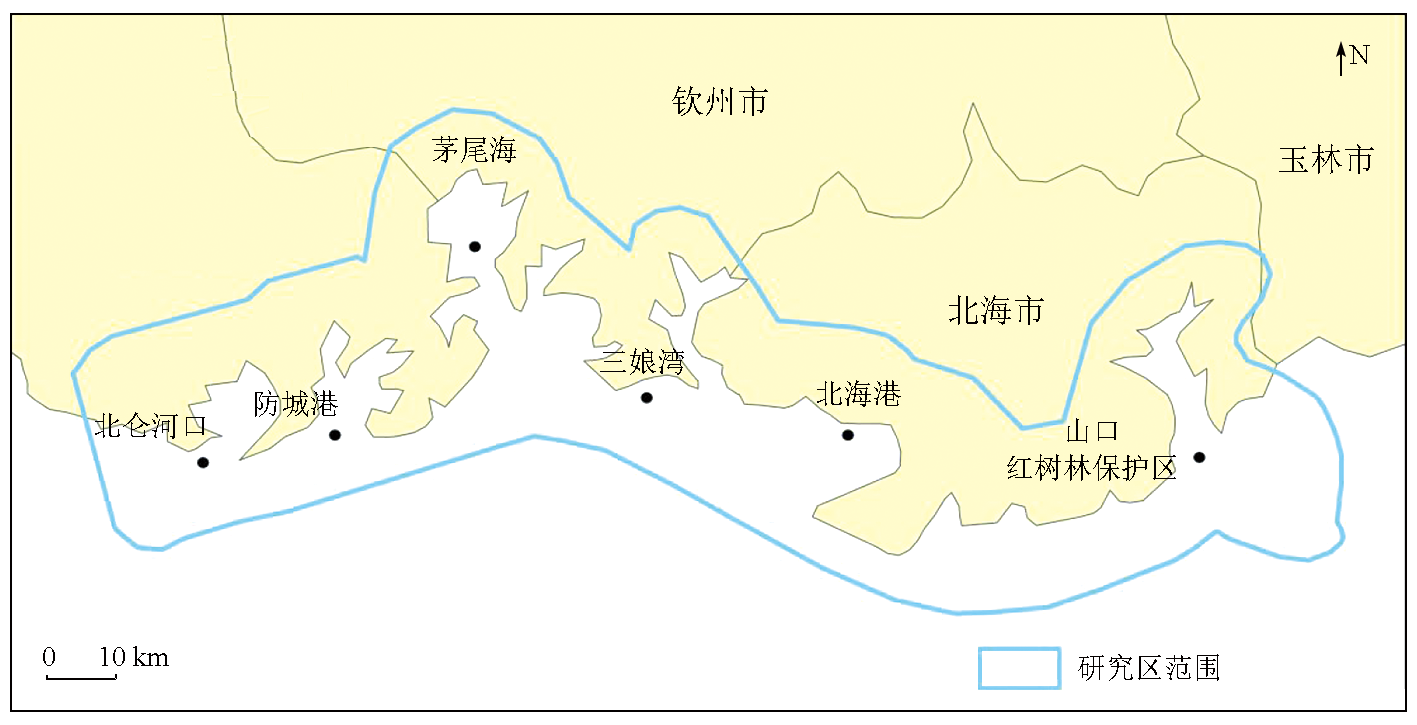
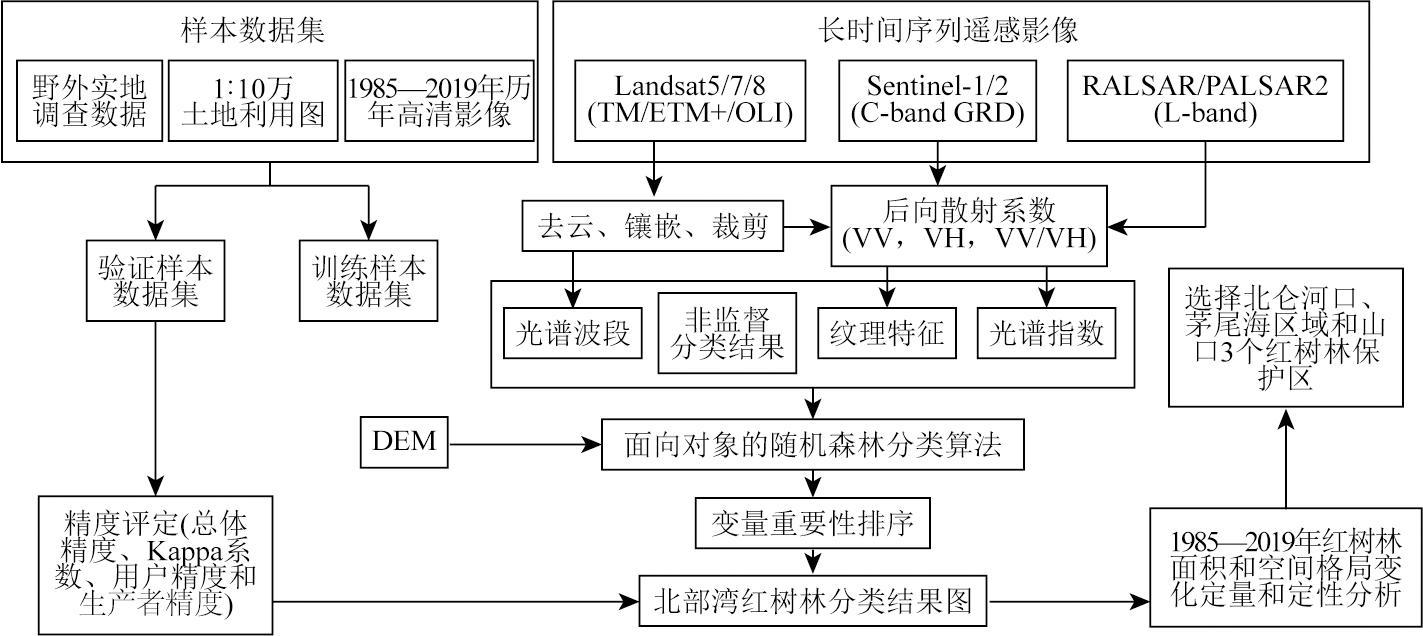
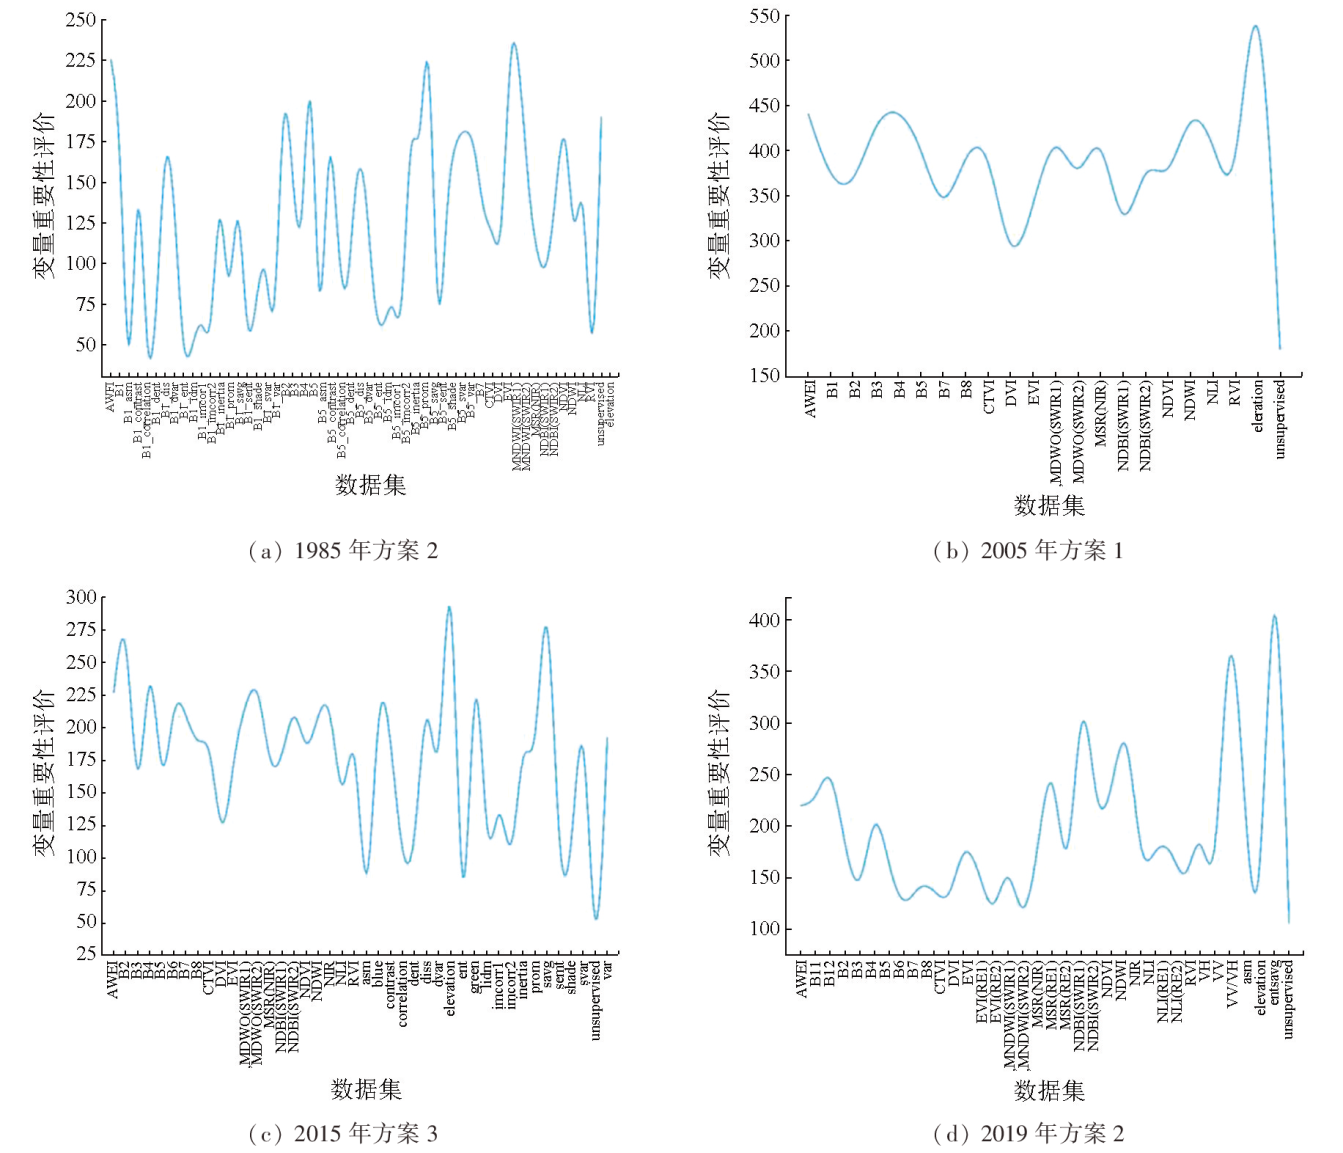
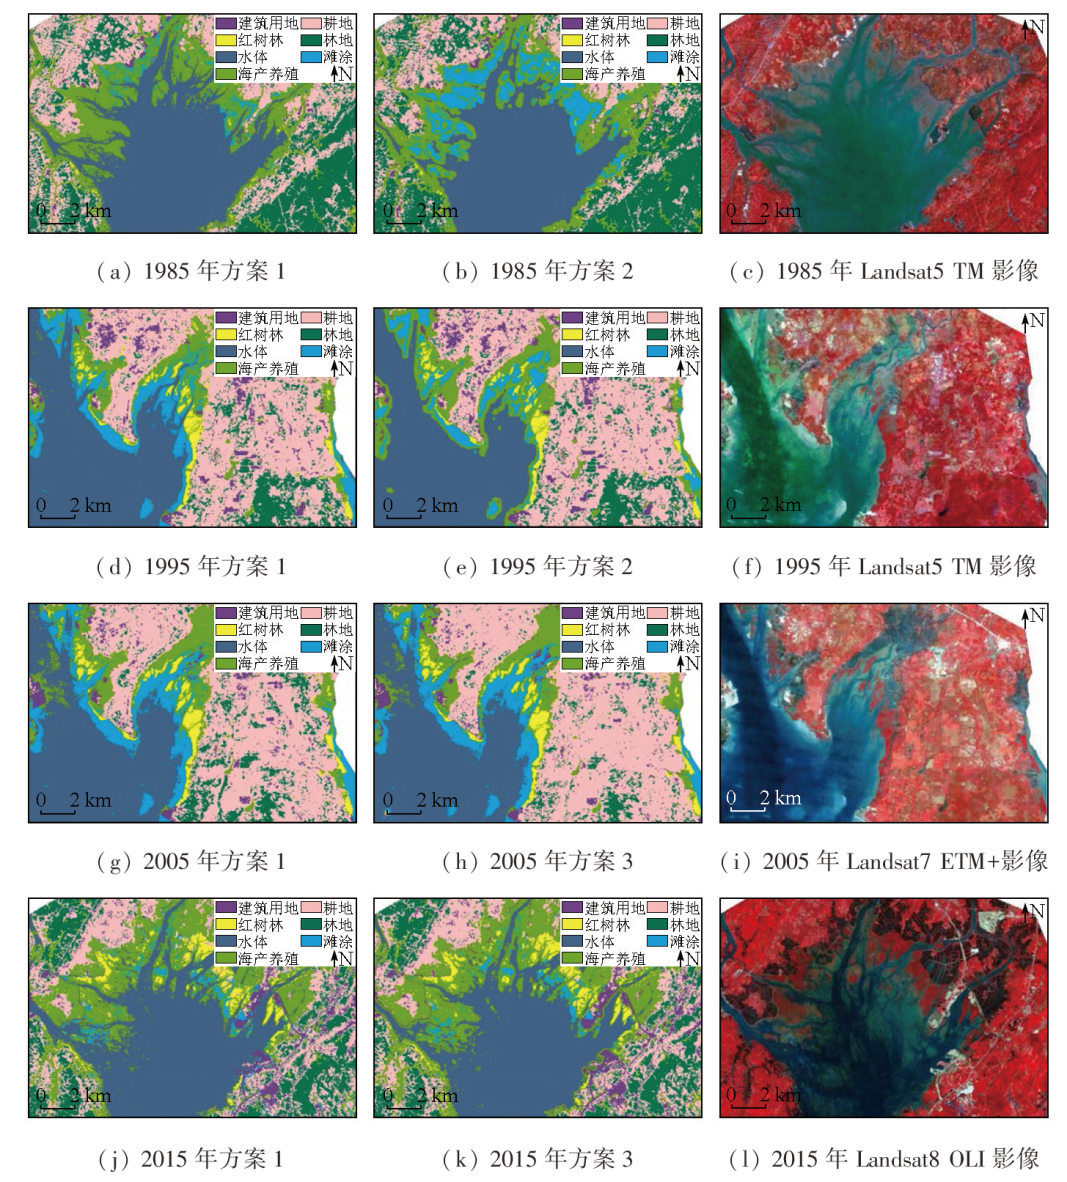
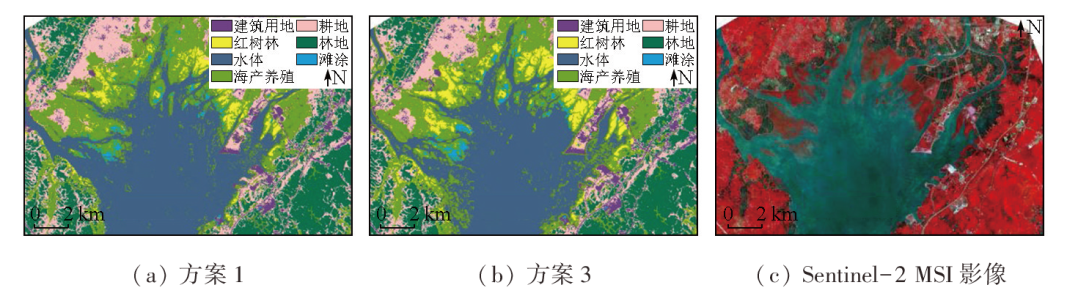
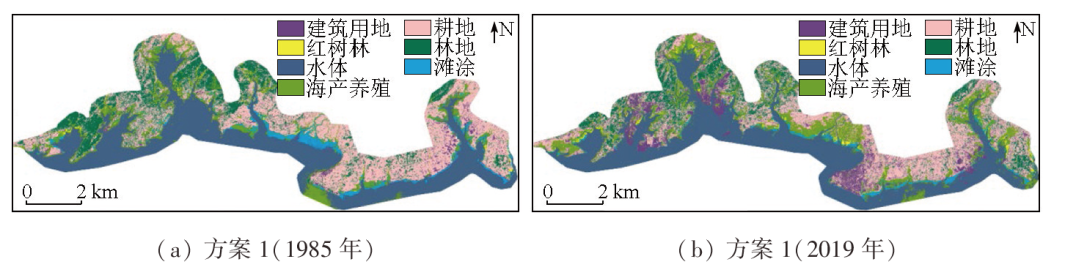
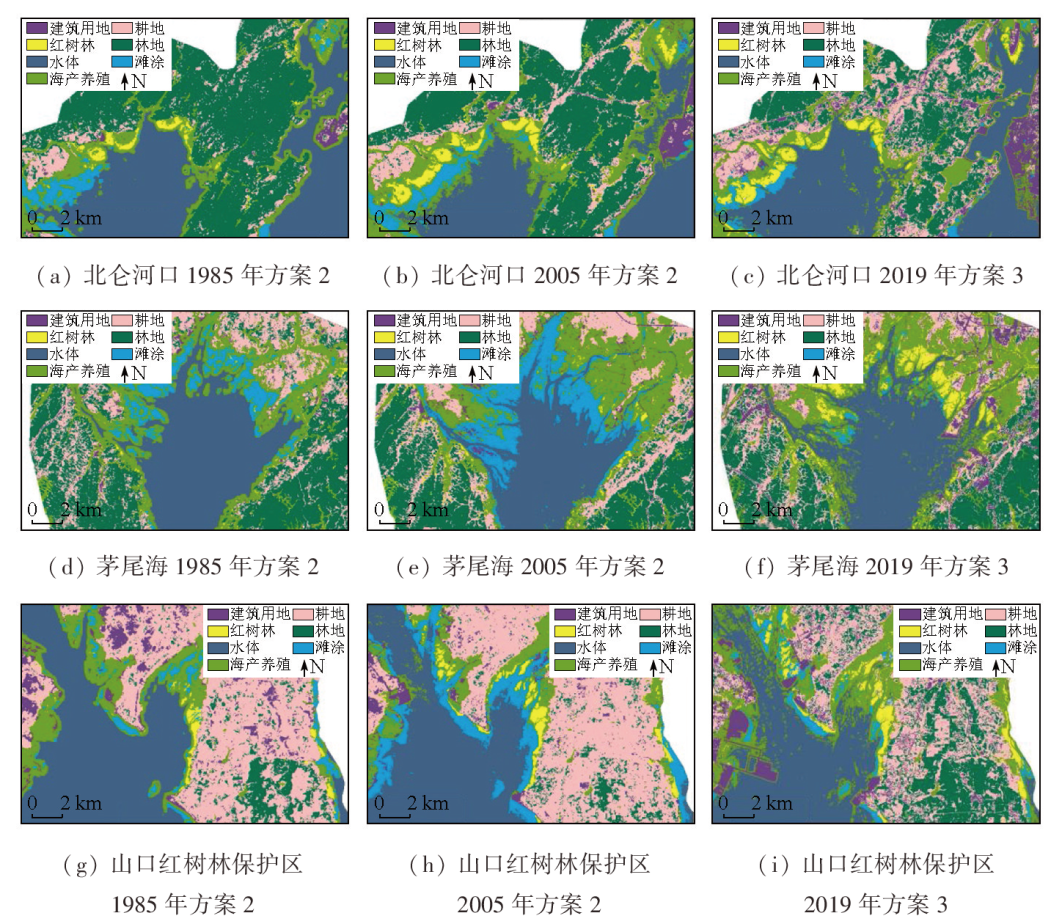
Mangrove forests are recognized as one of the most biodiverse and productive marine ecosystems globally. This study investigated Beibu Gulf, Guangxi Province. Using Landsat, Sentinel, and PALSAR SAR images from 1985 to 2019 as data sources, as well as the Google Earth Engine (GEE) cloud platform, this study established a multisource dataset by integrating spectral bands, spectral indices, texture features, digital elevation models (DEMs), and backscatter coefficients. Furthermore, 14 classification schemes were developed, and a mangrove remote sensing recognition model was built using an object-based random forest (RF) algorithm. Accordingly, the long-time-series spatiotemporal dynamics of mangrove forests in Beibu Gulf were monitored. The monitoring results show that the object-based RF algorithm demonstrates a high ability to identify mangrove forests. Specifically, Scheme 3 combined with data from 2019 yielded the highest overall accuracy (96.3%) and a kappa coefficient of 0.956, which are 16.3% and 0.195 higher than those of Scheme 1 combined data from 1995, respectively. The classification schemes differed in the producer’s and user’s accuracy of different surface features in the Beibu Gulf. Specifically, these schemes yielded the highest user’s and producer’s accuracy of mangrove forests exceeding 94.6% and 92.0%, respectively. From 1985 to 2019, the area of mangrove forests in Beibu Gulf showed an increasing trend, with an annual changing rate of 6.63%, and the area expanded from inland to coastal areas. The results of this study provide a reference for the protection and sustainable management of mangrove forests while also verifying the feasibility of monitoring long-term spatiotemporal dynamics of mangrove forests based on the GEE platform.

Key wordsBeibu Gulf    mangrove forest    Google Earth Engine    active and passive remote sensing images    random forest (RF) algorithm    dynamic monitoring
收稿日期: 2023-12-13      出版日期: 2025-05-09
ZTFLH:  TP79  
基金资助:广西科学研究与技术开发计划重点研发项目“基于卫星遥感影像的河流水库水质污染预警应用技术研究”(桂科AB22080046);“北部湾典型海湾与入海河流环境耦合效应与一体化监控技术研究”(桂科AB16380247);国家自然科学基金项目“基于遥感反演的岩溶湿地植被功能性状对水文水质响应机制研究”(42371341);广西自然科学基金项目“耦合星-机-地高光谱遥感的红树林营养元素含量多尺度反演研究”(2024GXNSFAA010351);广西水利科技推广项目“空天遥感技术在河流水资源环境监测评估与预警中的应用”共同资助(SK-2023-01)
通讯作者: 付波霖(1988-),男,博士,教授,主要从事湿地植被分类、植被功能和水质参数的遥感估算、湿地植被—水文/气候变化监测等研究。Email: fubolin@glut.edu.cn
作者简介: 邓建明(1983-),男,硕士,高级工程师,主要从事资源环境监测评价研究。Email: 61267935@qq.com
引用本文:   
邓建明, 姚航, 付波霖, 顾森, 唐婕, 甘园园. 基于GEE和时序主被动影像的广西北部湾红树林时空动态监测研究[J]. 自然资源遥感, 2025, 37(2): 235-245.
DENG Jianming, YAO Hang, FU Bolin, GU Sen, TANG Jie, GAN Yuanyuan. Monitoring the spatiotemporal dynamics of mangrove forests in Beibu Gulf, Guangxi Zhuang Autonomous Region, China, using Google Earth Engine and time-series active and passive remote sensing images. Remote Sensing for Natural Resources, 2025, 37(2): 235-245.
链接本文:  
https://www.gtzyyg.com/CN/10.6046/zrzyyg.2023370      或      https://www.gtzyyg.com/CN/Y2025/V37/I2/235
Fig.1  研究区位置示意图
年份 传感器 影像数 影像分辨率/m 影像筛选日期
1985年 Landsat5 TM 68 30 1984年5月30日—1989年10月30日
1995年 Landsat5 TM 46 30 1994年1月1日—1995年12月31日
2005年 Landsat7 ETM+ 108 15/30 2000年1月1日—2003年12月31日
L-band PALSAR/PALSAR-2 1 25 2007年1月1日—2007年12月31日
2015年 Landsat8 OLI 31 30 2015年1月1日—2015年12月31日
C-band Sentinel-1 GRD 16 20 2015年1月1日—2015年12月1日
2019年 Sentinel-2 MSI 720 10/20 2019年1月1日—2019年12月1日
C-band Sentinel-1 GRD 106 20 2019年1月1日—2019年12月1日
Tab.1  多源遥感数据集
地物类型 解译标志 描述
Landsat影像 Sentinel影像 雷达影像
建筑用地 道路、城镇、沙地等,在标准假彩色中显示为灰白色、青绿色及亮白色,轮廓清晰且与周围地物分界明显
红树林 由密集分布的红树林群落组成,沿海岸带分布。在标准假彩色显示方案中,1985年、1995年Landsat5影像中的红树林主要表现为淡棕红色,2005—2019年影像中则主要表现为暗红色
水体 在标准假彩色中显示方案中,1985年、1995年海水为蓝绿色,2005—2019年海水为蓝色
海产养殖 包括虾塘等养殖塘,有明显的轮廓边界,形状较规则
耕地 在标准假彩色中表现为淡红色,且主要分布于内陆,形状较规则
林地 在标准假彩色中表现为比耕地更深的红色,且主要分布于内陆,时常与耕地相邻
滩涂 出现在沿岸海陆交汇区域,是红树林生长的沃土,在标准假彩色中表现为桃皮色
Tab.2  研究区地物解译标志及其描述
序号 指数类型 计算公式
1 归一化植被指数
(normalized difference vegetation index, NDVI)
N D V I = ( λ N I R - λ R E D ) / ( λ N I R + λ R E D )
2 比值植被指数(ratio vegetation index, RVI) R V I = λ R E D / λ N I R
3 差值植被指数(difference vegetation index, DVI) D V I = λ N I R - λ R E D
4 增强植被指数(enhanced vegetation index, EVI) E V I = 2.5 × λ N I R - λ R E D λ N I R + 6.0 λ R E D - 7.5 λ B L U E + 1
5 校正植被指数(corrected transformed vegetation index, CTVI) C T V I = N D V I + 0.5 | N D V I + 0.5 | | N D V I + 0.5 |
6 非线性指数(non-linear vegetation index, NLI) N L I = ( λ N I R 2 - λ R E D ) / ( λ N I R 2 + λ R E D )
7 改进简单比值指数(modified simple ratio, MSRNIR) M S R N I R = ( λ N I R λ R E D - 1 ) / λ N I R λ R E D + 1
8 归一化水体指数(normalized difference water index, NDWI) N D W I = ( λ S W I R - λ N I R ) / ( λ S W I R + λ N I R )
9 改进的归一化水体指数(modified normalized difference water index, MNDWI) N D W I S W I R 1 = ( λ S W I R 1 - λ N I R ) / ( λ S W I R 1 + λ N I R )
SWIR1(1.55~1.75 μm)
N D W I S W I R 2 = ( λ S W I R 2 - λ N I R ) / ( λ S W I R 2 + λ N I R )
SWIR2(2.08~2.35 μm)
10 自动提取水体指数(automated water extraction index, AWEI) A W E I = 4 ( λ G R E E N - λ S W I R 1 ) / ( 0.25 λ N I R + 0.75 λ S W I R 2 )
11 归一化建筑指数(normalized difference built-up index, NDBI) N D B I S W I R 1 = ( λ S W I R 1 - λ N I R ) / ( λ S W I R 1 + λ N I R )
SWIR1(1.55~1.75 μm)
N D B I S W I R 2 = ( λ S W I R 2 - λ N I R ) / ( λ S W I R 2 + λ N I R )
SWIR2(2.08~2.35 μm)
12 基于红边波段的改进简单比值指数(modified simple ratio, MSRRE1,MSRRE2) M S R R E 1 = ( λ R E 1 λ R E D - 1 ) / λ R E 1 λ R E D + 1
RE1(703.9 nm)
M S R R E 2 = ( λ R E 2 λ R E D - 1 ) / λ R E 2 λ R E D + 1
RE2(740.2 nm)
13 基于红边波段的非线性指数(non-linear index, NLIRE1,NLIRE2) N L I R E 1 = ( λ R E 1 2 - λ R E D ) / ( λ R E 1 2 + λ R E D )
RE1(703.9 nm)
N L I R E 2 = ( λ R E 2 2 - λ R E D ) / ( λ R E 2 2 + λ R E D )
RE2(740.2 nm)
14 基于红边波段的增强植被指数(enhanced vegetation index, EVIRE1,EVIRE2) E V I R E 1 = 2.5 × λ R E 1 - λ R E D λ R E 1 + 6.0 λ R E D - 7.5 λ B L U E + 1
RE1(703.9 nm)
E V I R E 2 = 2.5 × λ R E 2 - λ R E D λ R E 2 + 6.0 λ R E D - 7.5 λ B L U E + 1
RE2(740.2 nm)
15 微波遥感指数HH/HV PALSAR HH/HV
16 微波遥感指数VV/VH Sentinel-1 VV/VH
Tab.3  各类型遥感指数计算公式
年份 传感器 方案 变量数 多源数据集
1985年 Landsat5 TM 方案1 21 多光谱波段(6个波段)、各类遥感指数(植被指数、水体指数、建筑指数)、数字高程模型(digital elevation model,DEM)、非监督分类结果
方案2 55 多光谱波段(6个波段)、各类遥感指数(植被指数、水体指数、建筑指数)、DEM、非监督分类结果、B1(BLUE)波段纹理特征、B5(1.55~1.75 μm)波段纹理特征
1995年 Landsat5 TM 方案1 21 多光谱波段(6个波段)、各类遥感指数(植被指数、水体指数、建筑指数)、DEM、非监督分类结果
方案2 38 多光谱波段(6个波段)、各类遥感指数(植被指数、水体指数、建筑指数)、DEM、非监督分类结果、B5(1.55~1.75 μm)波段纹理特征
2005年 Landsat7 ETM+ 方案1 22 多光谱波段(7个波段)、各类遥感指数(13个)、DEM、非监督分类结果
方案2 25 多光谱波段(7个波段)、各类遥感指数(13个)、DEM、非监督分类结果、PALSAR/PALSAR-2 HH,HV,HH/HV
方案3 42 多光谱波段(7个波段)、各类指数(13个)、DEM、非监督分类结果、HSV波段融合、B4(NIR)波段纹理特征
2015年 Landsat8 OLI 方案1 55 多光谱波段(7个波段)、各类遥感指数(13个)、DEM、非监督分类结果
方案2 25 多光谱波段(7个波段)、各类遥感指数(13个)、DEM、非监督分类结果、C-band Sentinel-1 GRD VV,VH,VV/VH
方案3 42 多光谱波段(7个波段)、各类遥感指数(13个)、DEM、非监督分类结果、HSV波段融合、B7(2.11~2.29 μm)波段纹理特征
2019年 Sentinel-2 MSI 方案1 31 多光谱波段(10个波段)、各类遥感指数(16个)、DEM、非监督分类结果
方案2 34 多光谱波段(10个波段)、各类遥感指数(16个)、DEM、非监督分类结果、C-band Sentinel-1 GRD VV,VH,VV/VH
方案3 50 多光谱波段(10个波段)、各类遥感指数(16个)、DEM、非监督分类结果、B5(703.9 nm)波段纹理特征(9个)、B8(NIR)波段纹理特征(10个)
方案4 48 多光谱波段(10个波段)、各类遥感指数(16个)、DEM、非监督分类结果、B12(2 202.4 nm)波段纹理特征
Tab.4  分类方案及多源遥感数据集
Fig.2  技术路线
Fig.3  1985—2015年不同遥感数据集重要性定量评价
Fig.4  1985—2015年不同遥感数据集的分类结果
Fig.5  2019年Sentinel-2 MSI影像的分类结果
年份 方案 Kappa系数 总体分类精度/%
1985年 方案1 0.869 88.8
方案2 0.884 90.1
1995年 方案1 0.761 80.0
方案2 0.853 87.7
2005年 方案1 0.881 90.1
方案2 0.901 91.8
方案3 0.908 92.3
2015年 方案1 0.874 89.3
方案2 0.900 91.6
方案3 0.907 92.1
2019年 方案1 0.881 90.1
方案2 0.900 91.6
方案3 0.956 96.3
方案4 0.943 95.3
Tab.5  1985—2019年各分类方案总体分类精度及Kappa系数
Fig.6  1985年和2019年同一遥感数据集分类结果图
地类 1985年/km2 占比/% 1995年/km2 占比/% 2005年/km2 占比/% 2015年/km2 占比/%
建筑用地 142.79 3.12 184.49 4.03 203.19 4.44 483.43 10.55
红树林 22.84 0.50 43.17 0.94 55.33 1.21 66.36 1.45
水体 1 613.01 35.21 1 579.58 34.48 1 501.06 32.77 1 561.20 34.08
海产养殖 546.25 11.92 565.92 12.35 628.85 13.73 608.80 13.29
耕地 1 201.92 26.24 1 505.52 32.86 1 326.87 28.96 1 090.14 23.80
林地 886.90 19.36 531.07 11.59 587.27 12.82 569.34 12.43
滩涂 167.38 3.65 171.34 3.74 278.52 6.08 201.82 4.41
总计 4 581.09 100.00 4 581.09 100.00 4 581.09 100.00 4 581.09 100.00
Tab.6  1985—2019年研究区各类地物面积
地类 1985—
1995
1995—
2005
2005—
2015
2015—
2019
1985—
2019
建筑用地 2.92 1.01 13.79 -0.33 6.50
红树林 8.90 2.82 1.99 1.11 6.36
水体 -0.21 -0.50 -0.40 0.12 -0.06
海产养殖 0.36 1.11 -0.32 1.29 0.74
耕地 2.53 -1.19 -1.78 -0.67 -0.44
林地 -4.01 1.06 -0.31 1.33 -0.78
滩涂 0.24 6.26 -2.75 -4.53 -0.97
Tab.7  1985—2019年各土地利用类型年变化率
Fig.7  1985年、2005年和2019年北部湾典型区域红树林空间位置变化
[1] 卢元平, 徐卫华, 张志明, 等. 中国红树林生态系统保护空缺分析[J]. 生态学报, 2019, 39(2):684-691.
Lu Y P, Xu W H, Zhang Z M, et al. Gap analysis of mangrove ecosystem conservation in China[J]. Acta Ecologica Sinica, 2019, 39(2):684-691.
[2] 李想, 刘凯, 朱远辉, 等. 基于资源三号影像的红树林物种分类研究[J]. 遥感技术与应用, 2018, 33(2):360-369.
doi: 10.11873/j.issn.1004-0323.2018.2.0360
Li X, Liu K, Zhu Y H, et al. Study on mangrove species classification based on ZY-3 image[J]. Remote Sensing Technology and Application, 2018, 33(2):360-369.
[3] Wang L, Jia M, Yin D, et al. A review of remote sensing for mangrove forests:1956—2018[J]. Remote Sensing of Environment, 2019, 231:111223.
[4] 孙永光, 赵冬至, 郭文永, 等. 红树林生态系统遥感监测研究进展[J]. 生态学报, 2013, 33(15):4523-4538.
Sun Y G, Zhao D Z, Guo W Y, et al. A review on the application of remote sensing in mangrove ecosystem monitoring[J]. Acta Ecologica Sinica, 2013, 33(15):4523-4538.
[5] Giri C, Long J, Abbas S, et al. Distribution and dynamics of mangrove forests of South Asia[J]. Journal of Environmental Management, 2015, 148:101-111.
doi: 10.1016/j.jenvman.2014.01.020 pmid: 24735705
[6] 何斌源, 范航清, 王瑁, 等. 中国红树林湿地物种多样性及其形成[J]. 生态学报, 2007, 27(11):4859-4870.
He B Y, Fan H Q, Wang M, et al. Species diversity in mangrove wetlands of China and its causation analyses[J]. Acta Ecologica Sinica, 2007, 27(11):4859-4870.
[7] Son N T, Chen C F, Chang N B, et al. Mangrove mapping and change detection in Ca mau peninsula,Vietnam,using landsat data and object-based image analysis[J]. IEEE Journal of Selected Topics in Applied Earth Observations and Remote Sensing, 2015, 8(2):503-510.
[8] Duke N C, Meynecke J O, Dittmann S, et al. A world without mangroves?[J]. Science, 2007, 317(5834):41-42.
doi: 10.1126/science.317.5834.41b pmid: 17615322
[9] Wang W, Fu H, Lee S Y, et al. Can strict protection stop the decline of mangrove ecosystems in China? from rapid destruction to rampant degradation[J]. Forests, 2020, 11(1):55.
[10] Food and Agriculture Organization of the United Nations (FAO). The World’s Mangroves 1980-2005[Z]. Roman,Italy, 2007.
[11] Richards D R, Friess D A. Rates and drivers of mangrove deforestation in Southeast Asia,2000-2012[J]. Proceedings of the National Academy of Sciences of the United States of America, 2016, 113(2):344-349.
doi: 10.1073/pnas.1510272113 pmid: 26712025
[12] Hu L, Xu N, Liang J, et al. Advancing the mapping of mangrove forests at national-scale using sentinel-1 and sentinel-2 time-series data with google earth engine:A case study in China[J]. Remote Sensing, 2020, 12(19):3120.
[13] Yin D, Wang L. Individual mangrove tree measurement using UAV-based LiDAR data:Possibilities and challenges[J]. Remote Sensing of Environment, 2019, 223:34-49.
[14] 蒙良莉, 凌子燕, 蒋卫国, 等. 基于Sentinel遥感数据的红树林信息提取研究——以广西茅尾海为例[J]. 地理与地理信息科学, 2020, 36(4):41-47.
Meng L L, Ling Z Y, Jiang W G, et al. Mangrove information extraction based on the sentinel remote sensing data:A case study of Maoweihai Bay of Guangxi[J]. Geography and Geo-Information Science, 2020, 36(4):41-47.
[15] 周振超, 李贺, 黄翀, 等. 红树林遥感动态监测研究进展[J]. 地球信息科学学报, 2018, 20(11):1631-1643.
doi: 10.12082/dqxxkx.2018.180247
Zhou Z C, Li H, Huang C, et al. Review on dynamic monitoring of mangrove forestry using remote sensing[J]. Journal of Geo-Information Science, 2018, 20(11):1631-1643.
[16] Jakovac C C, Latawiec A E, Lacerda E, et al. Costs and carbon benefits of mangrove conservation and restoration:A global analysis[J]. Ecological Economics, 2020, 176:106758.
[17] 徐逸, 甄佳宁, 蒋侠朋, 等. 无人机遥感与XGBoost的红树林物种分类[J]. 遥感学报, 2021, 25(3):737-752.
Xu Y, Zhen J N, Jiang X P, et al. Mangrove species classification with UAV-based remote sensing data and XGBoost[J]. National Remote Sensing Bulletin, 2021, 25(3):737-752.
[18] 甄佳宁, 廖静娟, 沈国状. 1987以来海南省清澜港红树林变化的遥感监测与分析[J]. 湿地科学, 2019, 17(1):44-51.
Zhen J N, Liao J J, Shen G Z. Remote sensing monitoring and analysis on the dynamics of mangrove forests in Qinglan habor of Hainan Province since 1987[J]. Wetland Science, 2019, 17(1):44-51.
[19] 李春干, 代华兵. 红树林空间分布信息遥感提取方法[J]. 湿地科学, 2014, 12(5):580-589.
Li C G, Dai H B. Extraction of mangroves spatial distribution using remotely sensed data[J]. Wetland Science, 2014, 12(5):580-589.
[20] Gorelick N, Hancher M, Dixon M, et al. Google Earth Engine:Planetary-scale geospatial analysis for everyone[J]. Remote Sensing of Environment, 2017, 202:18-27.
[21] Kumar L, Mutanga O. Google earth engine applications since inception:Usage,trends,and potential[J]. Remote Sensing, 2018, 10(10):1509.
[22] Mandal M S H, Hosaka T. Assessing cyclone disturbances (1988-2016) in the Sundarbans mangrove forests using Landsat and Google Earth Engine[J]. Natural Hazards,2020, 102(1):133-150.
[23] Portengen E C. Classifying mangroves in Vietnam using radar and optical satellite remote sensing[D]. Delft: Delft University of Technology, 2017.
[24] 沈小雪, 关淳雅, 王茜, 等. 红树林生态开发现状与对策研究[J]. 中国环境科学, 2020, 40(9):4004-4016.
Shen X X, Guan C Y, Wang Q, et al. Study on the current situation and countermeasures of mangrove ecological exploitation[J]. China Environmental Science, 2020, 40(9):4004-4016.
[25] Liao J, Zhen J, Zhang L, et al. Understanding dynamics of mangrove forest on protected areas of Hainan island,China:30 years of evidence from remote sensing[J]. Sustainability, 2019, 11(19):5356.
[26] Jia M, Wang Z, Zhang Y, et al. Monitoring loss and recovery of mangrove forests during 42 years:The achievements of mangrove conservation in China[J]. International Journal of Applied Earth Observation and Geoinformation, 2018, 73:535-545.
[1] 李尉尉, 薛志泳, 朱建华, 田震. 基于GEE平台多源遥感数据的海南岛红树林碳储量估算[J]. 自然资源遥感, 2025, 37(2): 220-227.
[2] 薛志泳, 李尉尉, 田震, 朱明杰, 朱建华. 考虑极化与地形特征的GEE海南岛红树林树种精细化分类[J]. 自然资源遥感, 2025, 37(2): 274-284.
[3] 陈志洋, 毛德华, 王宗明, 林楠, 贾明明, 任春颖, 王铭. 基于时序Sentinel-2数据的江汉平原养殖池提取[J]. 自然资源遥感, 2025, 37(1): 169-178.
[4] 魏鑫, 任雨, 陈曦东, 胡青峰, 刘辉, 周婧, 宋冬伟, 张培佩, 黄志全. 基于时序Sentinel-2数据水体动态变化监测——以河南省为例[J]. 自然资源遥感, 2024, 36(2): 268-278.
[5] 薛志泳, 田震, 朱建华, 赵阳. 基于Google Earth Engine的八门湾红树林年际变化监测[J]. 自然资源遥感, 2024, 36(2): 279-286.
[6] 冯倩, 张佳华, 邓帆, 吴贞江, 赵恩灵, 郑培鑫, 韩杨. 基于特征优选和时空融合算法的黄河三角洲湿地类别制图方法研究[J]. 自然资源遥感, 2024, 36(2): 39-49.
[7] 宋英旭, 邹昱嘉, 叶润青, 贺志霞, 王宁涛. 利用GEE云平台实现三峡库区滑坡危险性动态分析[J]. 自然资源遥感, 2024, 36(1): 154-161.
[8] 明小勇, 田义超, 张强, 陶进, 张亚丽, 林俊良. 基于Sentinel-1A钦防地区地面沉降监测与分析[J]. 自然资源遥感, 2024, 36(1): 35-48.
[9] 王煜淼, 李胜, 东春宇, 杨刚. 多特征参数支持的红树林遥感信息提取——以广东省为例[J]. 自然资源遥感, 2024, 36(1): 95-102.
[10] 杜晓川, 娄德波, 徐林刚, 范莹琳, 张琳, 李婉悦. 基于GF-2影像和随机森林算法的花岗伟晶岩提取[J]. 自然资源遥感, 2023, 35(4): 53-60.
[11] 李光哲, 王浩, 曹银璇, 张晓宇, 宁晓刚. 长株潭城市群生态环境质量时空演变及影响因素分析[J]. 自然资源遥感, 2023, 35(4): 244-254.
[12] 陈健, 李虎, 刘玉锋, 常竹, 韩伟杰, 刘赛赛. 基于Sentinel-2数据多特征优选的农作物遥感识别研究[J]. 自然资源遥感, 2023, 35(4): 292-300.
[13] 于森, 贾明明, 陈高, 鲁莹莹, 李毅, 张博淳, 路春燕, 李慧颖. 基于LandTrendr算法海南东寨港红树林扰动研究[J]. 自然资源遥感, 2023, 35(2): 42-49.
[14] 朱琳, 黄玉玲, 杨刚, 孙伟伟, 陈超, 黄可. 基于GEE的杭州湾海岸线遥感提取与时空演变分析[J]. 自然资源遥感, 2023, 35(2): 50-60.
[15] 石敏, 李慧颖, 贾明明. 基于GEE云平台与Landsat数据的山口自然保护区红树林时空变化分析[J]. 自然资源遥感, 2023, 35(2): 61-69.
Viewed
Full text


Abstract

Cited

  Shared   
  Discussed   
京ICP备05055290号-2
版权所有 © 2015 《自然资源遥感》编辑部
地址:北京学院路31号中国国土资源航空物探遥感中心 邮编:100083
电话:010-62060291/62060292 E-mail:zrzyyg@163.com
本系统由北京玛格泰克科技发展有限公司设计开发