|
|
 |
|

|
|
|
A comparative study of the methods for delineating wildland-urban interfaces: A case study of Wood Buffalo, Alberta, Canada |
WANG Zimeng1( ), LIAO Yuanhong1, LOU Shuhan1, BAI Yuqi1,2() ), LIAO Yuanhong1, LOU Shuhan1, BAI Yuqi1,2() |
1. Department of Earth System Science, Ministry of Education Ecological Field Station for East Asian Migratory Birds and Their Habitatses, Institute for Global Change Studies, Tsinghua University, Beijing 100084, China
2. Tsinghua Urban Institute, Tsinghua University, Beijing 100084, China |
|
|
|
|
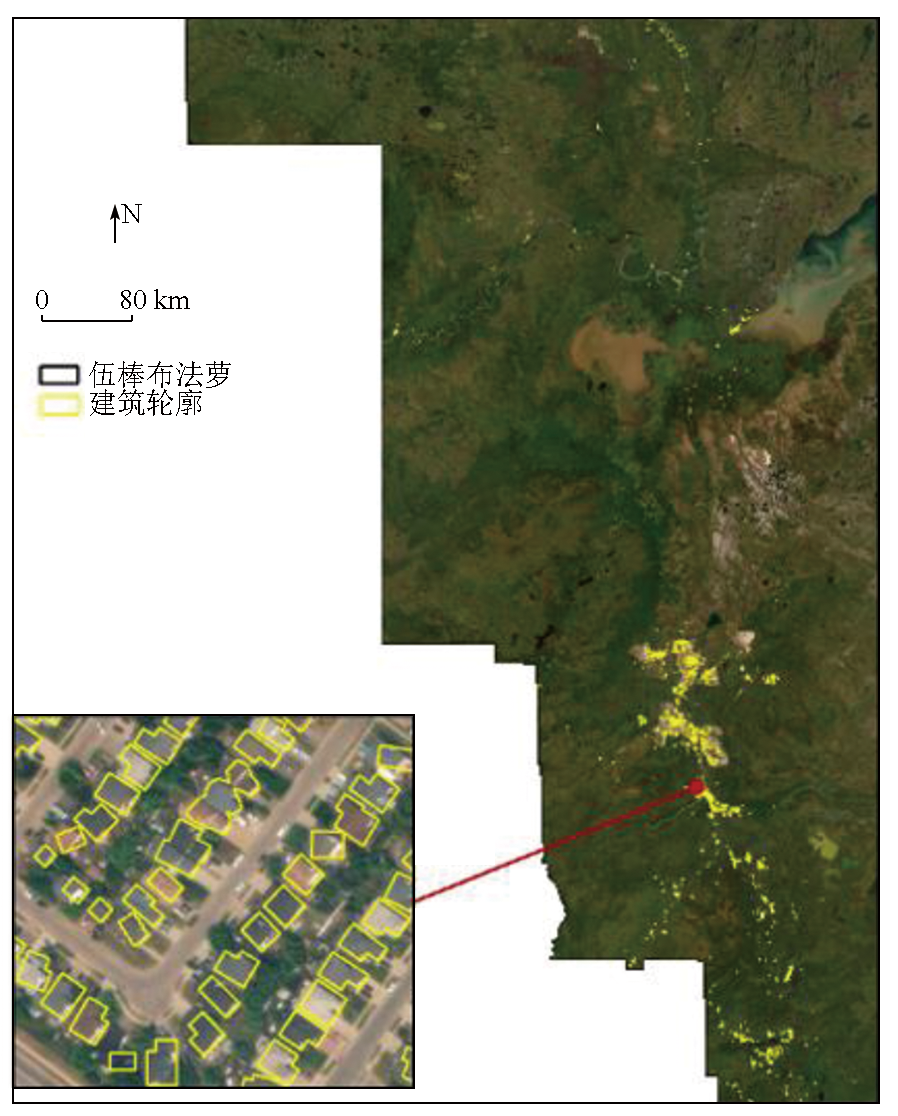
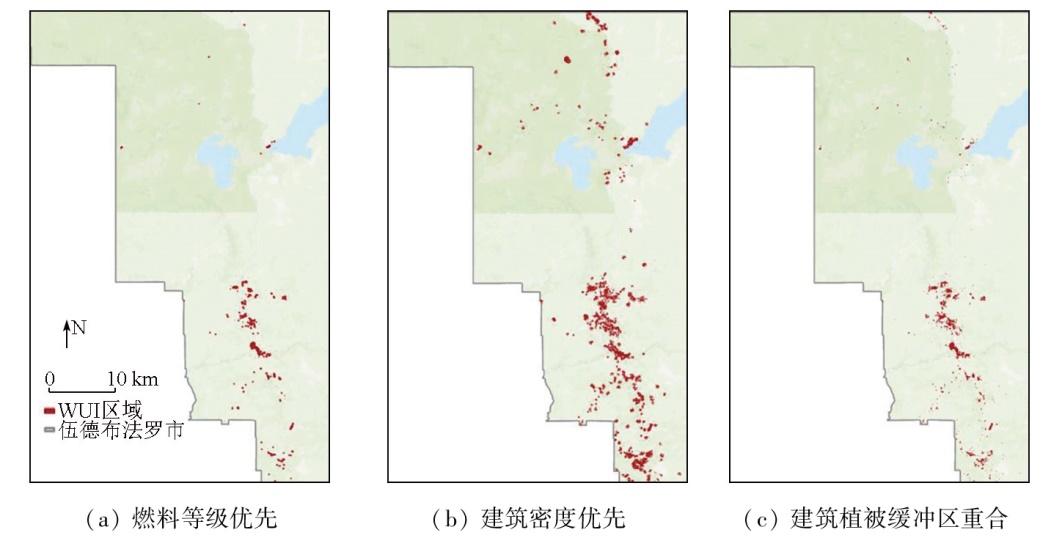
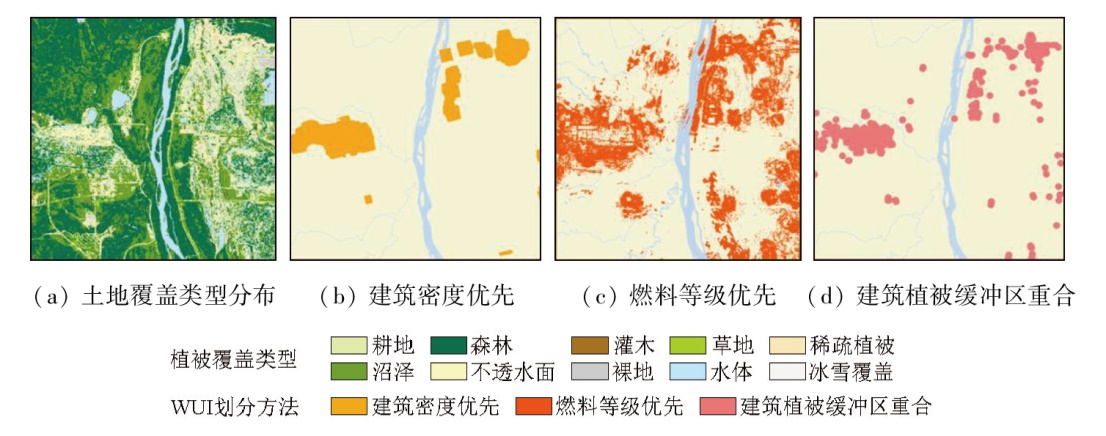
Abstract A wildland-urban interface (WUI) refers to the area where residential buildings meet or intermingle with natural vegetation such as forests. The delineation of the WUI plays an important role in fire risk management, forest resource development and utilization, climate change responses, and sustainable socio-economic development. Current methods for WUI delineation are primarily developed and refined based on the definition given in the Federal Register of the United States. Based on indicators such as building density, vegetation coverage, and the distance between buildings and vegetation, these methods can be categorized into three types: building density priority, fuel grade priority, and overlap between building-vegetation buffer zones. Initially, this study presented a summary and comparison of relevant literature on the three types of methods. Then, Wood Buffalo in Alberta, Canada, an area frequently affected by wildfires, was selected to compare the three methods using data on Canadian building footprints released by Microsoft, global land cover from GLC_FCS30-2020, and local historical fire points and fire scars. The results indicate that the building density priority method exhibited the highest coincidence rate with historical wildfire records. However, it overlooked low-density buildings that were also at risk of wildfire. The fuel grade priority method produced a larger delineation area, with a lower coincidence rate with historical wildfire records since it focused excessively on the vegetation around buildings while neglecting the buildings themselves. In contrast, overlap between building-vegetation buffer zones presented the lowest coincidence rate with historical wildfire records and the smallest delineation area. This occurred primarily due to the short distance setting of buffer zones. This study reveals the strengths and limitations of existing methods, contributing to more scientifically robust and rational WUI delineation in the future while also providing references for decision-making in fire risk management and emergency responses.
|
| Keywords
wildland-urban interface (WUI)
building density priority method
fuel grade priority method
overlap between building-vegetation buffer zones
wildfire risk management
|
|
|
|
Issue Date: 31 December 2025
|
|
|
| [1] |
Wu C, Sitch S, Huntingford C, et al. Reduced global fire activity due to human demography slows global warming by enhanced land carbon uptake[J]. Proceedings of the National Academy of Sciences of the United States of America, 2022, 119(20):e2101186119.
|
| [2] |
Kelley D I, Mathison C, Burton C, et al. Likely future (s) of global wildfires[R]. Copernicus Meetings, 2022.
|
| [3] |
The UN Environment Programme. 2022.Spreading like Wildfire:The rising threat of extraordinary landscape fires[R].https://www.unep.org/news-and-stories/press-release/number-wildfires-rise-50-2100-and-governments-are-not-prepared.
url: https://www.unep.org/news-and-stories/press-release/number-wildfires-rise-50-2100-and-governments-are-not-prepared
|
| [4] |
Radeloff V C, Hammer R B, Stewart S I, et al. The wildland-urban interface in the United States[J]. Ecological Applications, 2005, 15(3):799-805.
doi: 10.1890/04-1413
url: https://esajournals.onlinelibrary.wiley.com/doi/10.1890/04-1413
|
| [5] |
Davis J B. The wildland-urban interface:Paradise or battleground?[J]. Journal of Forestry, 1990, 88(1):26-31.
|
| [6] |
Platt R V. The wildland-urban interface:Evaluating the definition effect[J]. Journal of Forestry, 2010, 108(1):9-15.
doi: 10.1093/jof/108.1.9
url: https://academic.oup.com/jof/article/108/1/9/4599384
|
| [7] |
Godoy M M, Martinuzzi S, Masera P, et al. Forty years of wildland urban interface growth and its relation with wildfires in central-western Chubut,Argentina[J]. Frontiers in Forests and Global Change, 2022,5:850543.
|
| [8] |
Berg A K, Connor D S, Kedron P, et al. Remapping California’s wildland urban interface:A property-level time-space framework,2000-2020[J]. Applied Geography, 2024,167:103271.
|
| [9] |
Huang Y, Jin Y. Aerial imagery-based building footprint detection with an integrated deep learning framework:Applications for fine scale wildland-urban interface mapping[J]. Remote Sensing, 2022, 14(15):3622.
doi: 10.3390/rs14153622
url: https://www.mdpi.com/2072-4292/14/15/3622
|
| [10] |
Carlson A R, Helmers D P, Hawbaker T J, et al. The wildland-urban interface in the United States based on 125 million building locations[J]. Ecological Applications, 2022, 32(5):e2597.
doi: 10.1002/eap.2597
pmid: 35340097
|
| [11] |
Schug F, Bar-Massada A, Carlson A R, et al. The global wildland-urban interface[J]. Nature, 2023, 621(7977):94-99.
doi: 10.1038/s41586-023-06320-0
|
| [12] |
Chen B, Wu S, Jin Y, et al. Wildfire risk for global wildland-urban interface areas[J]. Nature Sustainability, 2024, 7(4):474-484.
doi: 10.1038/s41893-024-01291-0
|
| [13] |
Johnston L M, Flannigan M D. Mapping Canadian wildland fire interface areas[J]. International Journal of Wildland Fire, 2018, 27(1):1.
doi: 10.1071/WF16221
url: https://connectsci.au/wf/article/27/1/1/21340/Mapping-Canadian-wildland-fire-interface-areas
|
| [14] |
Bar-Massada A, Alcasena F, Schug F, et al. The wildland-urban interface in Europe:Spatial patterns and associations with socioeconomic and demographic variables[J]. Landscape and Urban Planning, 2023,235:104759.
|
| [15] |
Modugno S, Balzter H, Cole B, et al. Mapping regional patterns of large forest fires in wildland-urban interface areas in Europe[J/OL]. Journal of Environmental Management, 2016,172:112-126.
|
| [16] |
Natural Resources Canada. Canadian wildland fire information system[R].http://bit.ly/WUI-088,2019.
url: http://bit.ly/WUI-088,2019
|
| [17] |
Beverly J L, Bothwell P. Wildfire evacuations in Canada 1980-2007[J]. Natural Hazards, 2011, 59(1):571-596.
doi: 10.1007/s11069-011-9777-9
url: http://link.springer.com/10.1007/s11069-011-9777-9
|
| [18] |
Giglio L, Boschetti L, Roy D, et al. Collection 6 MODIS burned area product user’s guide version 1.0[J]. NASA EOSDIS Land Processes DAAC:Sioux Falls,SD,USA, 2016:11-27.
|
| [19] |
Bar-Massada A, Stewart S I, Hammer R B, et al. Using structure locations as a basis for mapping the wildland urban interface[J]. Journal of Environmental Management, 2013,128:540-547.
|
| [20] |
Li S, Dao V, Kumar M, et al. Mapping the wildland-urban interface in California using remote sensing data[J]. Scientific Reports, 2022, 12(1):5789.
doi: 10.1038/s41598-022-09707-7
pmid: 35388077
|
| [21] |
Glickman D, Babbitt B. Urban wildland interface communities within the vicinity of federal lands that are at high risk from wildfire[J]. Federal Register, 2001, 66(3):751-777.
|
| [22] |
Chas-Amil M L, Touza J, García-Martínez E. Forest fires in the wildland-urban interface:A spatial analysis of forest fragmentation and human impacts[J]. Applied Geography, 2013,43:127-137.
|
| [23] |
Herrero-Corral G, Jappiot M, Bouillon C, et al. Application of a geographical assessment method for the characterization of wildland-urban interfaces in the context of wildfire prevention:A case study in western Madrid[J]. Applied Geography, 2012, 35(1/2):60-70.
doi: 10.1016/j.apgeog.2012.05.005
url: https://linkinghub.elsevier.com/retrieve/pii/S0143622812000550
|
| [24] |
Kumar M, Li S, Nguyen P, et al. Examining the existing definitions of wildland-urban interface for California[J]. Ecosphere, 2022, 13(12):e4306.
doi: 10.1002/ecs2.v13.12
url: https://esajournals.onlinelibrary.wiley.com/toc/21508925/13/12
|
|
Viewed |
|
|
|
Full text
|
|
|
|
|
Abstract
|
|
|
|
|
Cited |
|
|
|
|
| |
Shared |
|
|
|
|
| |
Discussed |
|
|
|
|
 2025,
Vol. 37
2025,
Vol. 37