A remote sensing-based study on change in land use and vegetation cover in Xiong’an New Area from 1991 to 2021
CUI Dunyue1(), WANG Shidong1, ZHANG Xuejun2()
1. School of Surveying and Mapping and Land Information Engineering, Henan University of Technology, Jiaozuo 454000, China 2. The Second Institute of Geology and Mineral Resources of Henan Bureau of Geology and Mineral Resources Exploration and Development, Zhengzhou 450001, China
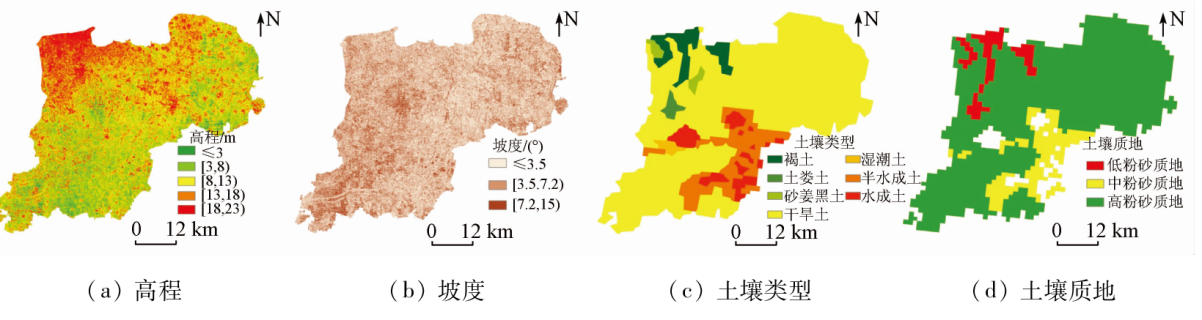
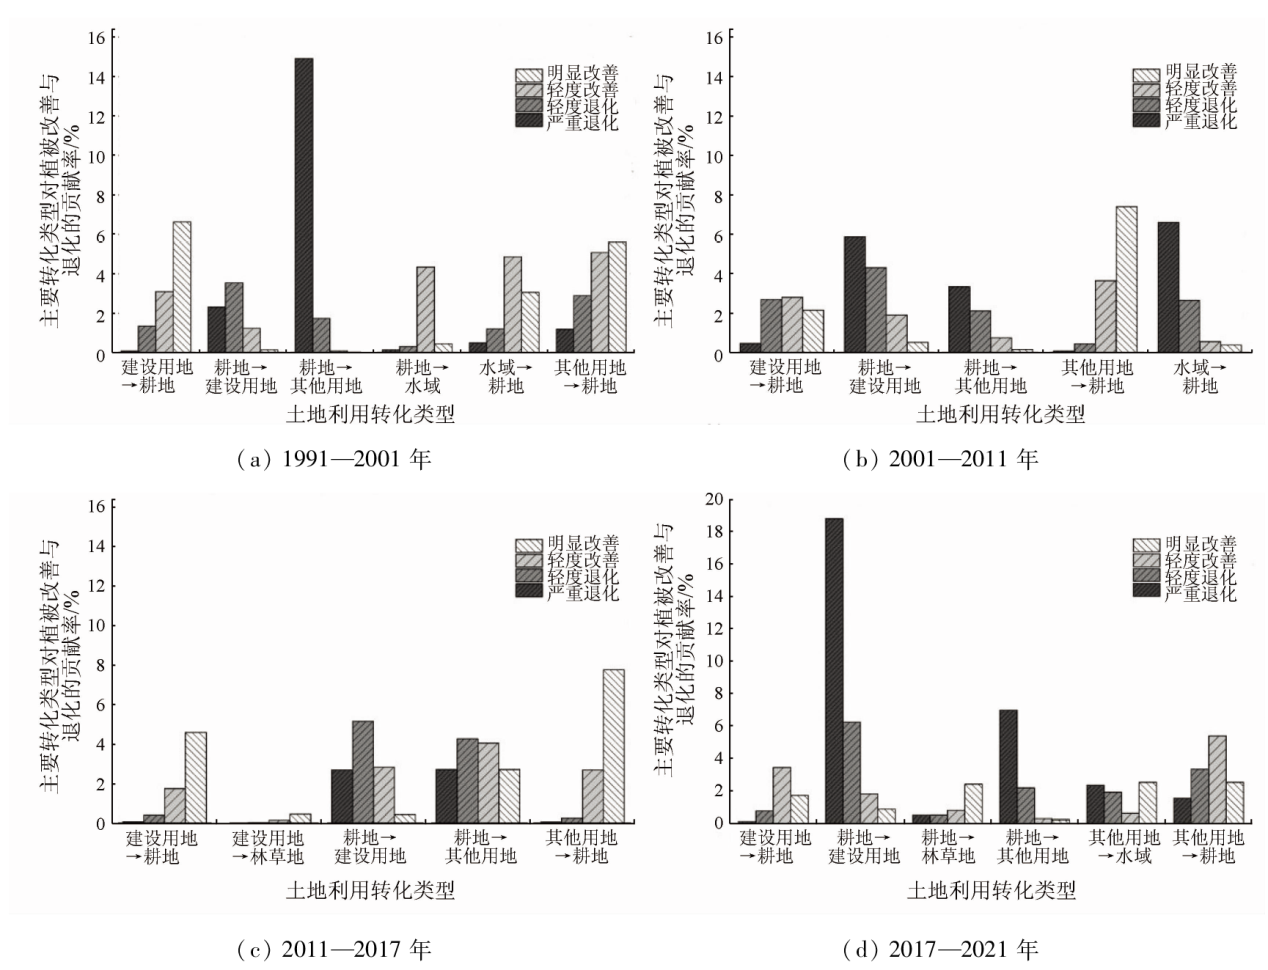
This study aims to analyze the changes in the land use and vegetation cover in the Xiong'an New Area from 1991 to 2021. To this end, this study explored the characteristics of the land use changes in the area over the 30 years based on the Landsat TM\OLI data of five periods using the GIS technology and map fusion method. Then, it extracted the vegetation cover information using the dimidiate pixel model and analyzed the changes in the vegetation cover. Furthermore, this study explored the potential factors driving the vegetation cover change in the area using the geographic detector model and analyzed the impact of land use change on vegetation cover change by referencing the existing map fusion method. The results show that: ① From 1991 to 2021, the construction land in Xiong’an New Area increased by 108.09 km2, primarily transformed from farmland and other types of land; other types of land reduced by 108.17 km2, predominantly transformed to farmland; forestland and grassland increased by 11.56 km2, mainly transformed from water areas and other types of land; the water area decreased by 38.76 km2, mainly transformed to farmland and other types of land; and the area of farmland roughly remained unchanged; ② Over the 30 years, the Xiong’an New Area generally exhibited high vegetation coverage, and the area with moderate and high vegetation coverage and above accounted for more than 50.00%. The vegetation coverage in the Xiong’an New Area presented an overall spatial distribution pattern characterized by high in Anxin County, moderate in Rongcheng County, and low in Xiong County. Regarding the phased changes, this area showed a degradation trend from 1991 to 2001, and the area with degraded vegetation cover accounted for 39.15%. From 2001 to 2021, this area exhibited an improvement trend, the area with improved vegetation cover accounted for up to 47.55%; ③ The vegetation cover change showed spatial differentiation, significantly affected by the population density, GDP, soil type, and soil quality but slightly affected by the elevation and slope. The transformation of construction land and other types of land to farmland acted as an important reason for the improvement in vegetation cover, while the transformation of farmland to construction land and other types of land served as an important reason for vegetation degradation. The results of this study can, to some extent, provide a scientific basis and suggestions for the sustainable development of Xiong’an New Area.
崔囤月, 王世东, 张学军. 1991—2021年雄安新区土地利用与植被覆盖变化遥感研究[J]. 自然资源遥感, 2023, 35(4): 214-225.
CUI Dunyue, WANG Shidong, ZHANG Xuejun. A remote sensing-based study on change in land use and vegetation cover in Xiong’an New Area from 1991 to 2021. Remote Sensing for Natural Resources, 2023, 35(4): 214-225.
Sun L, Wei J, Duan D H, et al. Impact of land-use and land-cover change on urban air quality in representative cities of China[J]. Journal of Atmospheric and Solar-Terrestrial Physics, 2016, 142:43-54.
doi: 10.1016/j.jastp.2016.02.022
Xin Hua News Agency. The Central Committee of the Communist Party of China and the State Council decided to establish the Xiong’an new area in Hebei[EB/OL].(2017-04-01) [2017-05-31]. https://www.gov.cn/xinwen/2017-04/01/content5182824htm.
Wu C G, Zhou Z X, Xiao W F, et al. Dynamic monitoring of vegetation cover in Three Gorges reservoir area based on MODIS NDVI[J]. Scientia Silvae Sinicae, 2012, 48(1):22-28.
Liu B, Luo Q H. Chang W Z, et al. Soil and water conservation benefits of different forest and grass vegetation cover levels and suitable vegetation cover levels[J]. Soil and Water Conservation in China, 2008, 6(6):68-73.
He Q J, Cao J, Zhang Y W. Construction and application of MODIS based vegetation index series in Guangdong Province[J]. Meteorological Monthly, 2008, 34(3):37-41.
Peng F, Fan W J, Xu X R, et al. Analysis of spatial and temporal changes of vegetation cover in Hulunbuir grassland from 2000 to 2014[J]. Acta Scientiarum Naturalium Universitatis Pekinensis, 2017, 53(3):563-572.
Wang S, Zhang L L, Lin W B, et al. Research on vegetation cover and land use change in Guangdong Province based on MODIS-NDVI[J]. Acta Ecologica Sinica, 2022(6):2149-2163.
Jin C M, Yang X W, Jing H T. RS-based study on vegetation cover changes and driving forces in northern Shaanxi[J]. Remote Sensing for Natural Resources, 2021, 33(4):258-264.doi:10.6046/zrzyyg.2021019.
Su Y Q, Liu G, Zhao J B, et al. Evolution of early warning measures and spatial and temporal patterns of land ecological security in the Fen River Basin from 2006-2018[J]. Bulletin of Soil and Water Conservation, 2021, 41(1):144-151.
[10]
Kallimanis A S, Touloumis K, Tzanopoulos J, et al. Vegetation coverage change in the EU:Patterns inside and outside Natura 2000 protected areas[J]. Biodiversity and Conservation, 2015, 24(3): 579-591.
doi: 10.1007/s10531-014-0837-9
[11]
Jung G, Prange M, Schulz M. Influence of topography on tropical African vegetation coverage[J]. Climate Dynamics, 2016, 46(7):2535-2549.
doi: 10.1007/s00382-015-2716-9
Wang J F, Xu C D. Geodetectors:Principles and perspectives[J]. Acta Geographica Scinica, 2017, 72(1):116-134.
[13]
Wang G J, Peng W F. Quantifying spatiotemporal dynamics of vegetation and its differentiation mechanism based on geographical detector[J]. Environmental Science and Pollution Research, 2022, 29(21):32016-32031.
doi: 10.1007/s11356-021-17544-w
[14]
Deng X J, Hu S Z, Che S. Attribution of vegetation coverage change to climate change and human activities based on the geographic detectors in the Yellow River Basin,China[J]. Environmental Science and Pollution Researchinternational, 2022: 1-16.
Peng W F, Zhang D M, Luo Y M, et al. Geographical detection of natural factors on NDVI changes in Sichuan vegetation[J]. Acta Geographica Scinica, 2019, 74(9):1758-1776.
Li D, Zhou J, Zhan D Q. Analysis of spatial and temporal changes in arable land and drivers in Heilongjiang Province[J]. Scientia Geographica Sinica, 2021, 41(7):1266-1275.
Qi P W, Zhang X. Analysis of spatial and temporal variation characteristics of vegetation cover and its driving factors in Chongqing from 2000 to 2019[J]. Acta Ecologica Sinica, 2022, 42(13):5427-5436.
Zhao Z J, Fan B L, Wang Y T, et al. Study on the characteristics of spatial and temporal changes of vegetation cover and influencing factors in the West Liaoning River Basin from 2000 to 2018[J]. Journal of China Agricultural Resources and Regional Planning, 2021, 42(12):75-88.
Jia Y N, Zhang W C, Kang H T, et al. A study of land cover changes in Xiongan New Area from 2016 to 2019[J]. Bulletin of Surveying and Mapping, 2020(9):76-79.
Jiang L G, Lv P Y, Feng Z M, et al. Study on the spatial characteristics of land use in the Xiong’an New Area and the comparison of start-up area options[J]. Resources Science, 2017, 39(6):991-998.
Sun Y, Yi L, Yin S H. Vegetation cover changes in the Dongting Lake watershed and its synergistic management[J]. Economic Geography, 2022, 42(4):190-201.
Cao Y X, Mao D L, Xue J, et al. Vegetation cover dynamics in the oasis-desert transition zone and its driving factors:A case of Cele,Xinjiang[J]. Arid Zone Research, 2022, 39(2):510-521.
[23]
Sewnet A, Abebe G. Land use and land cover change and implication to watershed degradation by using GIS and remote sensing in the Koga watershed,North Western Ethiopia[J]. Earth science Informatics, 2018, 11(1): 99-108.
doi: 10.1007/s12145-017-0323-5
Lyu X, Shi Y Y, Huang X J, et al. Mapping characteristics of land use change in Jiangsu Province[J]. Chinese Journal of Applied Ecology, 2016, 27(4):1077-1084.
Wang J L, Shao J A, Li Y B. Characterization of agricultural and forest land use change mapping in the Three Gorges reservoir area in the last 20 a[J]. Journal of Natural Resources, 2015, 30(2):235-247.
Yang C Y, Wang S X, Yang C Y, et al. Spatial and temporal variation characteristics of vegetation cover along the Sichuan-Tibet Railway[J]. Journal of Arid Land Resources and Environment, 2021, 35(3):174-182.
[27]
Mishra R, Singh E, Kumar A. et al. Application of remote sensing for assessment of change in vegetation cover and the subsequent impact on climatic variables[J]. Environmental Science and Pollution Rellution Research, 2021, 28(31):41675-41687.
Li M M, Wu B F, Yan C Z, et al. Remote sensing estimation of vegetation cover in the upper reaches of Miyun Reservoir[J]. Resources Science, 2004, 26(4):153-159.
Wang W C, Xue P, Liu S H. Analysis of spatial and temporal evolution of vegetation cover in Henan Province from 1999 to 2018[J]. Research of Soil and Water Conservation, 2022, 29(2):243-248,264.
[30]
Gao S Q, Dong G T, Jiang X H, Nie T, et al. Quantification of natural and anthropogenic driving forces of vegetation changes in the Three-River headwater region during 1982 to 2015 based on geographical detector model[J]. Remote Sensing, 2021, 13(20): 4175.
doi: 10.3390/rs13204175
Wang Z X, Jiang Y J, Zhang Y Z, et al. Analysis of spatial distribution and drivers of rock desertification in karst trough valleys based on GIS and geodetectors[J]. Acta Geographica Scinica, 2019, 74(5):1025-1039.
Huang M Y, Yue W Z, Fang B, et al. Characteristics of ecological service value scale response and geodetection mechanism in Dabie Mountain area from 1970 to 2015[J]. Acta Geographica Scinica, 2019, 74(9):1904-1920.
 2023, Vol. 35
  ), 王世东1, 张学军2(