A method for inversion of urban land surface temperature and its application in domestic high-resolution thermal infrared data
LI Jinglun1,2,3(), CHEN Hong4, LI Kun1,2, DOU Xianhui5, ZHAO Hang6, ZENG Jian6, ZHANG Xuewen6, QIAN Yonggang1,2()
1. Key Laboratory of Digital Earth Science, Aerospace Information Research Institute, Chinese Academy of Sciences, Beijing 100094, China 2. International Research Center of Big Data for Sustainable Development Goals, Beijing 100094, China 3. University of Chinese Academy of Sciences, Beijing 100049, China 4. China Aero Geophysical Survey and Remote Sensing Center for Land and Resources, Beijing 100083, China 5. Land Satellite Remote Sensing Application Center, Ministry of Natural Resources, Beijing 100048, China 6. China Centre for Resources Satellite Data and Application, Beijing 100049, China
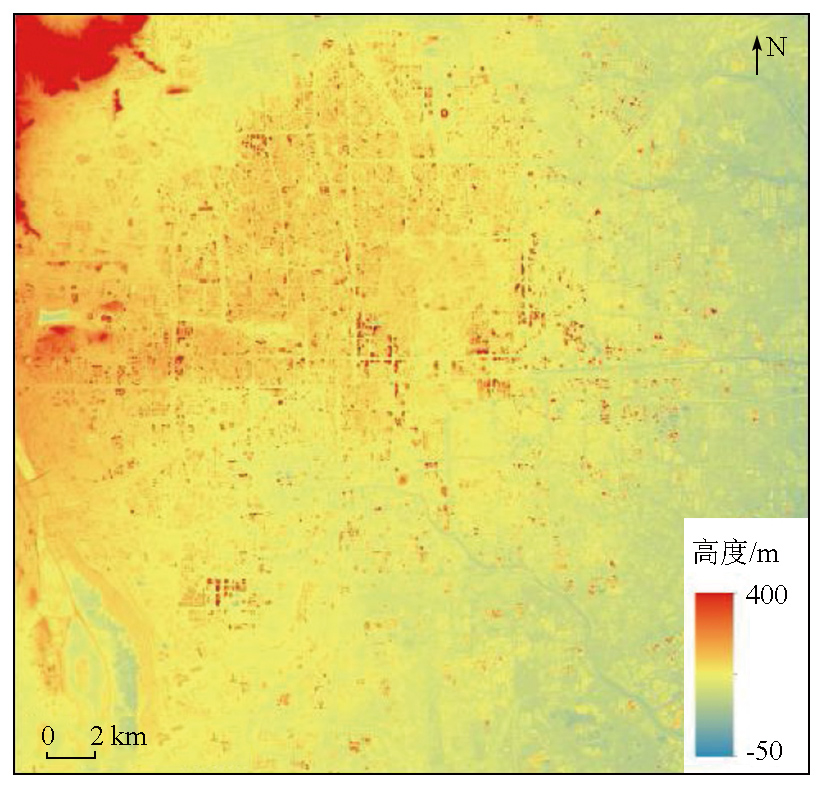
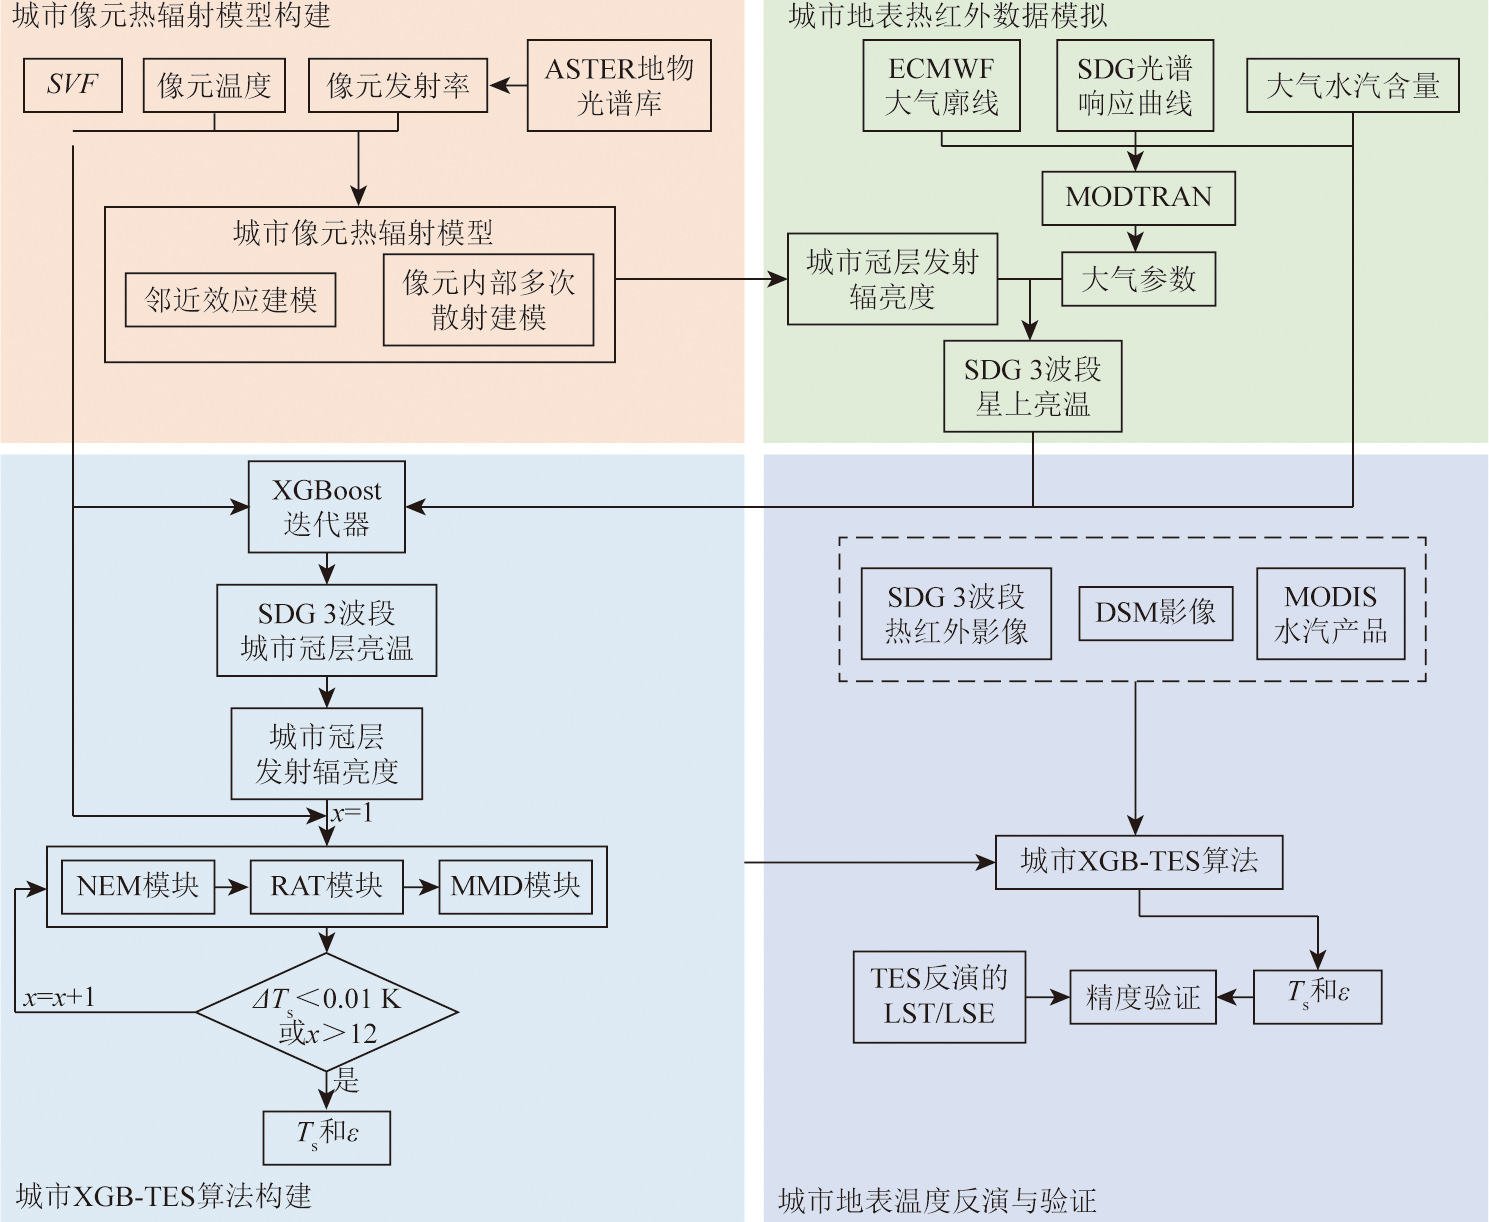
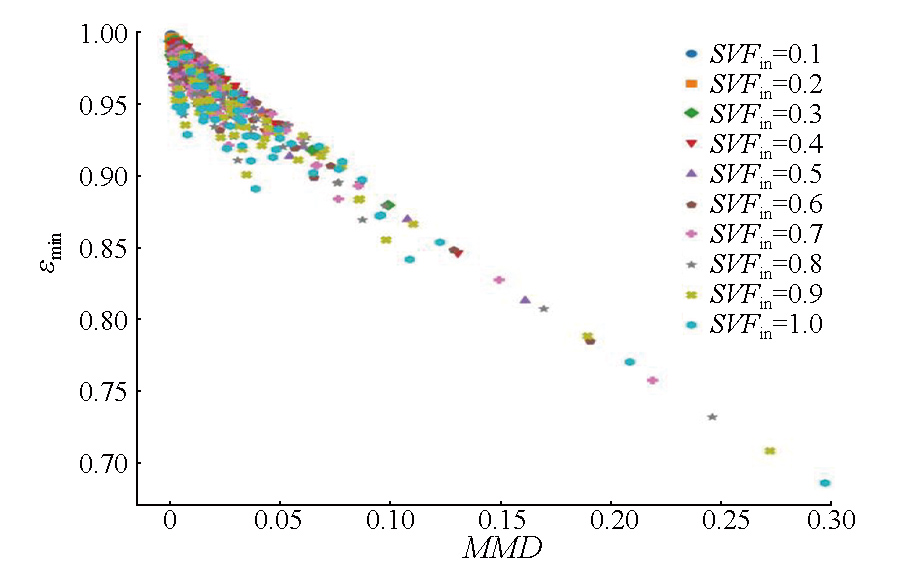
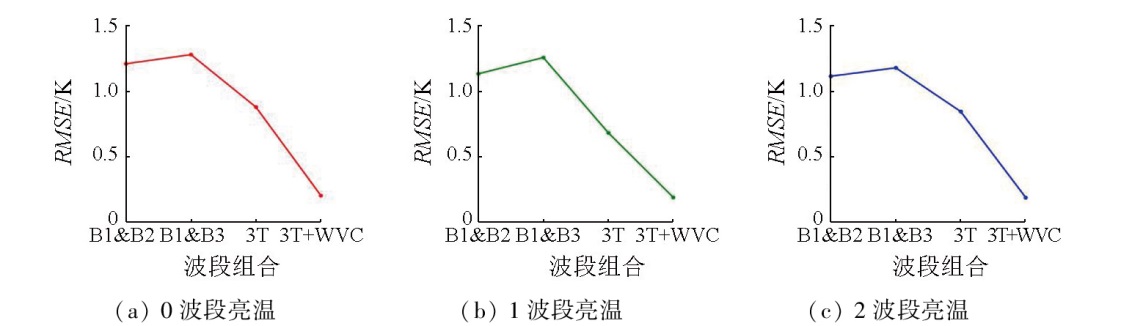
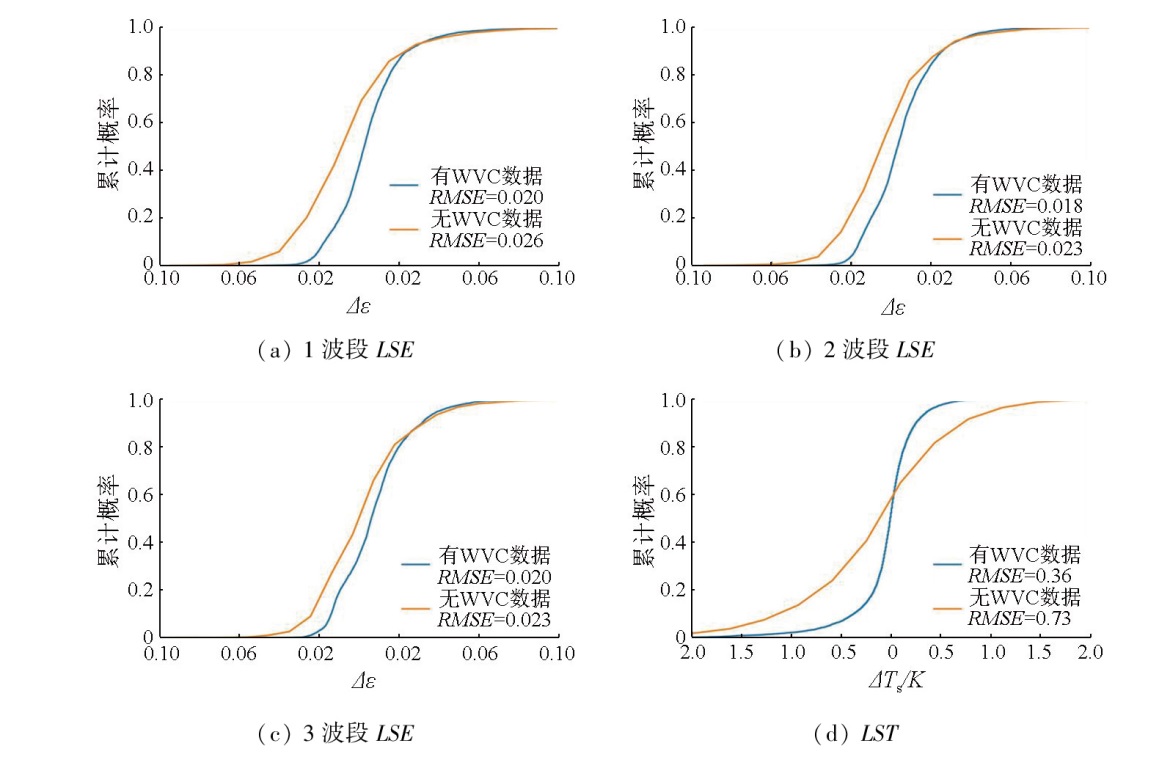
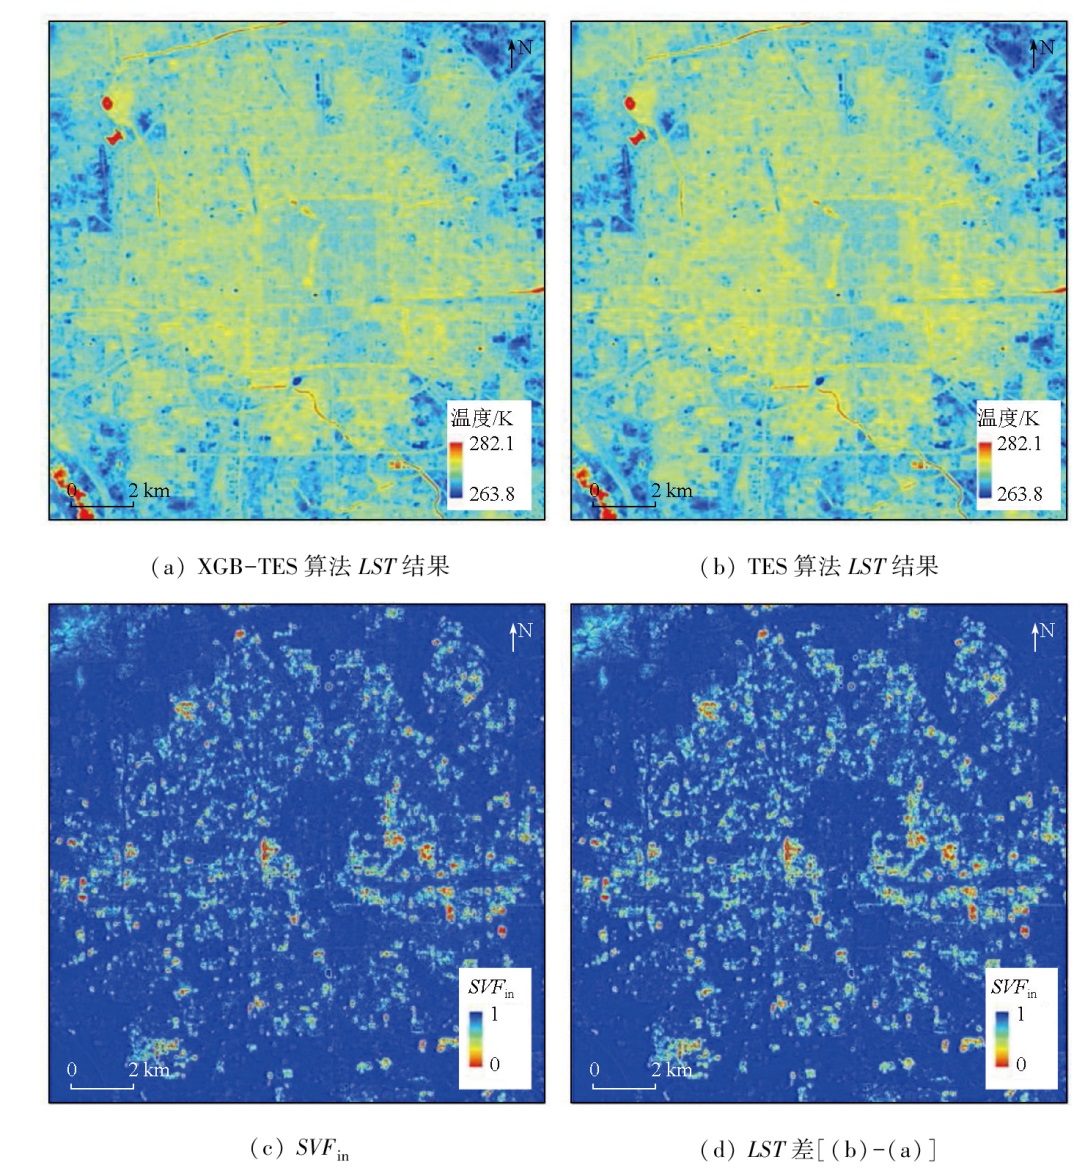
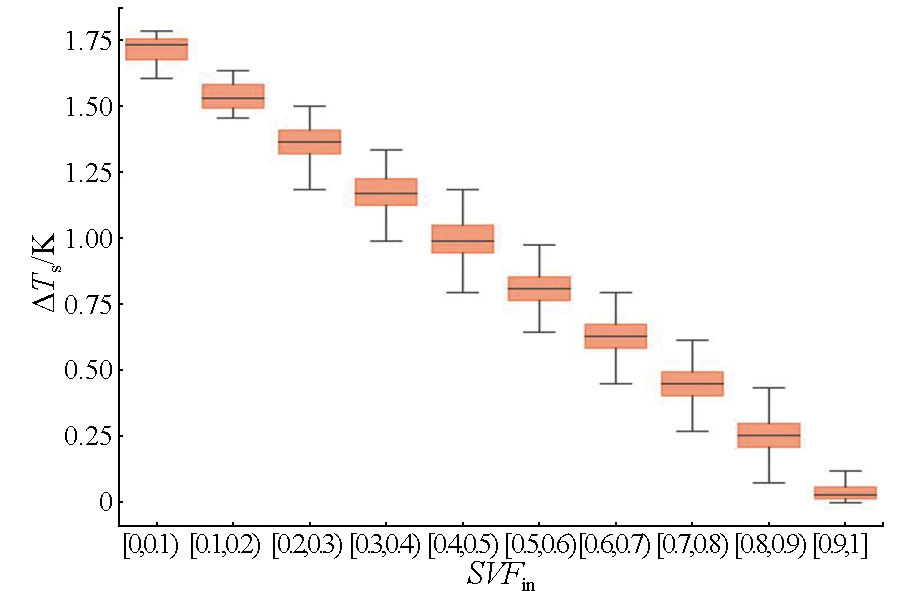
Compared to natural surfaces, urban surfaces have more complex geometric structures, leading to significant impacts of the multiple scattering effect within pixels and the neighborhood effect on the inversion results of urban land surface temperature (LST). This study proposed a novel urban LST inversion algorithm that integrates machine learning and an enhanced temperature and emissivity separation (TES) method. Finally, the proposed algorithm was applied to China’s SDGSAT-1 thermal infrared data. The algorithm comprises three key steps: First, the inversion of urban canopy brightness temperature from SDGSAT-1 data was conducted using the eXtreme Gradient Boosting (XGBoost) algorithm. Second, an enhanced TES algorithm based on the sky view factor (SVF) was developed to account for urban geometry, enabling high-precision urban LST inversion. Third, the accuracy of the inversion algorithm was assessed and applied to the urban area of Beijing. The results demonstrate that inversion using an XGBoost algorithm and a split-window algorithm yielded root mean squared errors (RMSEs) of approximately 0.2 K and 1.2 K, respectively. The LST RMSEs with and without available water vapor data were determined at 0.36 K and 0.73 K, respectively; and the LSE RMSEs under three bands were 0.020/0.026, 0.018/0.023, and 0.020/0.023, respectively. The differences in the LST inversion results derived using the original and improved TES algorithm ranged from 0 to 1.86 K.
李经纶, 陈虹, 李坤, 窦显辉, 赵航, 曾健, 张学文, 钱永刚. 国产高分辨率热红外数据城市地表温度反演及其应用[J]. 自然资源遥感, 2025, 37(4): 68-76.
LI Jinglun, CHEN Hong, LI Kun, DOU Xianhui, ZHAO Hang, ZENG Jian, ZHANG Xuewen, QIAN Yonggang. A method for inversion of urban land surface temperature and its application in domestic high-resolution thermal infrared data. Remote Sensing for Natural Resources, 2025, 37(4): 68-76.
Vidal A, Pinglo F, Durand H, et al. Evaluation of a temporal fire risk index in Mediterranean forests from NOAA thermal IR[J]. Remote Sensing of Environment, 1994, 49(3):296-303.
[2]
Dhara C. Constraining global changes in temperature and precipitation from observable changes in surface radiative heating[J]. Geophysical Research Letters, 2020, 47(9):e2020GL087576.
[3]
Li K, Qian Y, Wang N, et al. A four-component parameterized directional thermal radiance model for row canopies[J]. IEEE Transactions on Geoscience and Remote Sensing, 2022, 60:5000615.
[4]
Sandholt I, Rasmussen K, Andersen J. A simple interpretation of the surface temperature/vegetation index space for assessment of surface moisture status[J]. Remote Sensing of Environment, 2002, 79(2/3):213-224.
[5]
Li Z L, Wu H, Duan S B, et al. Satellite remote sensing of global land surface temperature:Definition,methods,products,and applications[J]. Reviews of Geophysics, 2023, 61(1):e2022RG-000777.
[6]
Bojinski S, Verstraete M, Peterson T C, et al. The concept of essential climate variables in support of climate research,applications,and policy[J]. Bulletin of the American Meteorological Society, 2014, 95(9):1431-1443.
[7]
Qin Z, Karnieli A, Berliner P. A mono-window algorithm for retrieving land surface temperature from Landsat TM data and its application to the Israel-Egypt border region[J]. International Journal of Remote Sensing, 2001, 22(18):3719-3746.
[8]
Becker F, Li Z L. Towards a local split window method over land surfaces[J]. International Journal of Remote Sensing, 1990, 11(3):369-393.
[9]
Gillespie A, Rokugawa S, Matsunaga T, et al. A temperature and emissivity separation algorithm for Advanced Spaceborne Thermal Emission and Reflection Radiometer (ASTER) images[J]. IEEE Transactions on Geoscience and Remote Sensing, 1998, 36(4):1113-1126.
[10]
Ma C, Qian Y, Li K, et al. Temperature and emissivity retrieval from hyperspectral thermal infrared data using dictionary-based sparse representation for emissivity[J]. IEEE Transactions on Geoscience and Remote Sensing, 2023, 61:5002016.
Li Z L, Duan S B, Tang B H, et al. Review of methods for land surface temperature derived from thermal infrared remotely sensed data[J]. Journal of Remote Sensing, 2016, 20(5):899-920.
[12]
Chen S, Ren H, Ye X, et al. Geometry and adjacency effects in urban land surface temperature retrieval from high-spatial-resolution thermal infrared images[J]. Remote Sensing of Environment, 2021, 262:112518.
[13]
Ru C, Duan S B, Jiang X G, et al. An extended SW-TES algorithm for land surface temperature and emissivity retrieval from ECOSTRESS thermal infrared data over urban areas[J]. Remote Sensing of Environment, 2023, 290:113544.
[14]
Chen L, Wang X, Cai X, et al. Seasonal variations of daytime land surface temperature and their underlying drivers over Wuhan,China[J]. Remote Sensing, 2021, 13(2):323.
[15]
Yang J, Wong M S, Menenti M, et al. Modeling the effective emissivity of the urban canopy using sky view factor[J]. ISPRS Journal of Photogrammetry and Remote Sensing, 2015, 105:211-219.
[16]
Yang J, Wong M S, Menenti M, et al. Development of an improved urban emissivity model based on sky view factor for retrieving effective emissivity and surface temperature over urban areas[J]. ISPRS Journal of Photogrammetry and Remote Sensing, 2016, 122:30-40.
[17]
Chen T, Guestrin C. XGBoost:A scalable tree boosting system[C]// Proceedings of the 22nd ACM SIGKDD International Conference on Knowledge Discovery and Data Mining. San Francisco California USA.ACM, 2016:785-794.
[18]
Yu B, Chen F, Ye C, et al. Temporal expansion of the nighttime light images of SDGSAT-1 satellite in illuminating ground object extraction by joint observation of NPP-VIIRS and sentinel-2A images[J]. Remote Sensing of Environment, 2023, 295:113691.
[19]
Guo H, Dou C, Chen H, et al. SDGSAT-1:The world’s first scientific satellite for sustainable development goals[J]. Science Bulletin, 2023, 68(1):34-38.
[20]
Watson I D, Johnson G T. Graphical estimation of sky view-factors in urban environments[J]. Journal of Climatology, 1987, 7(2):193-197.
[21]
Steger C R, Steger B, Schär C. HORAYZON v1.2:An efficient and flexible ray-tracing algorithm to compute horizon and sky view factor[J]. Geoscientific Model Development, 2022, 15(17):6817-6840.
[22]
Berk A, Anderson G, Acharya P. MODTRAN (R) 5.3.2 User’s Manual[J]. Spectral Sciences,Burlington,MA, 2013.
[23]
Zakšek K, Oštir K, Kokalj Ž. Sky-view factor as a relief visualization technique[J]. Remote Sensing, 2011, 3(2):398-415.
[24]
Hu L, Wang C, Ye Z, et al. Estimating gaseous pollutants from bus emissions:A hybrid model based on GRU and XGBoost[J]. Science of the Total Environment, 2021, 783:146870.
[25]
Zheng X, Li Z L, Wang T, et al. Determination of global land surface temperature using data from only five selected thermal infrared channels:Method extension and accuracy assessment[J]. Remote Sensing of Environment, 2022, 268:112774.
 2025, Vol. 37
  ), 陈虹4, 李坤1,2, 窦显辉5, 赵航6, 曾健6, 张学文6, 钱永刚1,2(