Inversion of total suspended matter concentration in Maowei Sea and its estuary, Southwest China using contemporaneous optical data and GF SAR data
DING Bo1,3(), LI Wei2(), HU Ke1
1. School of Ocean Sciences, China University of Geosciences (Beijing), Beijng 100083, China 2. Yantai Geological Survey Center of Coastal Zone, China Geological Survey, Yantai 264011, China 3. NewMark Technology (Beijing) Co., Ltd., Beijing 100085, China
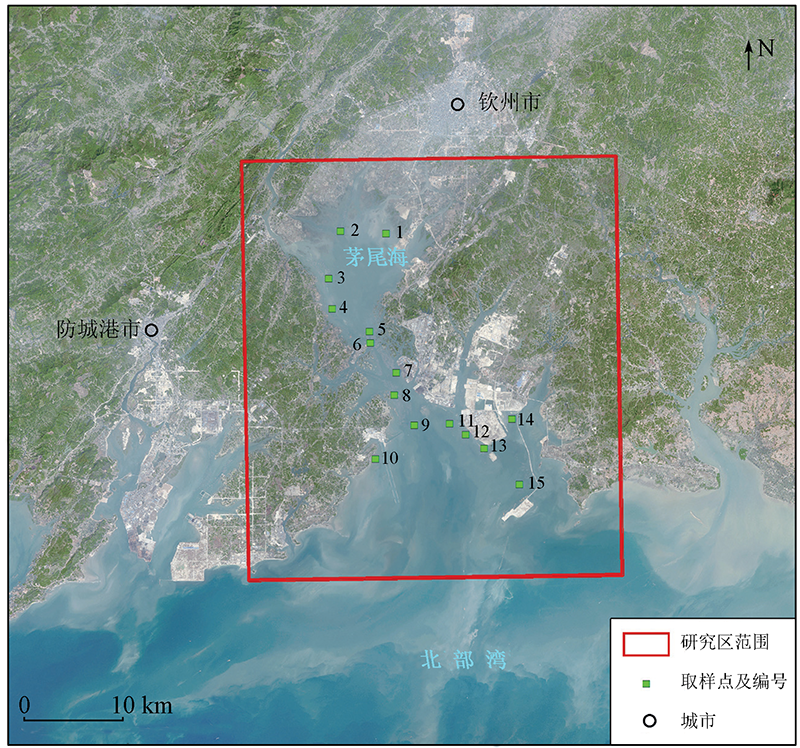
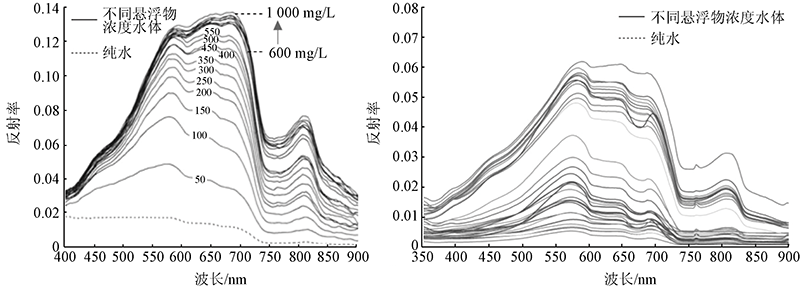
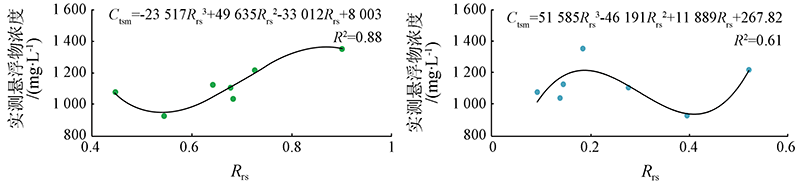
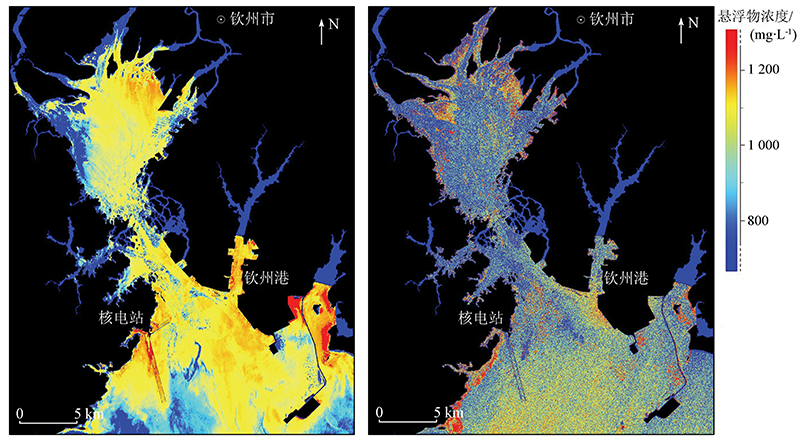
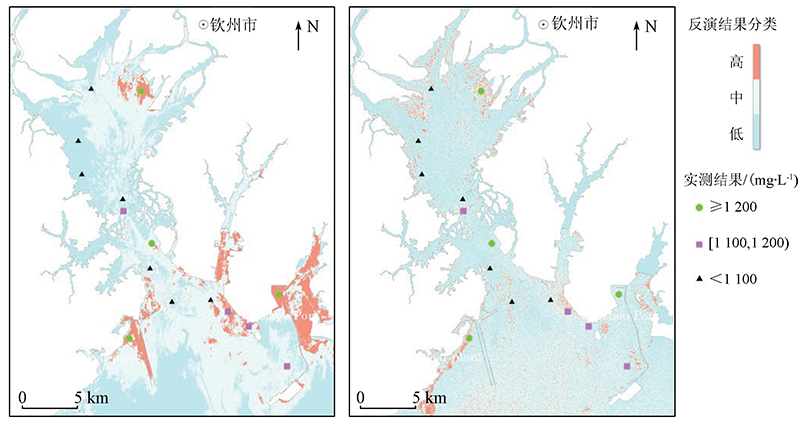
Total suspended matter concentration (TSMC) is one of the important factors influencing water bodies in coastal gulfs and lagoons. The rapid and accurate TSMC inversion can be obtained using remote sensing data. However, it is scarce to conduct TSMC inversion using two different data sources at the same time. This study conducted the inversion of TSMC in Maowei Sea and its estuary based on two data sources. Specifically, this study carried out image segmentation and object extraction using the dual-band ratio algorithm and the Cloude-Pottier target decomposition algorithm, respectively based on GF-1C optical images and GF-3 SAR data of September 2019. Meanwhile, contemporaneous field sample data were utilized. Then, the TSMC inversion was performed using the cubic polynomial regression algorithm. As revealed by the accuracy analysis, the fitting degree (R2), root mean square error, and mean relative percentage error of the GF-1C-based inversion model were 0.88, 130.25 mg/L, and 9.65%, respectively, while those of the GF-3-based inversion model were 0.61, 230.87 mg/L, and 15.13%, respectively. These indicate that the GF-1C-based TSMC inversion had a higher inversion accuracy (90.35%) than the GF-3-based TSMC inversion (84.87%). However, the inversion results of the two models showed highly similar distribution patterns. This further indicates that the inversion models established using two different data sources in this study can serve as references for TSMC inversion of Maowei Sea and its estuary and for the environmental monitoring in coastal zones.
丁波, 李伟, 胡克. 基于同期光学与微波遥感的茅尾海及其入海口水体悬浮物反演[J]. 自然资源遥感, 2022, 34(1): 10-17.
DING Bo, LI Wei, HU Ke. Inversion of total suspended matter concentration in Maowei Sea and its estuary, Southwest China using contemporaneous optical data and GF SAR data. Remote Sensing for Natural Resources, 2022, 34(1): 10-17.
Li J, Chen Y H, Liu Z G, et al. Remote sensing of island and coast environment[M]. Beijing: Science Press, 2010.
[2]
Miller R L, McKee B A. Using MODIS Terra 250 m imagery to map concentrations of total suspended matter in coastal waters[J]. Remote Sensing of Environment, 2004, 93(1-2):259-266.
doi: 10.1016/j.rse.2004.07.012
[3]
Astoreca R, Doxaran D, Ruddick K, et al. Influence of suspended particle concentration,composition and size on the variability of inherent optical properties of the Southern North Sea[J]. Continental Shelf Research, 2012, 35(2):117-128.
doi: 10.1016/j.csr.2012.01.007
[4]
May C L, Koseff J R, Lucas L V, et al. Effects of spatial and temporal variability of turbidity on phytoplankton blooms[J]. Marine Ecology Progress Series, 2003, 254(6):111-128.
doi: 10.3354/meps254111
[5]
Ondrusek M, Stengel E, Kinkade C S, et al. The development of a new optical total suspended matter algorithm for the Chesapeake Bay[J]. Remote Sensing of Environment, 2012, 119:243-254.
doi: 10.1016/j.rse.2011.12.018
[6]
Group S W. GEOTRACES:An international study of the global marine biogeochemical cycles of trace elements and their isotopes[J]. Chemie der Erde, 2007, 67(2):85-131.
doi: 10.1016/j.chemer.2007.02.001
[7]
Ouillon S, Douillet P, Petrenko A, et al. Optical algorithms at satellite wavelengths for total suspended matter in tropical coastal waters[J]. Sensors, 2008, 8(7):4165-85.
doi: 10.3390/s8074165
[8]
Shi L L, Mao Z, Wang Z. Retrieval of total suspended matter concentrations from high resolution WorldView-2 imagery:A case study of inland rivers[C]// IOP Conference Series:Earth and Environmental Science, 2018, 121(3):1-12.
[9]
Larrarte F, Pons M N. Suspended solids concentration in wastewater:Influence of sampling conditions[J]. Urban Water Journal, 2011, 8(6):397-404.
doi: 10.1080/1573062X.2011.630094
[10]
Clark R N. The spectral reflectance of water-mineral mixtures at low temperatures[J]. Journal of Geophysical Research:Solid Earth, 1981, 86(b4):3074-3086.
[11]
Kokaly R F, Clark R N, Swayze G A, et al. USGS Spectral Library Version 7[Z].U.S. Geological Survey Data Series 1035, 2017:1-68.
[12]
Malinowski R, Groom G, Schwanghart W, et al. Detection and delineation of localized flooding from WorldView-2 multispectral data[J]. Remote Sensing, 2015, 7(11):14853-14875.
doi: 10.3390/rs71114853
[13]
Knaeps E, Ruddick K G, Doxaran D, et al. A SWIR based algorithm to retrieve total suspended matter in extremely turbid waters[J]. Remote Sensing of Environment, 2015, 168:66-79.
doi: 10.1016/j.rse.2015.06.022
[14]
Wang L, Zhao D Z, Yang J H, et al. Retrieval of total suspended matter from MODIS 250 m imagery in the Bohai Sea of China[J]. Journal of Oceanography, 2012, 68(5):719-725.
doi: 10.1007/s10872-012-0129-5
[15]
Giannini M F C, Harari J, Ciotti A M, et al. The use of CBERS(China-Brazil earth resources satellite) to trace the dynamics of total suspended matter at an urbanized coastal area[J]. Brazilian Journal of Oceanography, 2017, 65(2):309-323.
doi: 10.1590/s1679-87592017135006502
[16]
Dekker A G, Vos R J, Peters S W M. Comparison of remote sensing data,model results and in situ data for total suspended matter(TSM) in the southern Frisian lakes[J]. The Science of the Total Environment, 2001, 268:197-214.
doi: 10.1016/S0048-9697(00)00679-3
Gao C, Xu J, Gao D, et al. Retrieval of concentration of total suspended matter from GF-1 satellite and field measured spectral data during flood period in Poyang Lake[J]. Remote Sensing for Land and Resources, 2019, 31(1):101-109.doi: 10.6046/gtzyyg.2019.01.14.
doi: 10.6046/gtzyyg.2019.01.14
[18]
Ngoc D D, Loisel H, Vantrepotte V, et al. A simple empirical band-ratio algorithm to assess suspended particulate matter from remote sensing over coastal and inland waters of Vietnam:Application to the VNREDSat-1/NAOMI sensor[J]. Water(Switzerland), 2020, 12(9):1-16.
[19]
Kishino M, Tanaka A, Ishizaka J. Retrieval of Chlorophyll a,suspended solids,and colored dissolved organic matter in Tokyo Bay using ASTER data[J]. Remote Sensing of Environment, 2005, 99:66-74.
doi: 10.1016/j.rse.2005.05.016
[20]
Ciancia E, Campanelli A, Lacava T, et al. Modeling and multi-temporal characterization of total suspended matter by the combined use of Sentinel 2-MSI and Landsat 8-OLI Data:The Pertusillo Lake case study(Italy)[J]. Remote Sensing, 2020, 12(13):1-24.
doi: 10.3390/rs12010001
[21]
Moore G. Satellite remote sensing of water turbidity[J]. Hydrological Sciences Bulletin, 1980, 25(4):407-421.
doi: 10.1080/02626668009491950
[22]
Chen J F, Zagzebski J A, Madsen E L, et al. Tests of backscatter coefficient measurement using broadband pulses[J]. IEEE Transactions on Ultrasonics,Ferroelectrics,and Frequency Control, 1993, 40(5):603-607.
doi: 10.1109/58.238114
[23]
Lavarello R J, Ghoshal G, Oelze M L. On the estimation of backscatter coefficients using single-element focused transducers[J]. The Journal of the Acoustical Society of America, 2011, 129(5):2903-2911.
doi: 10.1121/1.3557036
Liu G X, Liu W X, Huang D F. In SAR technology and its key problems in applications[J]. Bulletin of Surveying and Mapping, 2001, 1:21-24.
[25]
Kritikos H, Yorinks L, Smith H. Suspended solids analysis using ERTS-A data[J]. Remote Sensing of Environment, 1974, 3:69-78.
doi: 10.1016/0034-4257(74)90039-X
Wang F, Zhou B, Xu J M, et al. Remote sensing inversion mode of suspended particles concentration in Hangzhou Bay based on in situ measurement spectrum[J]. Environmental Science, 2008, 11:3022-3026.
[27]
Shi W, Zhang Y L, Wang M H, et al. Deriving total suspended matter concentration from the near-infrared-based inherent optical properties over turbid waters:A case study in Lake Taihu[J]. Remote Sensing, 2018, 10(2):333-350.
doi: 10.3390/rs10020333
China Geological Survey. DD2014-03 Specification for survey and evaluation of coastal geological environment[S]. Beijing:China Geological Survey, 2014.
Introduction of GF series satellites[N]. http://www.cheos.org.cn/n380375/n380413/index.html.
[31]
Clark R N, Swayze G A, Wise R, et al. USGS digital spectral library splib06a[Z]. U.S.Geological Survey,Digital Data Series 231,2007.
[32]
Xu J, Gao C, Wang Y. Extraction of spatial and temporal patterns of concentrations of chlorophyll-a and total suspended matter in Poyang Lake using GF-1 satellite data[J]. Remote Sensing, 2020, 12(4):1-21.
doi: 10.3390/rs12010001
Zhong K W, Liu X L, Xie L, et al. Study on inversion model for the suspended sediment concentration in the Pear River delta using remote sensing technology[J]. Remote Sensing Information, 2009, 12(3):49-52.
[34]
Lee J S. A simple speckle smoothing algorithm for synthetic aperture Radar images[J]. IEEE Transactions on Systems, Man, and Cybernetics, 1983, SMC- 13(1):85-89.
[35]
Lee JS, Wen J H, Ainsworth T L, et al. Improved sigma filter for speckle filtering of SAR imagery[J]. IEEE Transactions on Geoscience and Remote Sensing, 2009, 47(1):202-213.
doi: 10.1109/TGRS.36
[36]
Lee J S, Grunes M R, Mango S A. Speckle reduction in multipolarization,multifrequency SAR imagery[J]. IEEE Transactions on Geoscience and Remote Sensing, 1991, 29(4):535-544.
doi: 10.1109/36.135815
[37]
Lee J S, Grunes M, Schuler D, et al. Scattering-model-based Speckle filtering of polarimetric SAR data[J]. IEEE Transactions on Geoscience and Remote Sensing, 2006, 44:176-187.
doi: 10.1109/TGRS.2005.859338
[38]
Tian S, Eltoft T. Gamma-WMAP:A wavelet based statistical speckle filter for SAR images[C]// 5th Nordic Signal Processing Symposium, 2002.
[39]
López C, Fàbregas X, Mallorquí J, et al. Noise filtering of SAR interferometric phase based on wavelet transform[C]// International Geoscience and Remote Sensing Symposium(IGARSS), 2001:2928-2930.
Bu F L, Xu X. Speckle filtering method of SAR images based on wavelet analysis[J]. Geomatics and Information Science of Wuhan University, 2001, 4:315-319.
[41]
Cloude S R, Pottier E. A review of target decomposition theorems in Radar polarimetry[J]. IEEE Transactions on Geoscience and Remote Sensing, 1996, 34(2):498-518.
doi: 10.1109/36.485127
Cao F, Hong W, Wu Y R. An unsupervised classification for fully polarimetric SAR data using Cloude-Pottier decomposition and agglomerative hierarchical clustering algorithm[J]. Acta Electronica Sinica, 2008, 3:543-546.
Yang J, Lang F K, Li D R. An unsupervised Wishart classification for fully polarimetric SAR image based on Cloude-Pottier decomposition and polarimetric whitening filter[J]. Geomatics and Information Science of Wuhan University, 2011, 36(1):104-107.
Cao S, Liu X N, Liu M L, et al. Monitoring marine suspended particulate matter concentration using full polarimetric SAR data of Radarsat-2[J]. Journal of Tropical Oceanography, 2013, 32(4):107-112.
Huang H H, Liao X L, Dai M, et al. Report of ecological environment and status assessment in Maowei Sea[R]. Guangzhou:Chinese Academy of Fishery Sciences, 2013.
 2022, Vol. 34
  ), 李伟2(