Information extraction of aquaculture ponds in the Jianghan Plain based on Sentinel-2 time-series data
CHEN Zhiyang1(), MAO Dehua2, WANG Zongming2, LIN Nan1, JIA Mingming2, REN Chunying2, WANG Ming2()
1. School of Geomatics and Prospecting Engineering, Jilin Jianzhu University, Changchun 130119, China 2. Key Laboratory of Wetland Ecology and Environment, Northeast Institute of Geography and Agroecology, Chinese Academy of Sciences, Changchun 130102, China
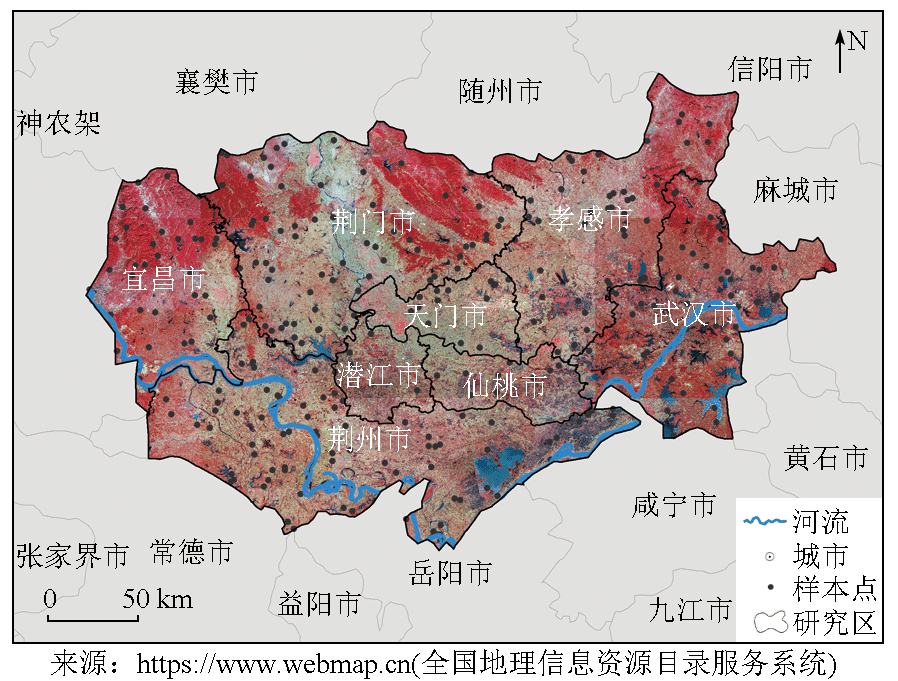
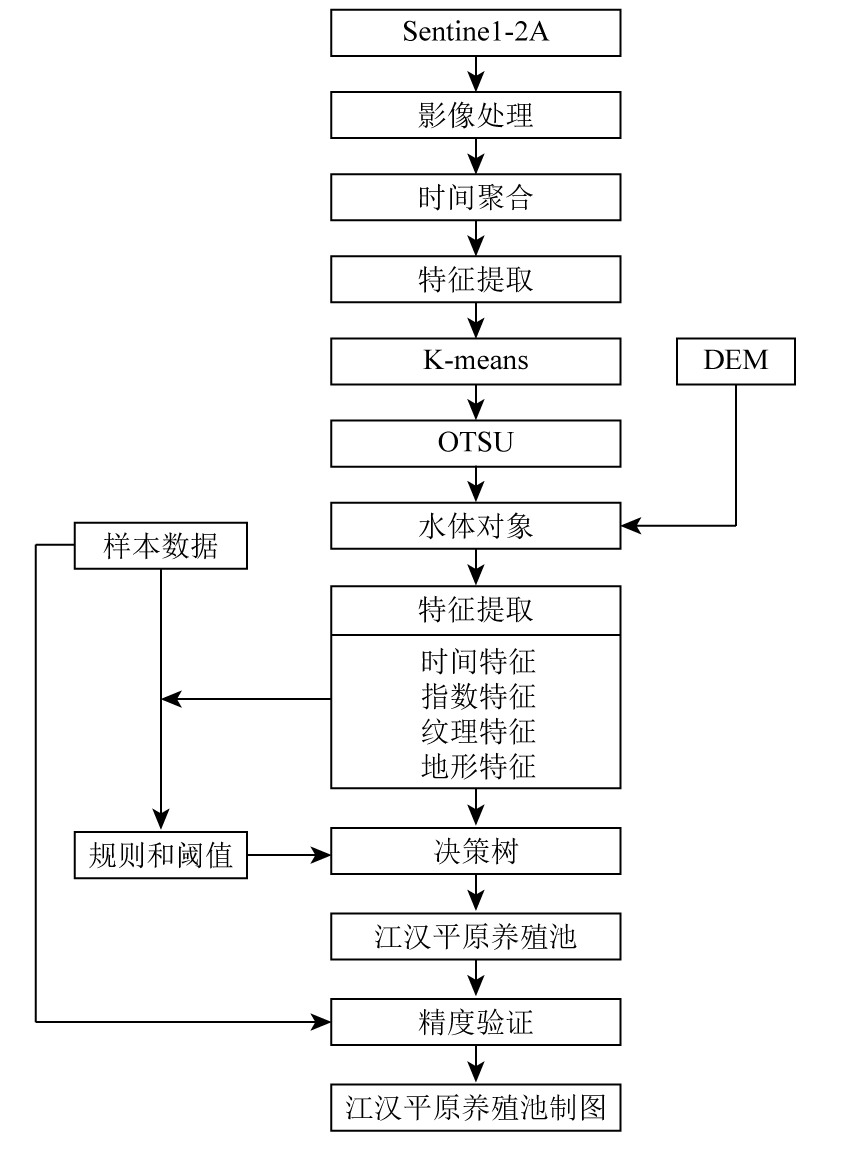
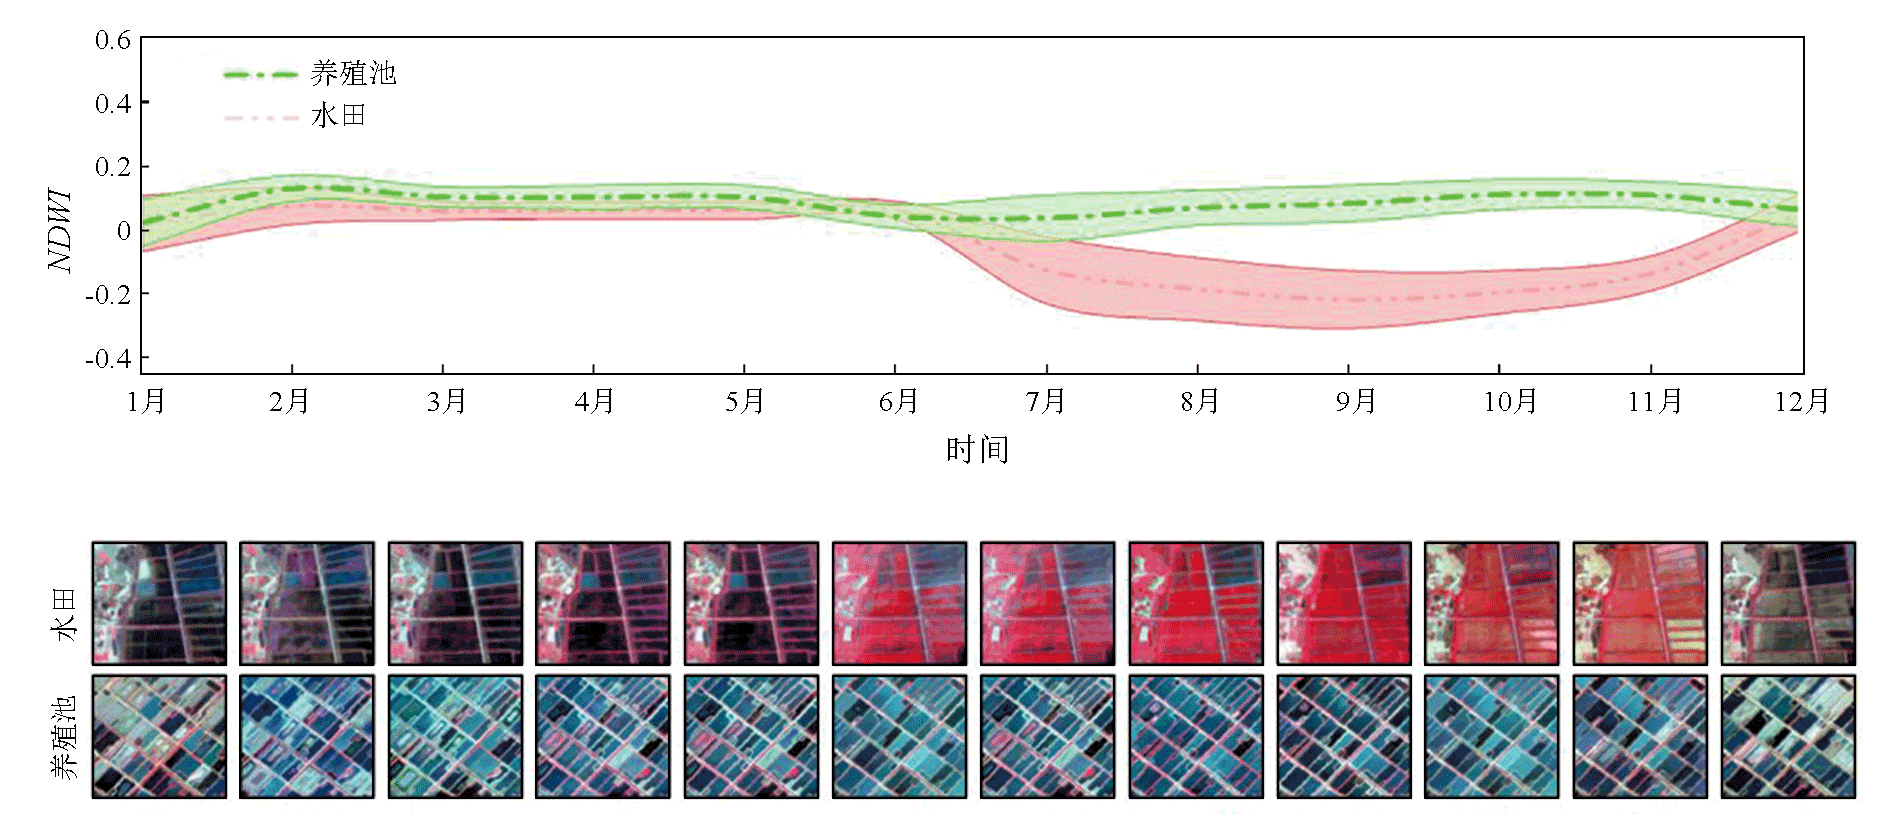
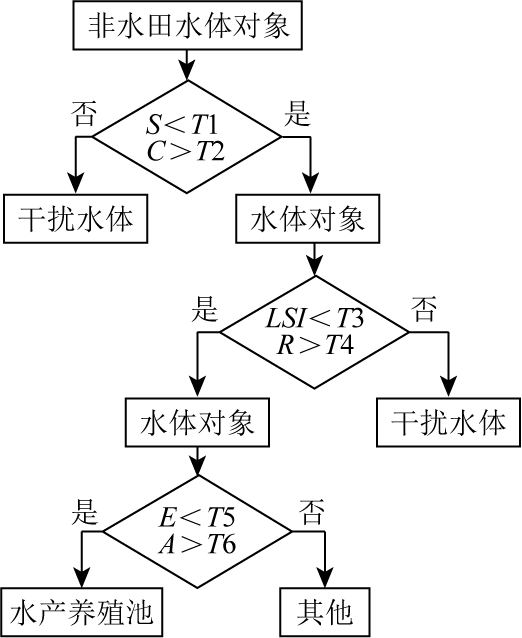
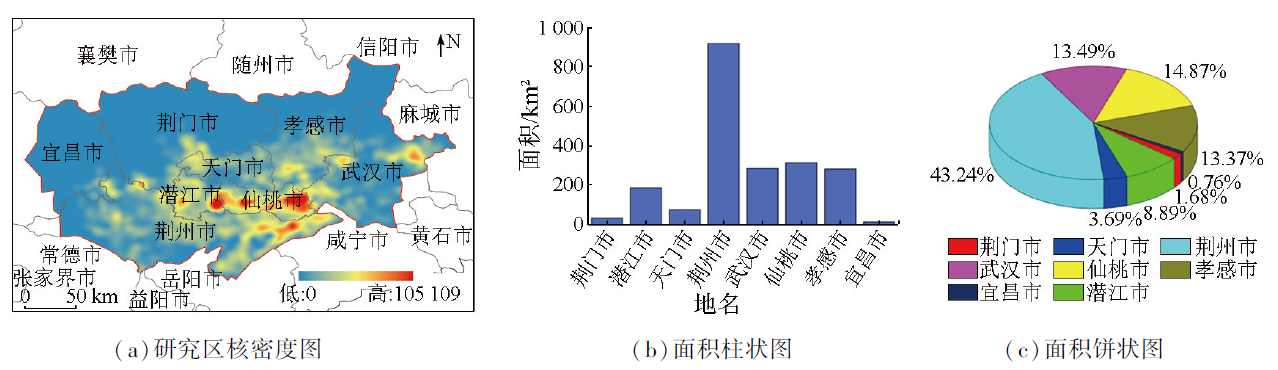
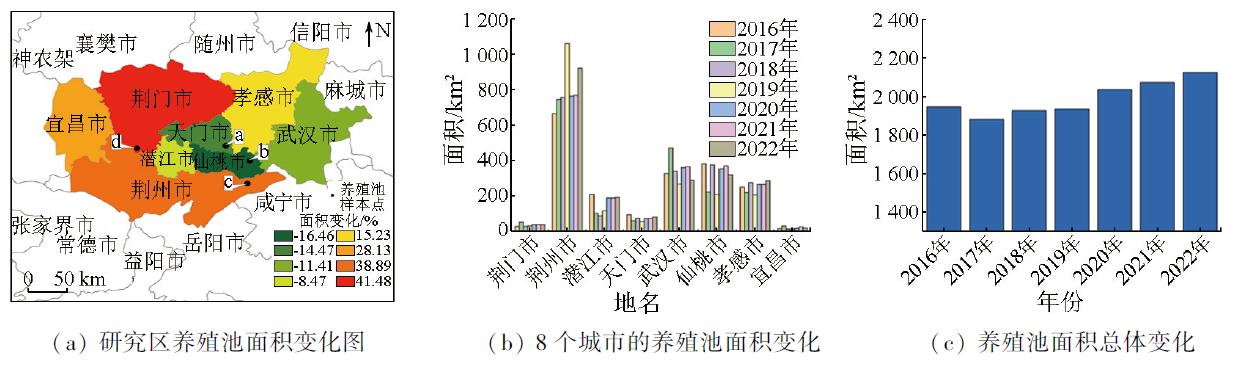
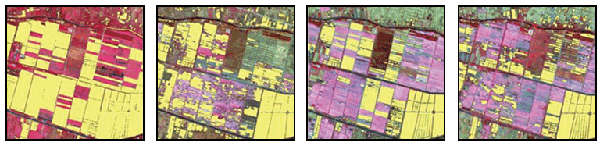
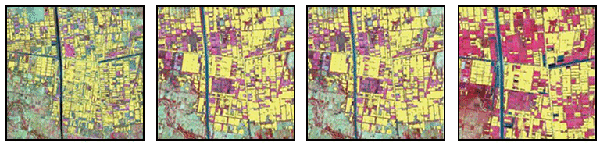
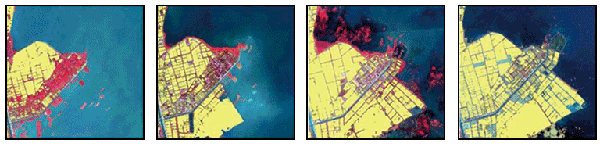
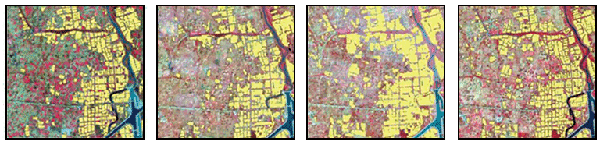
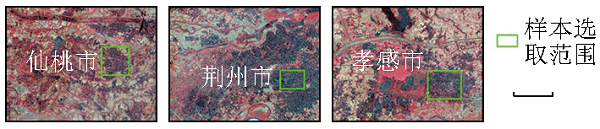
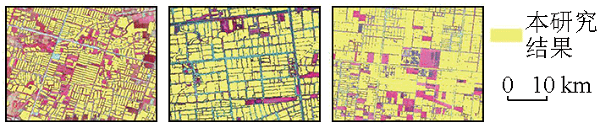
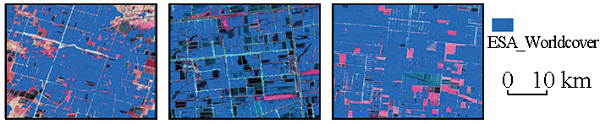
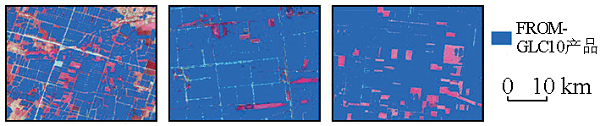
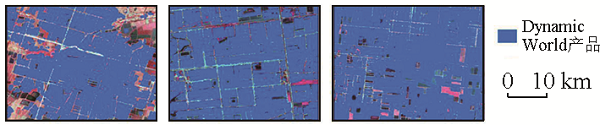
In recent years, the rapid expansion of the aquaculture pond industry has given rise to a series of ecological and environmental issues. The Jianghan Plain is recognized as one of the most important freshwater aquaculture bases in China, and investigating changes in its aquaculture ponds is crucial for China’s ecological conservation. Focusing on the Jianghan Plain, this study proposed a method for extracting and monitoring changes in aquaculture ponds using Google Earth Engine (GEE) and Sentinel-2 dense time-series images. Using this method, which combined K-means clustering and a hierarchical decision tree classification algorithm, this study achieved accurate information extraction and spatiotemporal pattern analyses of aquaculture ponds in the plain in each year from 2016 to 2022. The results indicate that the combination of K-means and the hierarchical decision tree algorithm that integrated time-varying features allowed for accurate classification of aquaculture ponds, with an overall classification accuracy of 91.90% and a Kappa coefficient exceeding 0.84. In 2022, the aquaculture pond area of Jianghan Plain is 2 126.43 km2. Among these area of aquaculture ponds, 43.24% were concentrated in Jingzhou City, while Yichang City had the fewest area of aquaculture ponds, accounting for only 0.76%. From 2016 to 2022, aquaculture ponds in the Jianghan Plain exhibited an upward trend overall and dynamics with pronounced spatial heterogeneity. Specifically, the total area increased to 2 126.43 km2 from 1 947.43 km2, increasing by 9.19%. The proposed methodology provides an important reference for the precise monitoring of aquaculture ponds, and the resulting dataset serves as a valuable reference and holds great practical significance for the ecological conservation and the assessment of sustainable development goals in the Jianghan Plain.
陈志洋, 毛德华, 王宗明, 林楠, 贾明明, 任春颖, 王铭. 基于时序Sentinel-2数据的江汉平原养殖池提取[J]. 自然资源遥感, 2025, 37(1): 169-178.
CHEN Zhiyang, MAO Dehua, WANG Zongming, LIN Nan, JIA Mingming, REN Chunying, WANG Ming. Information extraction of aquaculture ponds in the Jianghan Plain based on Sentinel-2 time-series data. Remote Sensing for Natural Resources, 2025, 37(1): 169-178.
Ren C, Wang Z, Zhang Y, et al. Rapid expansion of coastal aquaculture ponds in China from Landsat observations during 1984—2016[J]. International Journal of Applied Earth Observation and Geoinformation, 2019,82:101902.
[2]
Sun Z, Luo J H, Yang J Z C, et al. Dynamics of coastal aquaculture ponds in Vietnam from 1990 to 2015 using Landsat data[J]. IOP Conference Series:Earth and Environmental Science, 2020,502:012029.
[3]
Duan Y, Li X, Zhang L, et al. Mapping national-scale aquaculture ponds based on the Google Earth Engine in the Chinese coastal zone[J]. Aquaculture, 2020,520:734666.
[4]
Ottinger M, Bachofer F, Huth J, et al. Mapping aquaculture ponds for the coastal zone of Asia with sentinel-1 and sentinel-2 time series[J]. Remote Sensing, 2021, 14(1):153.
[5]
Duan Y, Li X, Zhang L, et al. Detecting spatiotemporal changes of large-scale aquaculture ponds regions over 1988—2018 in Jiangsu Province,China using Google Earth Engine[J]. Ocean & Coastal Management,2020,188:105144.
[6]
Duan Y, Tian B, Li X, et al. Tracking changes in aquaculture ponds on the China coast using 30 years of Landsat images[J]. International Journal of Applied Earth Observation and Geoinformation, 2021,102:102383.
[7]
Li A, Song K, Chen S, et al. Mapping African wetlands for 2020 using multiple spectral,geo-ecological features and Google Earth Engine[J]. ISPRS Journal of Photogrammetry and Remote Sensing, 2022,193:252-268.
[8]
Ottinger M, Clauss K, Kuenzer C. Opportunities and challenges for the estimation of aquaculture production based on earth observation data[J]. Remote Sensing, 2018, 10(7):1076.
[9]
Sun Z, Luo J, Yang J, et al. Nation-scale mapping of coastal aquaculture ponds with sentinel-1 SAR data using google earth engine[J]. Remote Sensing, 2020, 12(18):3086.
Wan M, Liu M X, Huang J, et al. The research and analysis of ecological wisdom in urban eight scenes:Taking Jianghan Plain as an example[J]. Chinese Landscape Architecture, 2022, 38(7):18-25.
[11]
Tassi A, Vizzari M. Object-oriented LULC classification in Google Earth Engine combining SNIC,GLCM,and machine learning algorithms[J]. Remote Sensing, 2020, 12(22):3776.
[12]
Tucker C J. Monitoring the grasslands of the sahel 1984—1985[J]. Remote Sensing of Environment, 1979,8:127-150.
[13]
Gao B C. NDWI—a normalized difference water index for remote sensing of vegetation liquid water from space[J]. Remote Sensing of Environment, 1996, 58(3):257-266.
[14]
Zhu Z, Wang S, Woodcock C E. Improvement and expansion of the Fmask algorithm:Cloud,cloud shadow,and snow detection for Landsats 4—7,8,and Sentinel 2 images[J]. Remote Sensing of Environment, 2015,159:269-277.
[15]
Xu H. Modification of normalised difference water index (NDWI) to enhance open water features in remotely sensed imagery[J]. International Journal of Remote Sensing, 2006, 27(14):3025-3033.
[16]
Zha Y, Gao J, Ni S. Use of normalized difference built-up index in automatically mapping urban areas from TM imagery[J]. International Journal of Remote Sensing, 2003, 24(3):583-594.
Wang E L, Xu L, Han H W, et al. Extracting river ice concentration in cold regions based on the OTSU algorithm[J]. Journal of Basic Science and Engineering, 2021, 29(6):1429-1439.
[18]
Wang M, Mao D, Xiao X, et al. Interannual changes of coastal aquaculture ponds in China at 10-m spatial resolution during 2016—2021[J]. Remote Sensing of Environment, 2023,284:113347.
[19]
Otsu N. A threshold selection method from gray-level histograms[J]. IEEE Transactions on Systems,Man,and Cybernetics, 1979, 9(1):62-66.
[20]
Kolli M K, Opp C, Karthe D, et al. Automatic extraction of large-scale aquaculture encroachment areas using Canny Edge Otsu algorithm in Google Earth Engine:The case study of Kolleru Lake,South India[J]. Geocarto International, 2022, 37(26):11173-11189.
[21]
Vickers N J. Animal communication:When I’m calling you,will you answer too?[J]. Current Biology, 2017, 27(14):R713-R715.
[22]
Hartigan J A, Wong M A. Algorithm AS 136:A K-means clustering algorithm[J]. Applied Statistics, 1979, 28(1):100.
Jia K, Chen S S, Jiang W G. Long time-series remote sensing monitoring of mangrove forests in the Guangdong-Hong Kong-Macao Greater Bay Area[J]. National Remote Sensing Bulletin, 2022, 26(6):1096-1111.
 2025, Vol. 37
  ), 毛德华2, 王宗明2, 林楠1, 贾明明2, 任春颖2, 王铭2(