|
|
 |
|

|
|
|
Construction and application effect of normalized shadow vegetation index NSVI based on PROBA/CHRIS image |
HU Xinyu1,2( ), XU Zhanghua1,2,3,4,5,6(), CHEN Wenhui1,2, CHEN Qiuxia7, WANG Lin1,2,3,4, LIU Hui1,2,3,4, LIU Zhicai1,2,3,4 ), XU Zhanghua1,2,3,4,5,6(), CHEN Wenhui1,2, CHEN Qiuxia7, WANG Lin1,2,3,4, LIU Hui1,2,3,4, LIU Zhicai1,2,3,4 |
1. School of Environment and Resources, Fuzhou University, Fuzhou 350108, China
2. Research Center of Geography and Ecological Enviroment, Fuzhou University Fuzhou 350108, China
3. Key Laboratory of Spatial Data Mining and Information Sharing, Ministry of Education, Fuzhou 350108, China
4. Key Laboratory of Remote Sensing Monitoring and Assessment and Disaster Prevention of Soil and Water Loss, Fujian Province, Fuzhou 350108, China
5. University Key Lab for Geomatics Technology & Optimize Resource Utilization in Fujian Province, Fuzhou 350002, China;
6. Postdoctoral Research Station of Information and Communication Engineering, Fuzhou University, Fuzhou 350108, China
7. School of Public Administration, Fujian Agriculture and Forestry University, Fuzhou 350002, China |
|
|
|
|
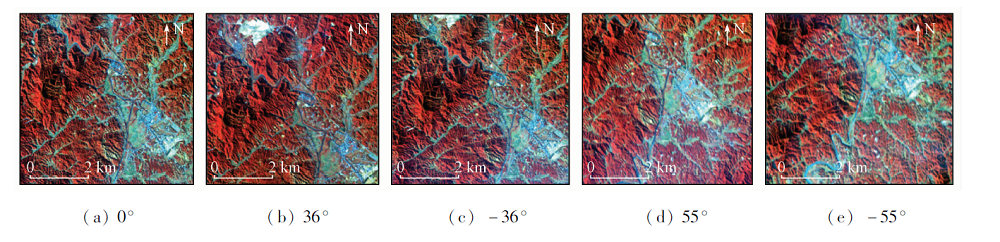
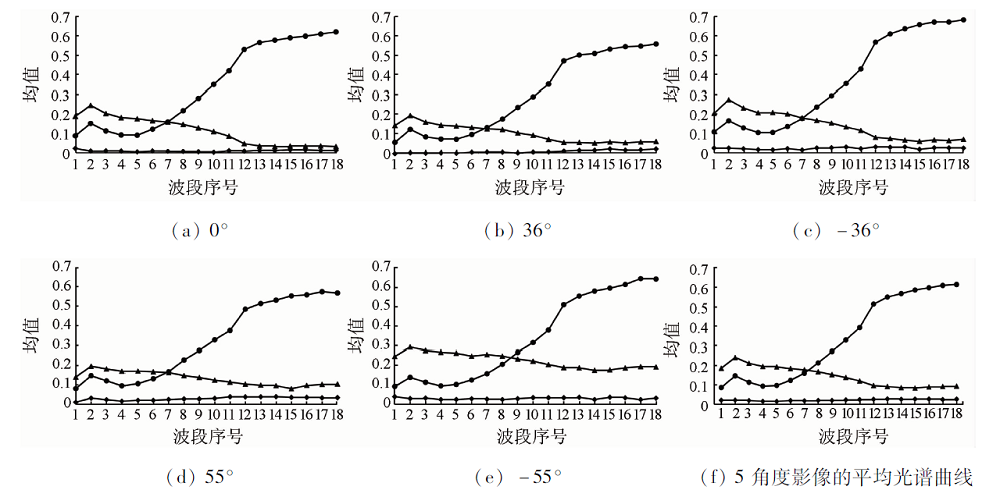
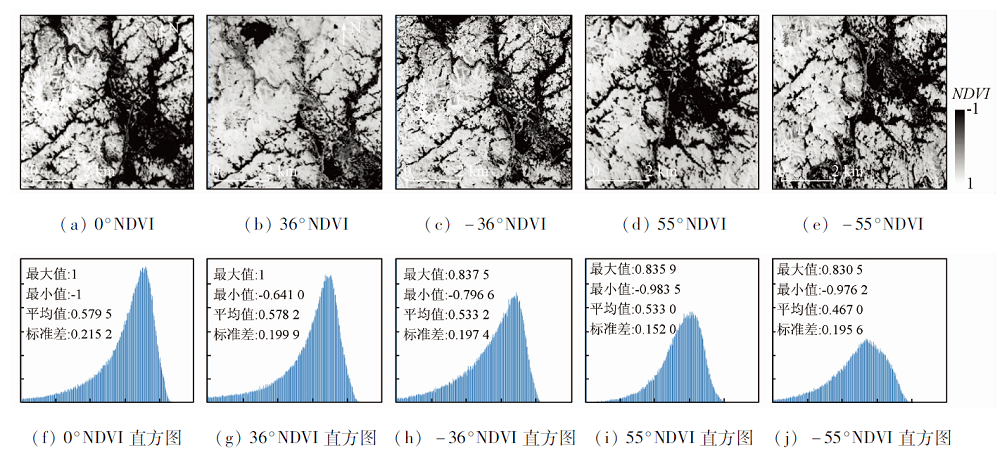
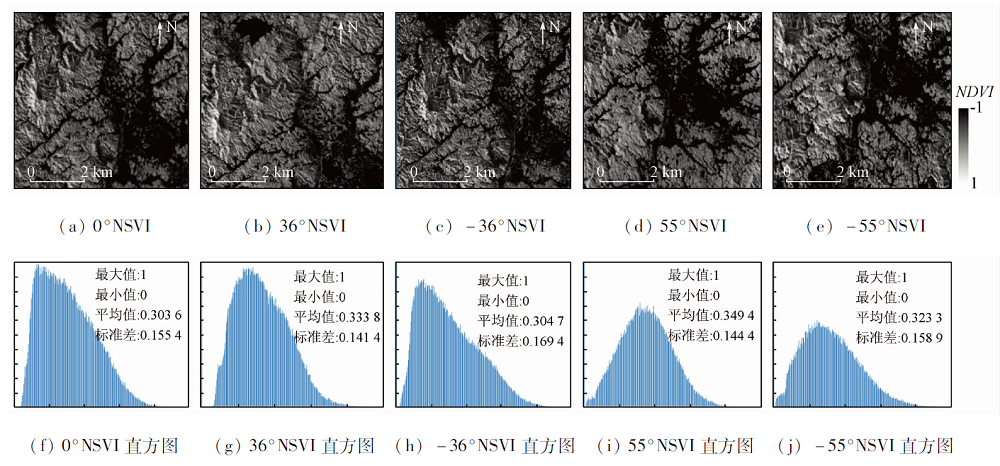
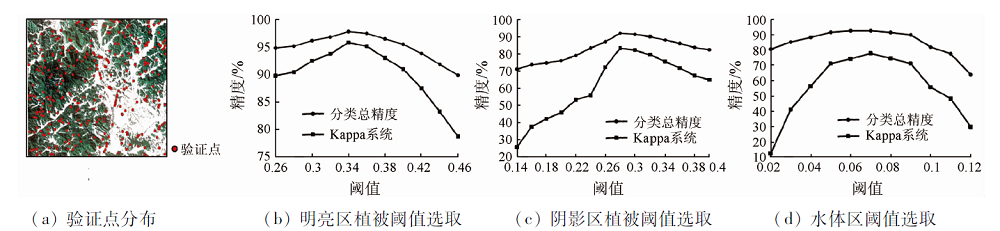
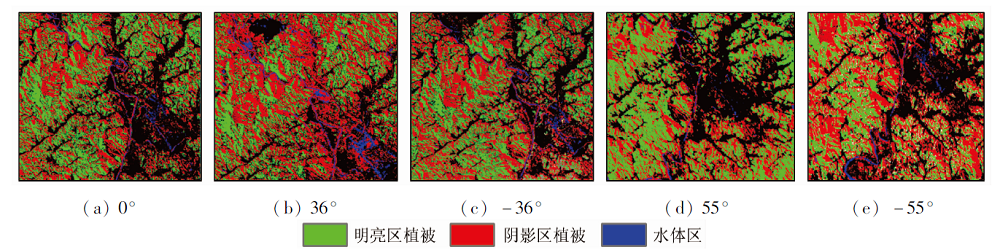
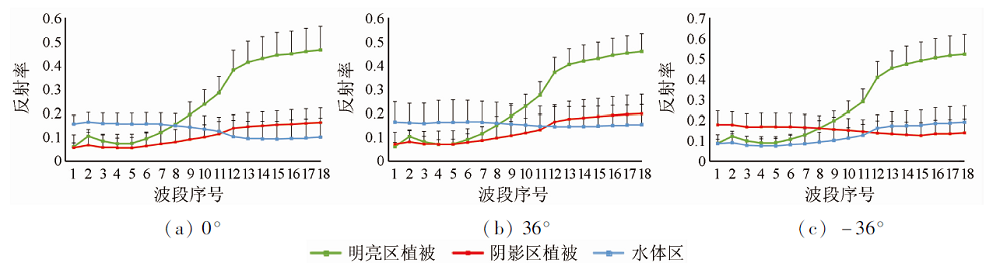
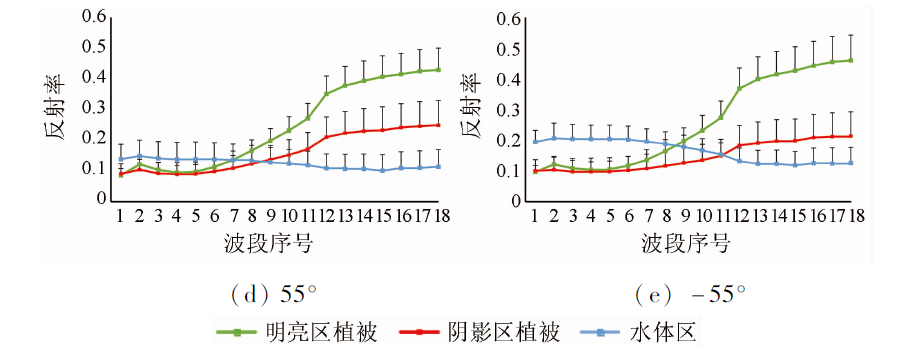
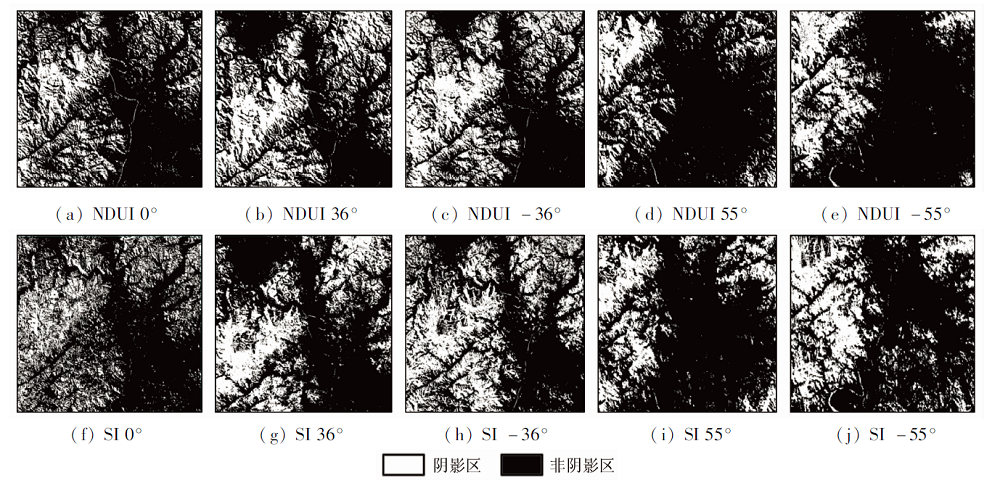
Abstract Shadow is a common interference factor in remote sensing image interpretation in mountainous and hilly areas. The study of shadow detection in hyperspectral remote sensing images is helpful to removing shadow and giving full play to its advantage of hyperspectral resolution. Taking the multi-angle hyperspectral image PROBA/CHRIS as the data source, this paper tries to increase the spectral differences among three typical ground objects, namely, bright area vegetation, shadow area vegetation and water area, selects the characteristic bands by using the sequential projection algorithm (SPA), and analyzes the spectral characteristics of typical ground objects in the original band of CHRIS image and normalized difference vegetation index. Therefore, the normalized shaded vegetation index (NSVI) of the image is constructed. The reasonable threshold is set based on the step-size method, and the images are classified. The ability of NSVI to detect CHRIS shadow is evaluated from two aspects of classification accuracy and spectral difference enhancement effect. The results show that B9 and B15 can be used as the characteristic bands for constructing NSVI of CHRIS images by using SPA to select the band subset with the smallest root-mean-square error (RMSE) and discard the edge bands. CHRIS multi-angle images are classified based on NSVI threshold method. The classification accuracy of three kinds of land in each angle image is above 94%, and the total Kappa is higher than 0.89. The classification effect of 0° image is the best. The sub-images of the three classified land objects are obtained through the mask, and the spectral mean values of the sub-images are different. However, considering the standard deviation, it is found that the spectral overlap phenomenon is obvious, which indicates that NSVI can enhance the spectral differences among typical land objects and improve the separability between spectral confusion pixels. By further comparing the shadow detection effects of NSVI with NDUI and SI, it also proves the shadow detection ability of NSVI, which shows that the constructed NSVI can be applied to shadow detection of PROBA/CHRIS hyperspectral image and can provide important support for shadow removal and shadow information restoration of this image.
|
| Keywords
PROBA/CHRIS image
normalized shaded vegetation index (NSVI)
shadow detection
hyperspectral remote sensing
spectral characteristics
|
|
|
|
Corresponding Authors:
XU Zhanghua
E-mail: 386311895@163.com;fafuxzh@163.com
|
|
Issue Date: 21 July 2021
|
|
|
| [1] |
陈一祥, 秦昆, 胡忠文, 等. 一种高分影像建筑区分块表示与合并提取方法[J]. 武汉大学学报(信息科学版), 2019, 44(6):908-916.
|
| [1] |
Chen Y X, Qin K, Hu Z W, et al. Built-up extraction based on patch representation and for high-resolution satellite images[J]. Geomatics and Information Science of Wuhan University, 2019, 44(6):908-916.
|
| [2] |
Silvoster M L, Govindan V K. Enhanced CNN based electron microscopy image segmentation[J]. Cybernetics & Information Technologies, 2013, 12(2):84-97.
|
| [3] |
Dong S G, Qin J X, Guo Y K. Shadow detection method for high-resolution remote sensing images supported by generalized stereoscopic image pair[J]. Jouenal of Electronic Measurement and Instrumentation. 2019, 33(3):105-111.
|
| [4] |
Vupparaboina K K, Dansingani K K, Goud A, et al. Quantitative shadow compensated optical coherence tomography of choroidal vasculature[J]. Scientific Reports, 2018, 8(1):6461.
doi: 10.1038/s41598-018-24577-8
pmid: 29691426
|
| [5] |
Jinxiang S, Xuan J I. Cloud and cloud shadow multi-feature collaborative detection from remote sensing image[J]. Journal of Geo-Information Science, 2016, 18(5):599-605.
|
| [6] |
Dare P M. Shadow analysis in high-resolution satellite imagery of urban area[J]. Photogrammetric Engineering & Remote Sensing, 2005, 71(2):169-177.
|
| [7] |
Otsu N. A threshold selection technique from grey-level histograms[J]. IEEE Transaction Systems & Man and Cybernetics, 2007, 9(1):62-66.
|
| [8] |
Etemadnia H, Alsharif M R. Automatic image shadow identification using LPF in homomorphic processing system[C]// Proceedings of VII Digital Image Computing: Techniques and Applications,Sydney:Committee of DICTA, 2003:429-438.
|
| [9] |
Tsai V J D. A comparative study on shadow compensation of color aerial images in invariant color models[J]. IEEE Transactions on Geoscience and Remote Sensing, 2006, 44(6):1661-1671.
doi: 10.1109/TGRS.2006.869980
url: http://ieeexplore.ieee.org/document/1634729/
|
| [10] |
Arévalo V, González J, Ambrosio G. Shadow detection in colour high-resolution satellite images[J]. International Journal of Remote Sensing, 2008, 29(7):1945-1963.
doi: 10.1080/01431160701395302
url: https://www.tandfonline.com/doi/full/10.1080/01431160701395302
|
| [11] |
Martel-Brisson N, André Z. Learning and removing cast shadow through a multidistribution approach[J]. IEEE Transactions on Pattern Analysis and Machine Intelligence, 2007, 29(7):1133-1146.
pmid: 17496373
|
| [12] |
夏怀英, 郭平. 基于统计混合模型的遥感影像阴影检测[J]. 遥感学报, 2011, 15(4):778-791.
|
| [12] |
Xia H Y, Guo P. A shadow detection of remote sensing images based on statistical texture features[J]. Journal of Remote Sensing. 2011, 15(4):778-791.
|
| [13] |
王玥, 王树根. 高分辨率遥感影像阴影检测与补偿的主成分分析方法[J]. 应用科学学报, 2006, 31(8):663.
|
| [13] |
Wang Y, Wang S G. Detection and compensation of shadow in high resolution remote sensing images using PCA[J]. Journal of Applied Sciences, 2006, 31(8):663.
|
| [14] |
许章华, 刘健, 余坤勇, 等. 阴影植被指数SVI的构建及其在四种遥感影像中的应用效果[J]. 光谱学与光谱分析, 2013, 33(12):3359-3365.
|
| [14] |
Xu Z H, Liu J, Yu K Y, et al. Construction of vegetation shadow index (SVI) and application effects in four remote sensing images[J]. Spectroscopy and Spectral Analysis, 2013, 33(12):3359-3365.
|
| [15] |
许章华, 林璐, 王前锋, 等. 归一化阴影植被指数NSVI的构建及其应用效果[J]. 红外与毫米波学报, 2018, 37(2):154-162.
|
| [15] |
Xu Z H, Lin L, Wang Q F, et al. Construction and application effects of normalized shaded vegetation index(NSVI)[J]. Infrared Millim Waves, 2018, 37(2):154-162.
|
| [16] |
陈云浩, 王思佳, 赵逸飞, 等. 农业高光谱遥感研究进展及发展趋势[J]. 地理信息科学, 2019, 35(5):1-8.
|
| [16] |
Chen Y H, Wang S J, Zhao Y F, et al. Progress and development trend of agricultural hyperspectral remote sensing research[J]. Geography and Geo-Information Science, 2019, 35(5):1-8.
|
| [17] |
张淳民, 穆廷魁, 穆廷昱, 等. 高光谱遥感技术发展与展望[J]. 航天返回与遥感, 2018, 39(3):104-114.
|
| [17] |
Zhang C M, Mu T K, Yan T Y, et al. Overview of hyperspectral remote sensing technology[J]. Spacecraft Recoverry and Remote Sensing, 2018, 39(3):104-114.
|
| [18] |
Siciliano D, Wasson K, Potts D C. Evaluating hyperspectral imaging of wetland vegetation as a tool for detecting estuarine nutrient enrichment[J]. Remote Sensing of Enviroment, 2008, 112(11):4020-4033.
doi: 10.1016/j.rse.2008.05.019
url: https://linkinghub.elsevier.com/retrieve/pii/S0034425708002010
|
| [19] |
Adam E, Mutanga O, Rugege D. Multispectral and hyperspectral remote sensing for identification and mapping of wetland vegetation:A review[J]. Wetlands Ecology and Management, 2010, 18(3):281-296.
doi: 10.1007/s11273-009-9169-z
url: http://link.springer.com/10.1007/s11273-009-9169-z
|
| [20] |
Andrews M, Roper T. Shadow modelling and correction techniques in hyperspectral imaging[J]. Electronics Letters, 2013, 49(7):458-460.
doi: 10.1049/ell2.v49.7
url: https://onlinelibrary.wiley.com/toc/1350911x/49/7
|
| [21] |
Qiao X, Yuan D, Li H. Urban shadow detection and classification using hyperspectral image[J]. Journal of the Indian Society of Remote Sensing, 2017, 45(6):945-952.
doi: 10.1007/s12524-016-0649-3
url: http://link.springer.com/10.1007/s12524-016-0649-3
|
| [22] |
张红梅, 王大卫, 高杨, 等. 基于OLI数据与决策树法的去山体阴影水体信息提取研究[J]. 测绘工程, 2017, 26(11):45-48.
|
| [22] |
Zhang H M, Wang D W, Gao Y, et al. A study of extraction method of mountain surface water based on OLI data and decision tree method[J]. Engineering of Surveying and Mapping, 2017, 26(11):45-48.
|
| [23] |
Guimbatan R, Baguilat T. Misunderstanding the notion of conservation in the philippine rice terraces-cultural landscapes[J]. International Social Science Journal, 2006, 58:59-67.
doi: 10.1111/issj.2006.58.issue-187
url: http://www.blackwell-synergy.com/toc/issj/58/187
|
| [24] |
曹斌, 谭炳香. 多角度高光谱CHRIS数据特点及预处理研究[J]. 安徽农业科学, 2010, 38(22):12289-12294.
|
| [24] |
Cao B, Tan B X. Characteristics and preprocessing of multi-angle hyperspectral CHRIS data[J]. Journal of Anhui Agricultural Sciences, 2010, 38(22):12289-12294.
|
| [25] |
司绍博, 周真, 杨旭, 等. 紫外-可见光谱法定量检测牛乳中大肠杆菌总数[J]. 分析试验室, 2019, 38(7):782-786.
|
| [25] |
Si S B, Zhou Z, Yang X, et al. Quantitative detection of escherichia coli in milk by UV-VIS spectroscopy[J]. Chinese Journal of Analysis Laboratory, 2019, 38(7):782-786.
|
| [26] |
Soares S, Gomes A A. The successive projections algorithm[J]. Trends in Analytical Chemistry, 2013, 42(42):84-98.
doi: 10.1016/j.trac.2012.09.006
url: https://linkinghub.elsevier.com/retrieve/pii/S0165993612002750
|
| [27] |
刘明博, 唐延林, 李晓利, 等. 水稻叶片氮含量光谱监测中使用连续投影算法的可行性[J]. 红外与激光工程, 2014, 43(3):1265-1271.
|
| [27] |
Liu M B, Tang Y L, Li X L, et al. Feasibility of using successive projection algorithm in spectral monitoring of rice leaves nitrogen contents[J]. Infrared and Engineering, 2014, 43(3):1265-1271.
|
| [28] |
Fu G, Sun W, Li S W, et al. Response of plant growth and biomass accumulation to short-term experimental warming in a highland barley system of the tibet[J]. Journal of Resources and Ecology, 2017, 8(1):42-49.
doi: 10.5814/j.issn.1674-764x.2017.01.006
url: http://www.bioone.org/doi/10.5814/j.issn.1674-764x.2017.01.006
|
| [29] |
徐涵秋. 基于压缩数据维的城市建筑用地遥感信息提取[J]. 中国图象图形学报, 2005, 10(2):223-229.
|
| [29] |
Xu H Q. Remote sensing information extraction of urban built up land based on a data dimension compression technique[J]. Journal of Image and Graphics, 2005, 10(2):223-229.
|
| [30] |
施婷婷, 徐涵秋, 王帅. ZY-3 MUX传感器数据的缨帽变换系数推导[J]. 遥感学报, 2019, 23(3):514-525.
|
| [30] |
Shi T T, Xu H Q, Wang S. Derivation of tasselled cap transformation coefficients for ZY-3 MUX sensor data[J]. Journal of Remote Sensing, 2019, 23(3):514-525.
|
| [31] |
郭仲伟, 吴朝阳, 汪箫悦. 基于卫星遥感数据的森林病虫害监测与评价[J]. 地理研究, 2019, 38(4):831-843.
doi: 10.11821/dlyj020180299
|
| [31] |
Guo Z W, Wu C Y, Wang X Y, et al. Forest insect-disease monitoring and estimation based on satellite remote sensing data[J]. Geographical Research, 2019, 38(4):831-843.
|
| [32] |
李小曼, 王刚, 田杰. TM影像中水体提取方法研究[J]. 西南农业大学学报(自然科学版), 2006, 28(4):580-582.
|
| [32] |
Li X M, Wang G, Tian J. Study of the method of picking-up small water-bodies in Landsat TM remote sense image[J]. Journal of Southwest Agriculture University(Nature Science), 2006, 28(4):580-582.
|
| [33] |
李艳华, 丁建丽, 闫人华. 基于国产GF-1遥感影像的山区细小水体提取方法研究[J]. 资源科学, 2015, 37(2):408-416.
|
| [33] |
Li Y H, Ding J L, Yan R H. Extraction of small river information based on China-made GF-1 remote sense images[J]. Resources Science, 2015, 37(2):408-416.
|
| [34] |
Wang X P, Jing M C, Ju W M. Photochemical reflectance index (PRI) can be used to improve the relationship between gross primary productivity (GPP) and sun-induced chlorophyll fluorescence (SIF)[J]. Remote Sensing of Environment, 2020, 246:111888.
doi: 10.1016/j.rse.2020.111888
url: https://linkinghub.elsevier.com/retrieve/pii/S0034425720302583
|
|
Viewed |
|
|
|
Full text
|
|
|
|
|
Abstract
|
|
|
|
|
Cited |
|
|
|
|
| |
Shared |
|
|
|
|
| |
Discussed |
|
|
|
|
 2021,
Vol. 33
2021,
Vol. 33