|
|
 |
|

|
|
|
Construction of 3D landscape indices based on tilt photogrammetry: A case study of Tianheng Island in Shandong Province |
WANG Jue1,2( ), GUO Zhen1,2(), ZHANG Zhiwei1,2, XU Wenxue1,2, XU Hao2 ), GUO Zhen1,2(), ZHANG Zhiwei1,2, XU Wenxue1,2, XU Hao2 |
1. Coastal Science and Marine Policy Center, First Institute of Oceanography, MNR, Qingdao 266061, China
2. College of Geodesy and Geomatics, Shandong University of Science and Technology, Qingdao 266590, China |
|
|
|
|
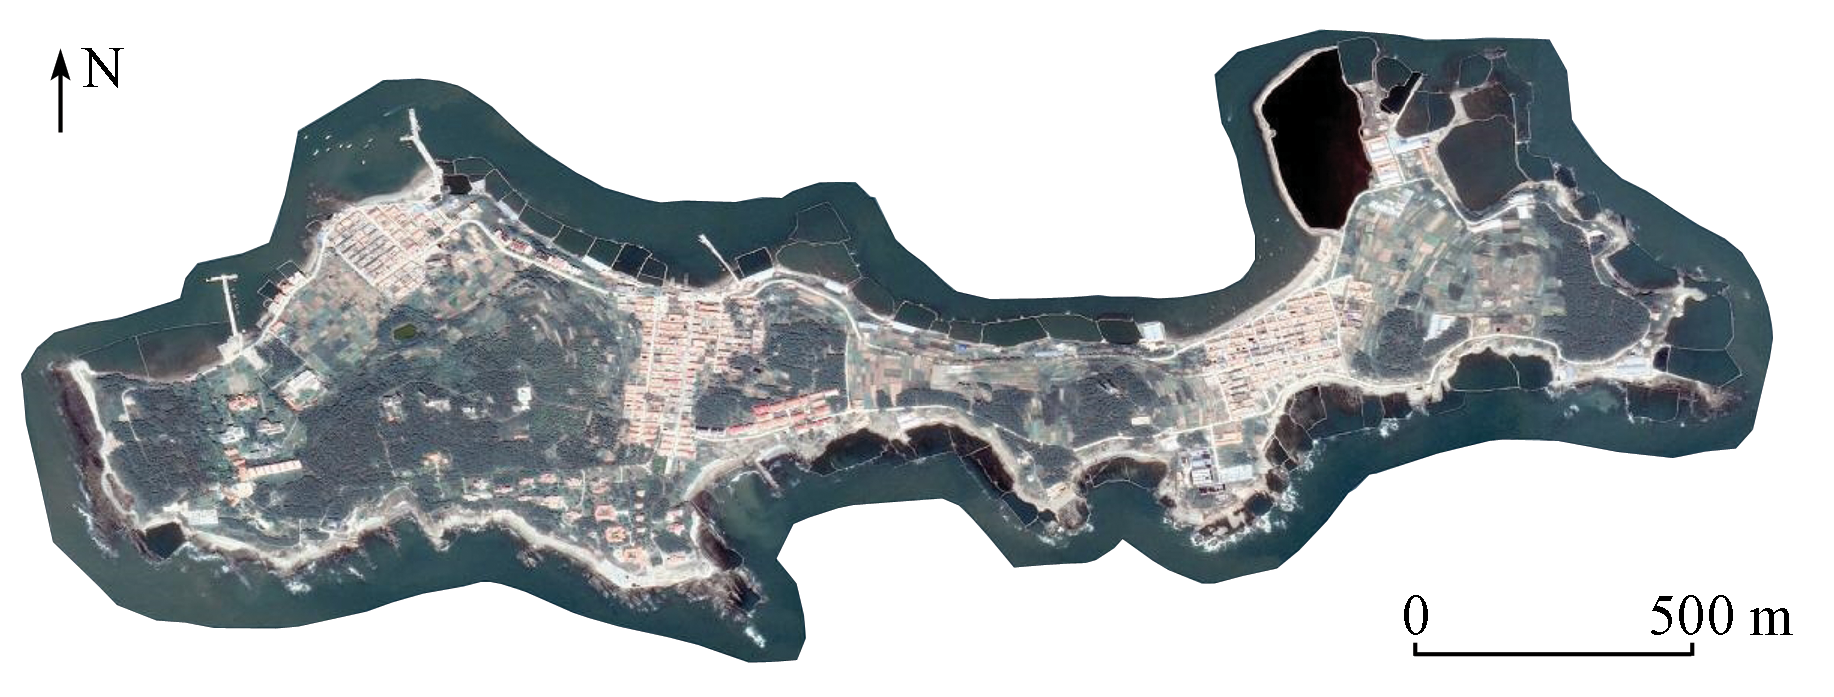
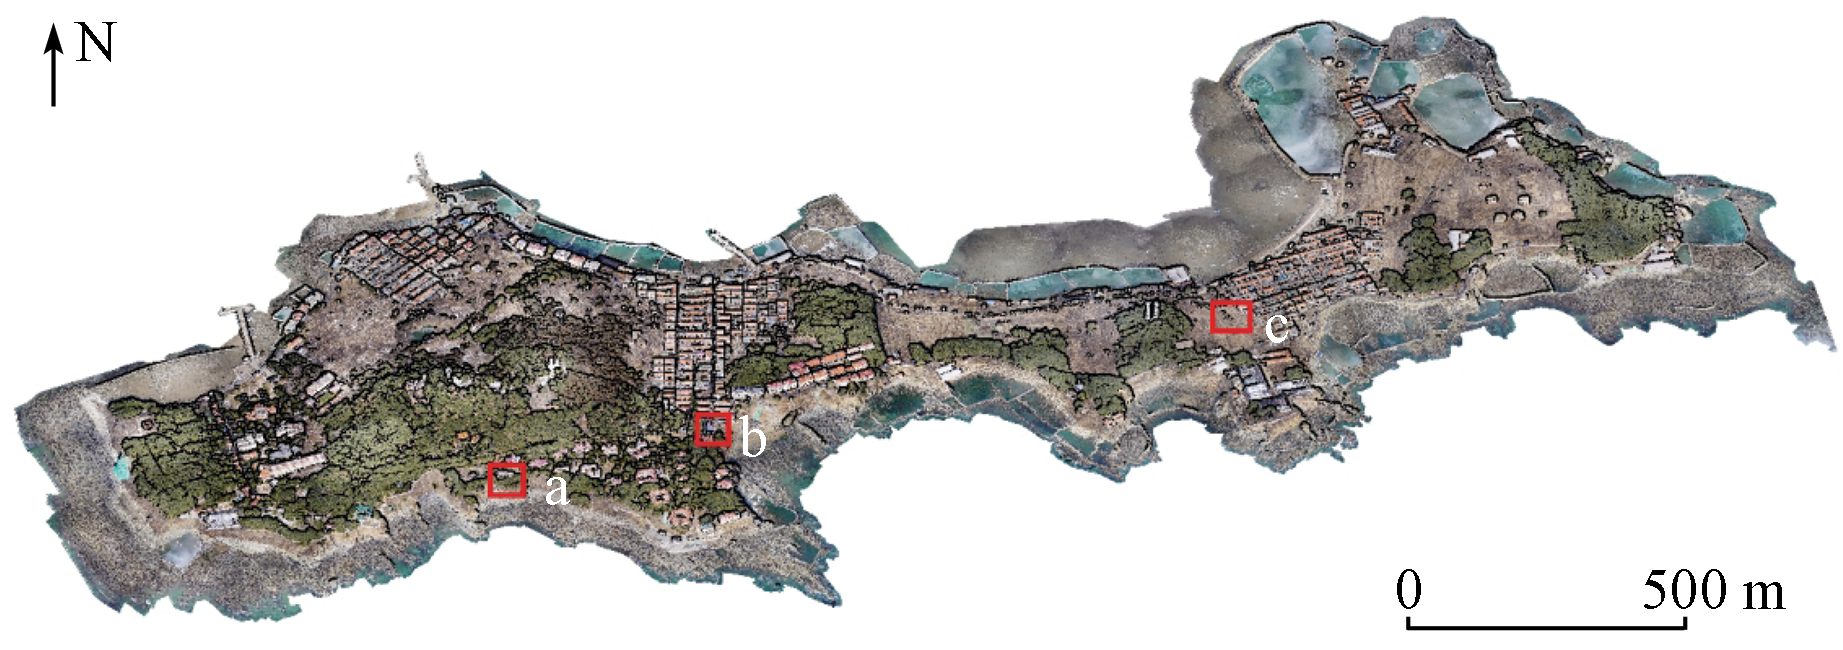
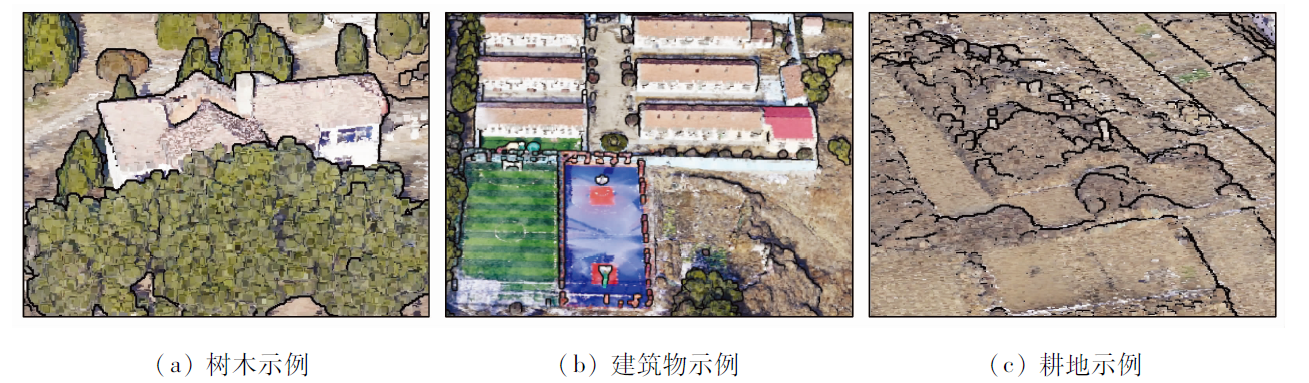
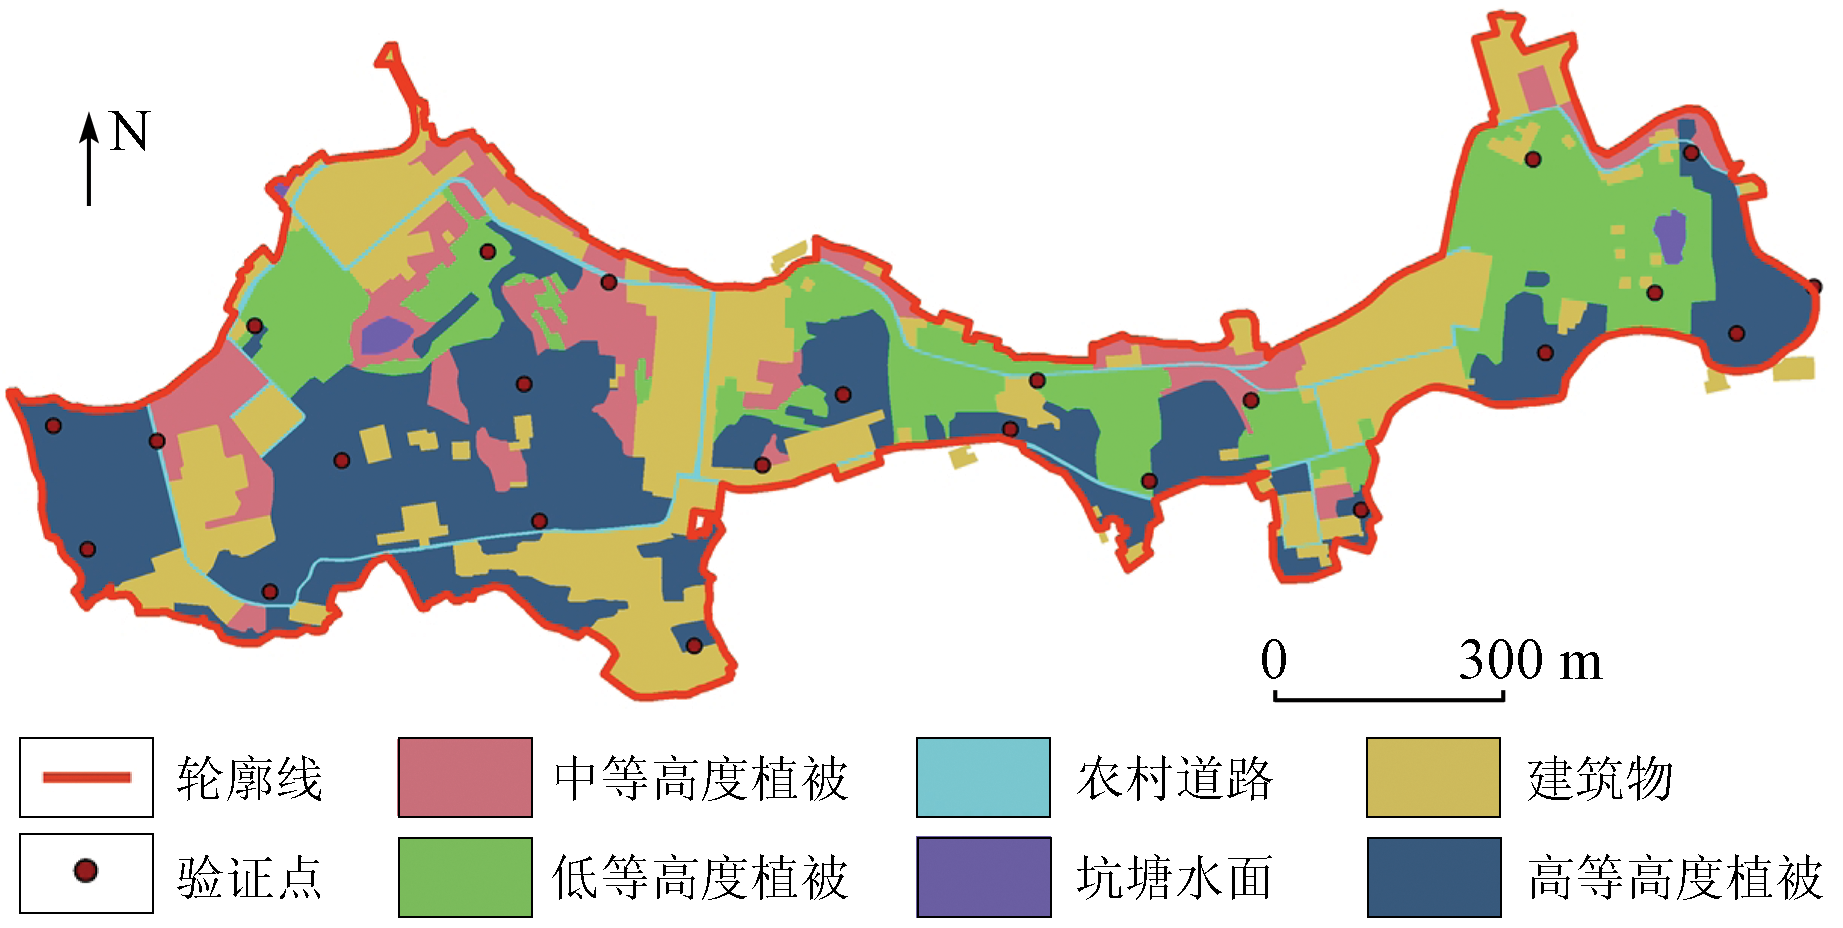
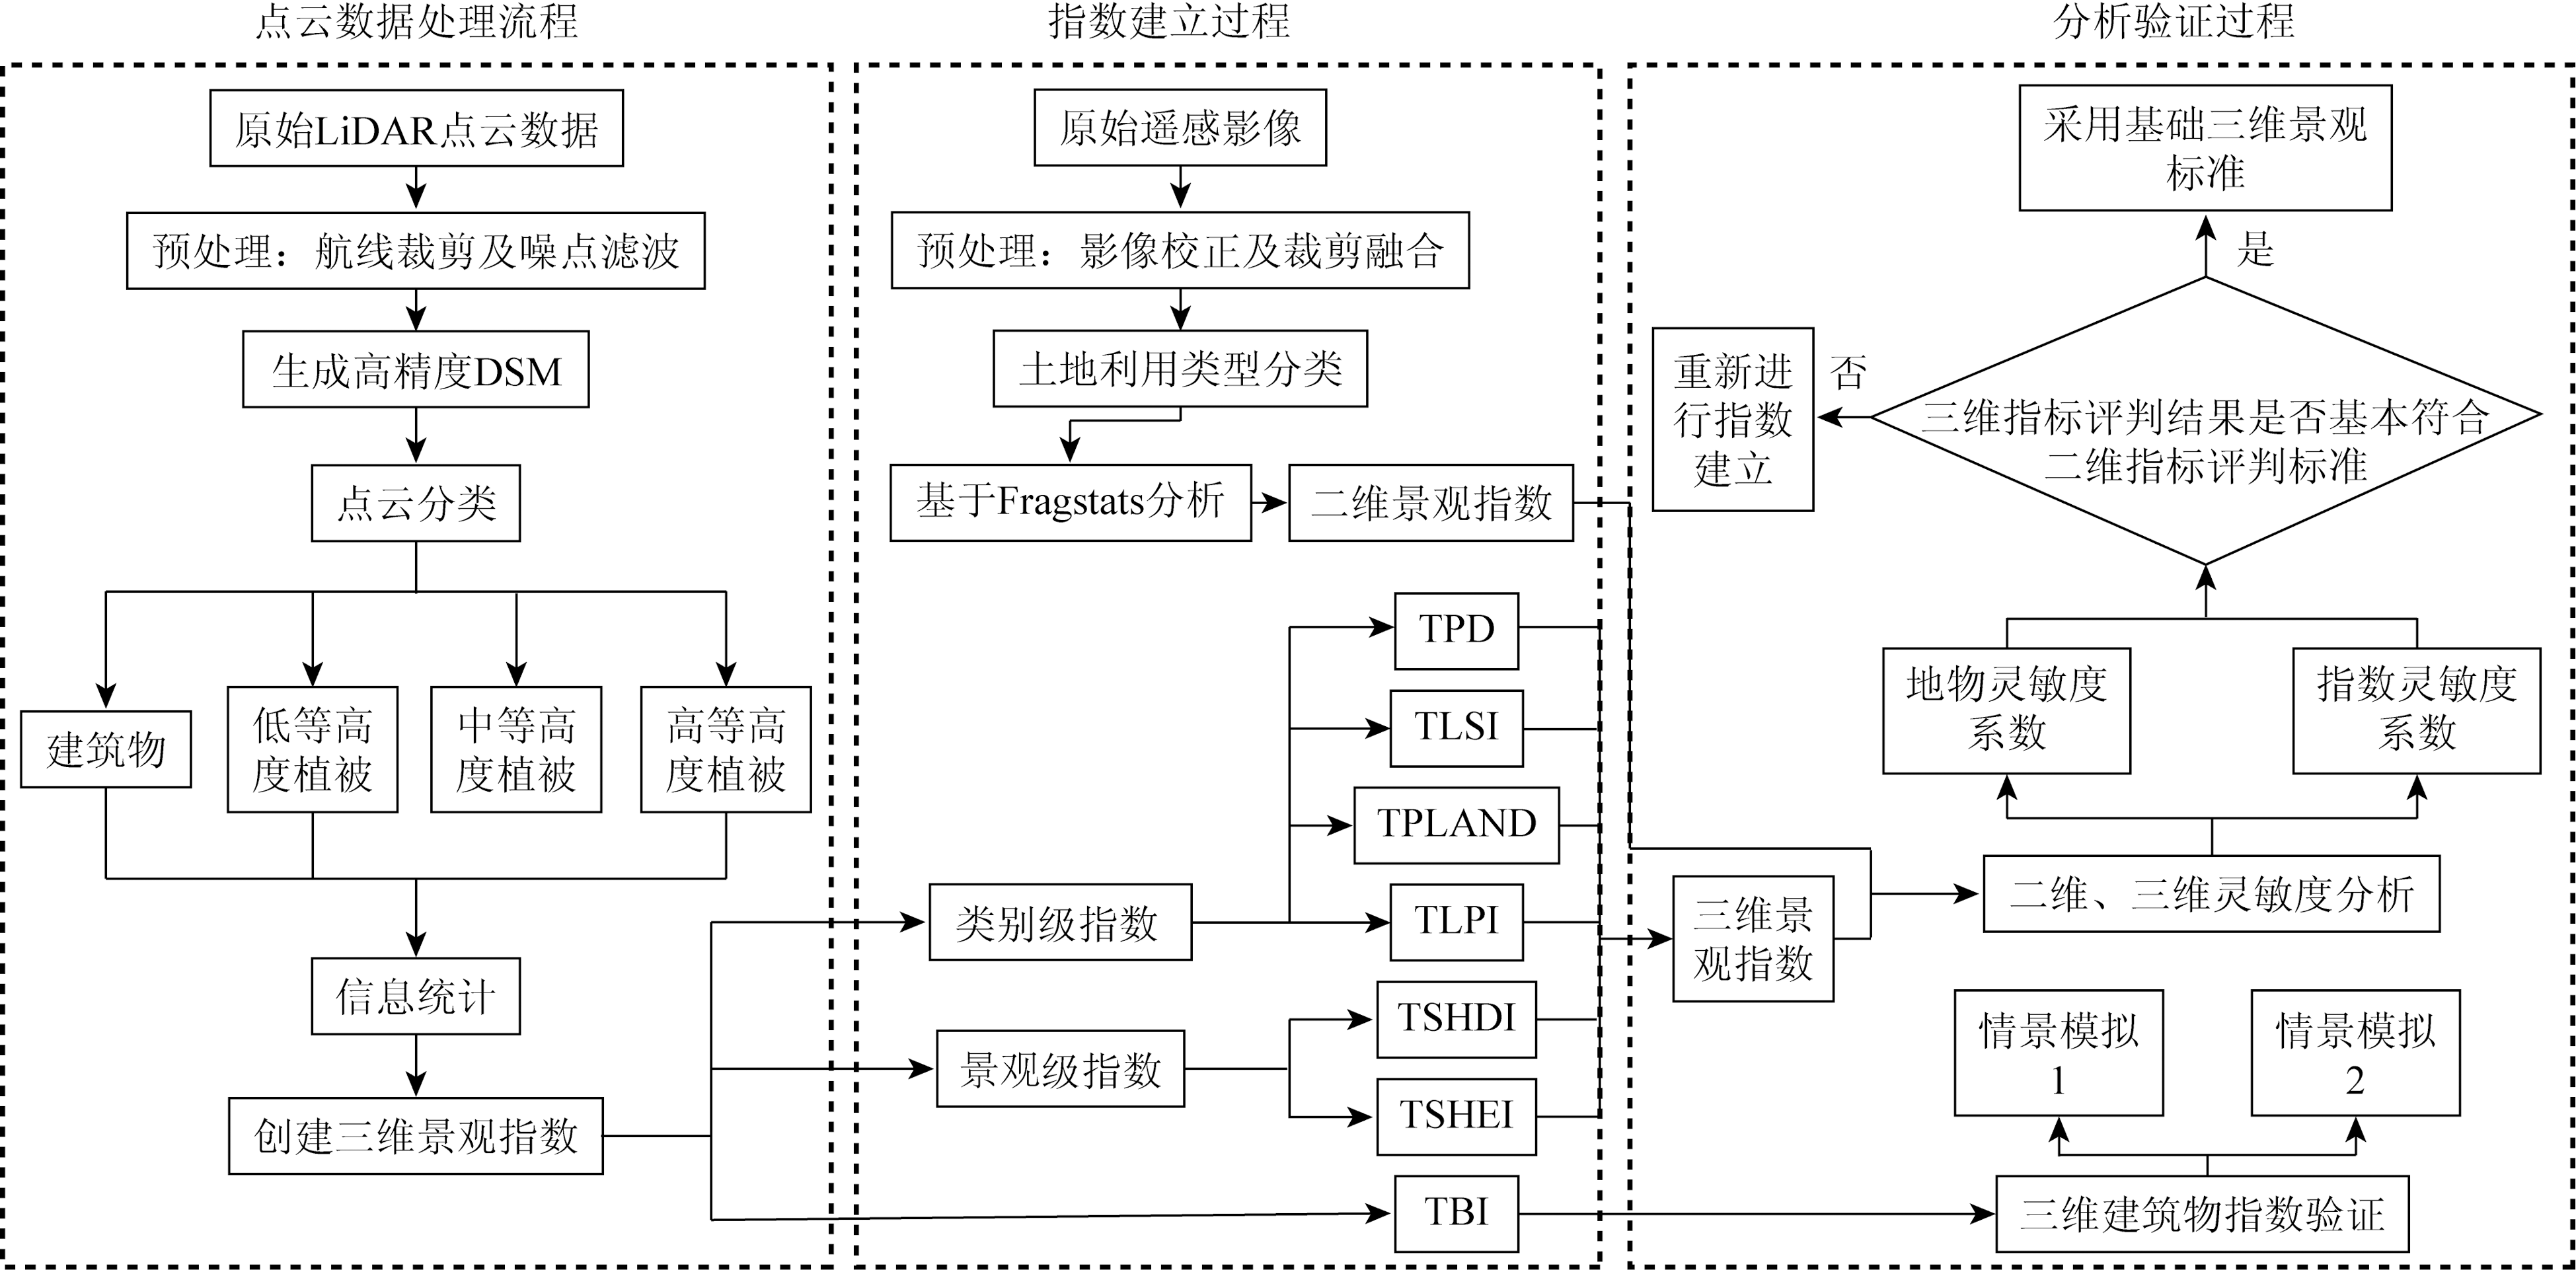
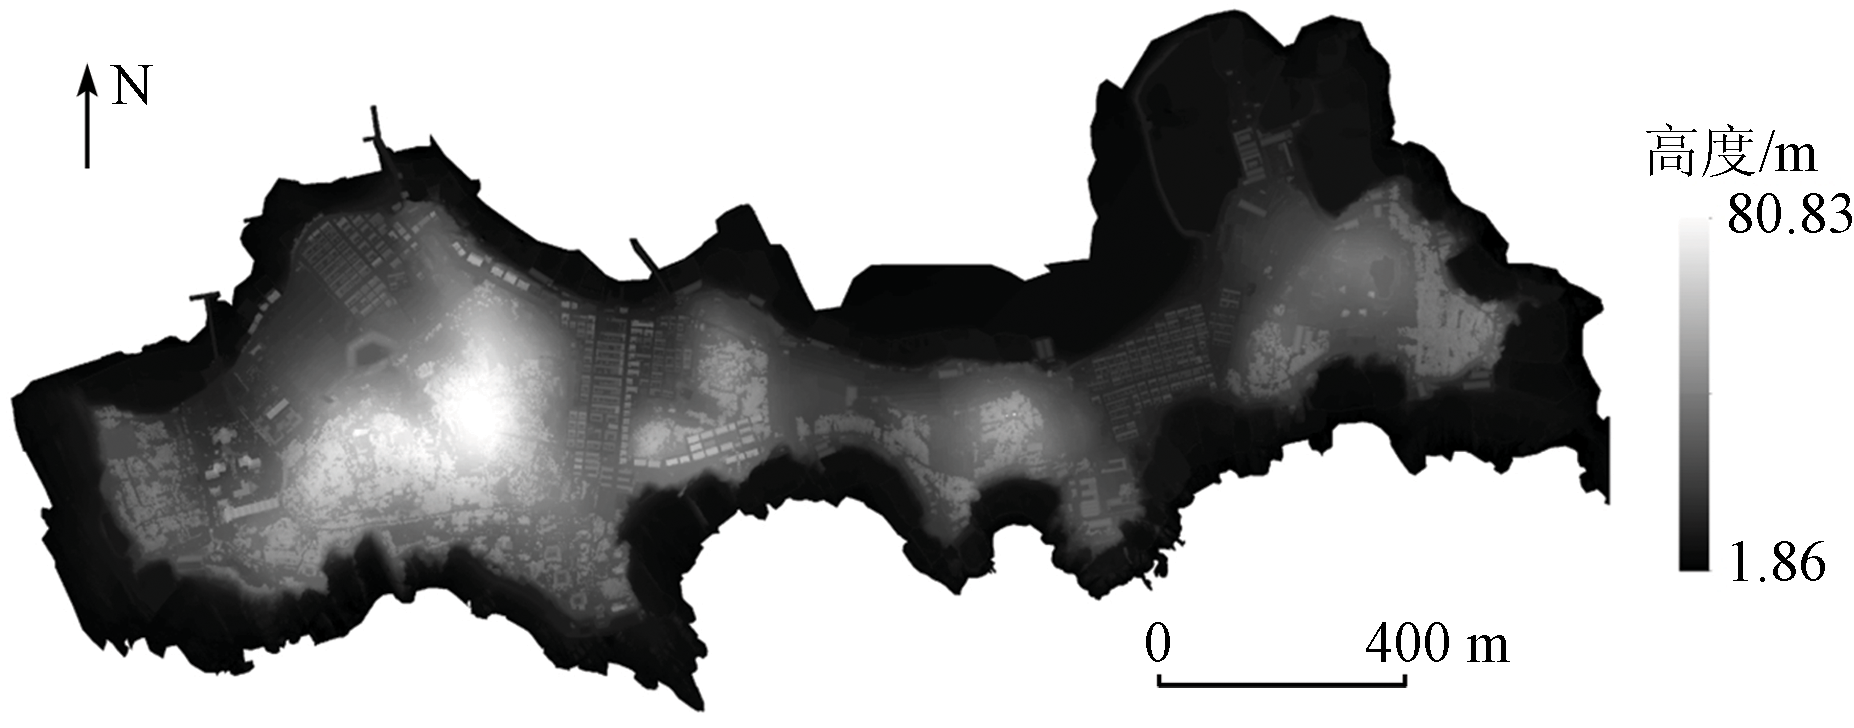
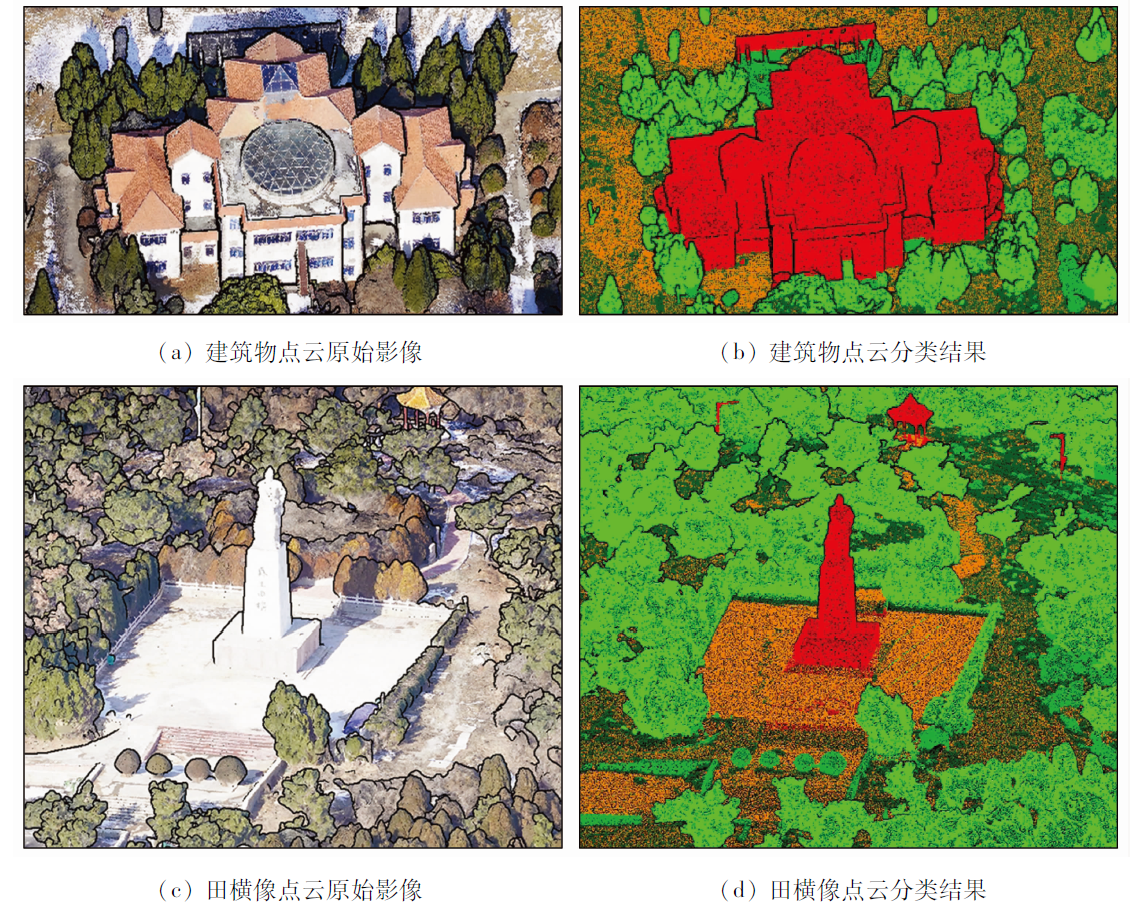
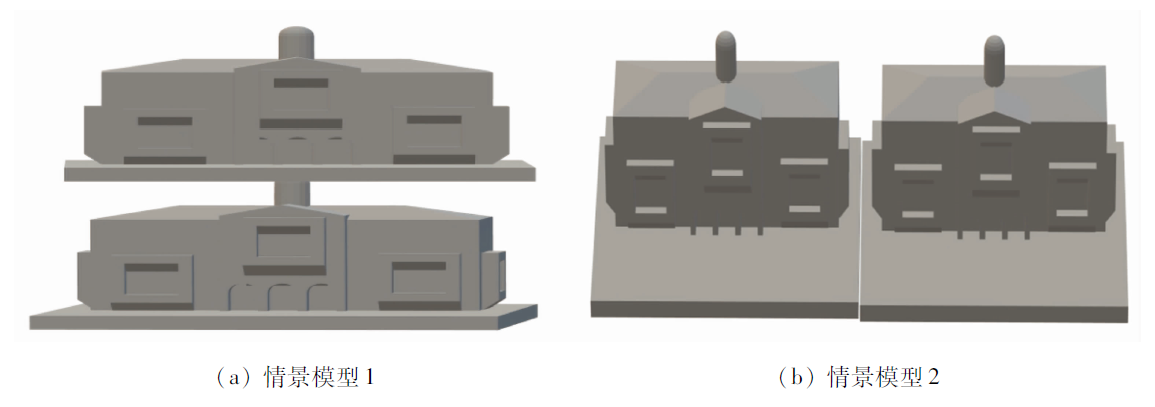
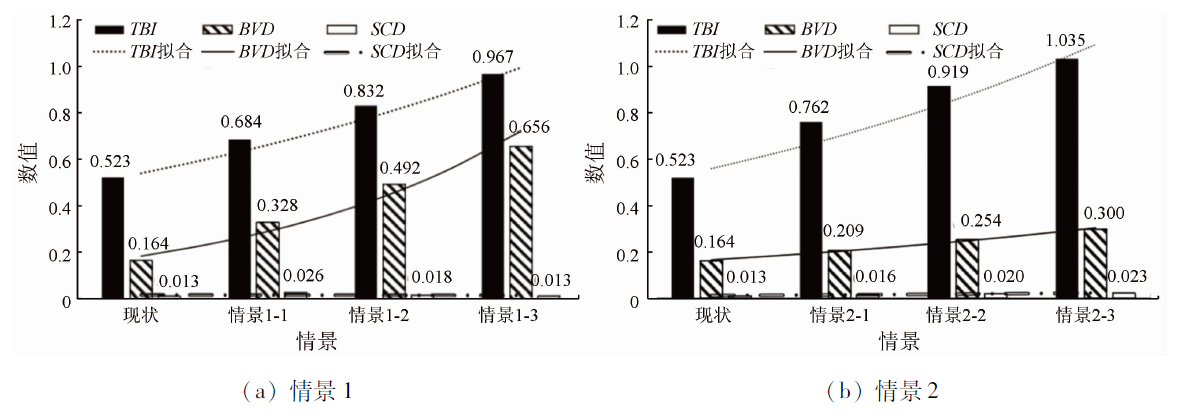
Abstract Landscape indices are quantitative indices used to reflect the composition and spatial configuration of a landscape ecological structure. Current landscape index systems are generally constructed based on the characterization of 2D spatial characteristics, thus their evaluation results fail to accurately reflect the pattern and composition of a real 3D landscape system. Accordingly, there is an urgent need to develop an index system used to describe the 3D landscape characteristics of islands and a whole-process evaluation method. With Tianheng Island in Shandong Province as a case study and based on the point clouds of unmanned aerial vehicle (UAV) tilt photogrammetry, as well as the classification and processing of point clouds using the deep learning method, this study constructed six basic 3D landscape indices covering type and landscape scales to quantitatively describe the 3D landscape features of the island. Moreover, this study established the building landscape indices to evaluate the impacts of the construction activities of human beings on the island ecosystem. The results are as follows: ① As revealed by the analysis of basic 3D landscape indices, the buildings on Tianheng Island are characterized by small 3D volumes and dense spatial distribution. Furthermore, tall vegetation exhibits high isolation, regularity, and spatial aggregation, while low vegetation exhibits high diversity, compactness, and connectivity; ② Due to the difference in dimension, 3D landscape indices contain more spatial information than 2D landscape indices and are greatly affected by terrain undulation; ③ In the case of the same landscape type, the landscape shape index (TLSI) is more sensitive to the change in height (sensitivity index: 7.480). In the case of the same landscape index, the building type changes more greatly than vegetation with irregular spatial characteristics (sensitivity index: 5.861) and is influenced by the design characteristics of buildings; ④ Tianheng Island has a 3D building index (TBI) of 0.523, which increases with an increase in the density and complexity of buildings. Compared with building density and spatial congestion indices, TBI can better reflect the influence of artificial structures on the 3D landscape pattern of the island. This study aims to provide methodological support and a case study for the construction of 3D landscape indices based on modern surveying and mapping technology, as well as the planning of 3D spatial landscapes and the development of their management and evaluation system.
|
| Keywords
3D landscape index
tilt photogrammetry
building landscape index
island
3D landscape pattern
|
|
|
|
Issue Date: 07 July 2023
|
|
|
| [1] |
Díaz-Varela E, Roces-Díaz J V, Álvarez-ÁLlvarez P. Detection of landscape heterogeneity at multiple scales: Use of the quadratic entropy index[J]. Landscape and Urban Planning, 2016, 153:149-159.
doi: 10.1016/j.landurbplan.2016.05.004
url: https://linkinghub.elsevier.com/retrieve/pii/S0169204616300627
|
| [2] |
Liu M, Nijhuis S. Mapping landscape spaces:Methods for understanding spatial-visual characteristics in landscape design[J]. Environmental Impact Assessment Review, 2020, 82:106376.
doi: 10.1016/j.eiar.2020.106376
url: https://linkinghub.elsevier.com/retrieve/pii/S0195925519302033
|
| [3] |
Medeiros A, Fernandes C, Gonalves J F, et al. Research trends on integrative landscape assessment using indicators:A systematic review[J]. Ecological Indicators, 2021, 129:107815.
doi: 10.1016/j.ecolind.2021.107815
url: https://linkinghub.elsevier.com/retrieve/pii/S1470160X21004805
|
| [4] |
李鑫, 欧名豪, 马贤磊. 基于景观指数的细碎化对耕地利用效率影响研究——以扬州市里下河区域为例[J]. 自然资源学报, 2011, 26(10):1758-1767.
|
| [4] |
Li X, Ou M H, Ma X L. Analysis on impact of fragmentation based on landscape index to cultivated land use efficiency:A case on Lixiahe District in Yangzhou City[J]. Journal of Natural Resources, 2011, 26(10):1758-1767.
|
| [5] |
陈康林, 龚建周, 刘彦随, 等. 近35 a来广州城市绿色空间及破碎化时空分异[J]. 自然资源学报, 2016, 31(7):1100-1113.
doi: 10.11849/zrzyxb.20150869
|
| [5] |
Chen K L, Gong J Z, Liu Y S, et al. The spatial-temporal differentiation of green space and its fragmentation during the past thirty-five years in Guangzhou[J]. Journal of Natural Resources, 2016, 31(7):1100-1113.
|
| [6] |
Chen J K, Zhen W F, Jin S G, et al. Separate and combined impacts of building and tree on urban thermal environment from two-and three-dimensional perspectives[J]. Building and Environment, 2021, 194:107650.
doi: 10.1016/j.buildenv.2021.107650
url: https://linkinghub.elsevier.com/retrieve/pii/S0360132321000615
|
| [7] |
张秦瑞, 赵良军, 林国军, 等. 改进遥感生态指数的宜宾市三江汇合区生态环境评价[J]. 自然资源遥感, 2022, 34(1):230-237.doi:10.6046/zrzyyg.2021058.
doi: 10.6046/zrzyyg.2021058
|
| [7] |
Zhang Q R, Zhao L J, Lin G J, et al. Ecological environment assessment of three-river confluence in Yibin City using improved remote sensing ecological index[J]. Remote Sensing for Natural Resources, 2022, 34(1):230-237.doi:10.6046/zrzyyg.2021058.
doi: 10.6046/zrzyyg.2021058
|
| [8] |
Gao S, Sun H, Zhao L, et al. Dynamic assessment of island ecological environment sustainability under urbanization based on rough set,synthetic index and catastrophe progression analysis theories[J]. Ocean and Coastal Management, 2019, 178:104790.
doi: 10.1016/j.ocecoaman.2019.04.017
url: https://linkinghub.elsevier.com/retrieve/pii/S0964569118301625
|
| [9] |
Xie Z, Li X, Jiang D, et al. Threshold of island anthropogenic disturbance based on ecological vulnerability assessment:A case study of Zhujiajian Island[J]. Ocean and Coastal Management, 2019, 167:127-136.
doi: 10.1016/j.ocecoaman.2018.10.014
url: https://linkinghub.elsevier.com/retrieve/pii/S0964569118304812
|
| [10] |
池源, 石洪华, 孙景宽, 等. 城镇化背景下海岛资源环境承载力评估[J]. 自然资源学报, 2017, 32(8):1374-1384.
doi: 10.11849/zrzyxb.20160753
|
| [10] |
Chi Y, Shi H H, Sun J K, et al. Evaluation on island resources and environment carrying capacity under the background of urbanization[J]. Journal of Natural Resources, 2017, 32(8):1374-1384.
doi: 10.11849/zrzyxb.20160753
|
| [11] |
田义超, 黄鹄, 张强, 等. 基于蜂巢格网的北部湾典型海岛景观生态风险空间异质性研究[J]. 海洋环境科学, 2021, 40(4):527-534,41.
|
| [11] |
Tian Y C, Huang H, Zhang Q, et al. Spatial heterogeneity of landscape ecological risk of typical islands in Beibu Gulf based on honeycomb grid[J]. Marine Environmental Science, 2021, 40(4):527-534,41.
|
| [12] |
江娜, 陈超, 韩海丰. 海岸带地类统计模型中DEM空间尺度优选方法[J]. 自然资源遥感, 2022, 34(1):34-42.doi:10.6046/zrzyyg.2022005.
doi: 10.6046/zrzyyg.2022005
|
| [12] |
Jiang N, Chen C, Han H F. An optimization method of DEM resolution for land type statistical model of coastal zones[J]. Remote Sensing for Natural Resources, 2022, 34(1):34-42.doi:10.6046/zrzyyg.2022005.
doi: 10.6046/zrzyyg.2022005
|
| [13] |
Mcgarigal K, Compton B W, Plunkett E B, et al. A landscape index of ecological integrity to inform landscape conservation[J]. Landscape Ecology, 2018, 33:1029-1048.
doi: 10.1007/s10980-018-0653-9
|
| [14] |
张志明, 罗亲普, 王文礼, 等. 2D与3D景观指数测定山区植被景观格局变化对比分析[J]. 生态学报, 2010, 30(21):5886-5893.
|
| [14] |
Zhang Z M, Luo Q P, Wang W L, et al. A comparison of 2D and 3D landscape metrics for vegetation patterns change quantification in mountainous areas[J]. Acta Ecologica Sinica, 2010, 30(21):5886-5893.
|
| [15] |
Long X, Yu H, Sun M, et al. Sustainability evaluation based on the three-dimensional ecological footprint and human development index:A case study on the four island regions in China[J]. Journal of Environmental Management, 2020, 265:110509.
doi: 10.1016/j.jenvman.2020.110509
url: https://linkinghub.elsevier.com/retrieve/pii/S0301479720304436
|
| [16] |
Hu Y, Dai Z, Guldmann J M. Modeling the impact of 2D/3D urban indicators on the urban heat island over different seasons:A boosted regression tree approach[J]. Journal of Environmental Management, 2020, 266:110424.
doi: 10.1016/j.jenvman.2020.110424
url: https://linkinghub.elsevier.com/retrieve/pii/S0301479720303583
|
| [17] |
Yu S, Chen Z, Yu B, et al. Exploring the relationship between 2D/3D landscape pattern and land surface temperature based on explainable extreme gradient boosting tree:A case study of Shanghai,China[J]. Science of the Total Environment, 2020, 725:138429.
|
| [18] |
宋仁波, 朱瑜馨, 郭仁杰, 等. 基于多源数据集成的城市建筑物三维建模方法[J]. 自然资源遥感, 2022, 34(1):93-105.doi:10.6046/zrzyyg.2021039.
doi: 10.6046/zrzyyg.2021039
|
| [18] |
Song R B, Zhu Y X, Guo R J, et al. A method for 3D modeling of urban buildings based on multi-source data integration[J]. Remote Sensing for Natural Resources, 2022, 34(1):93-105.doi:10.6046/zrzyyg.2021039.
doi: 10.6046/zrzyyg.2021039
|
| [19] |
Liu Y, Wang Z P, Liu X, et al. Complexity of the relationship between 2D/3D urban morphology and the land surface temperature:A multiscale perspective[J]. Environmental Science and Pollution Research International, 2021, 28(47):66804-66818.
doi: 10.1007/s11356-021-15177-7
pmid: 34240301
|
| [20] |
Xu Y, Liu M, Hu Y, et al. Analysis of three-dimensional space expansion characteristics in old industrial area renewal using GIS and barista:A case study of Tiexi District,Shenyang,China[J]. Sustainability, 2019, 11(7):1860.
doi: 10.3390/su11071860
url: https://www.mdpi.com/2071-1050/11/7/1860
|
| [21] |
孙宏战. 基于体素模型和点云数据的精细三维景观格局分析[D]. 长春: 吉林大学, 2021.
|
| [21] |
Sun H Z. A voxel-based fine-scale 3D landscape pattern analysis using point clouds[D]. Changchun: Jilin University, 2021.
|
| [22] |
宇超群, 刘小宇. 基于TerraSolid的平原地区点云数据滤波方法[J] .测绘与空间地理信息, 2017, 40(6):181-183.
|
| [22] |
Yu C Q, Liu X Y. A filtering point cloud data way on plain region based on TerraSolid[J]. Geomatics and Spatial Information Technology, 2017, 40(6):181-183.
|
| [23] |
魏金龙, 李明阳, 赵邑晨, 等. 基于稀疏型机载激光雷达数据的风景林参数估测[J]. 西北林学院学报, 2021, 36(2):164-171.
|
| [23] |
Wei J L, Li M Y, Zhao Y C, et al. Estimation of the parameters of scenic forests using sparse airborne LiDAR data[J]. Journal of Northwest Forestry University, 2021, 36(2):164-171.
|
| [24] |
闫钧华, 苏恺, 苏荣华, 等. 基于地物信息的高光谱遥感图像分类方法[J]. 宇航计测技术, 2021, 41(4):38-44.
|
| [24] |
Yan J H, Su K, Su R H, et al. Classification method of hyperspectral remote sensing image based on feature information[J]. Journal of Astronautic Metrology and Measurement, 2021, 41(4):38-44.
|
| [25] |
吴未, 范诗薇, 许丽萍, 等. 无锡市景观指数的粒度效应研究[J]. 自然资源学报, 2016, 31(3):413-424.
|
| [25] |
Wu W, Fan S W, Xu L P, et al. Grain size effect of landscape metrics in Wuxi City[J]. Journal of Natural Resources, 2016, 31(3):413-424.
doi: 10.11849/zrzyxb.20150303
|
| [26] |
鲁冬冬, 邹进贵. 多分类器组合的LiDAR点云分类[J/OL]. 测绘地理信息:1-7[2022-04-20].https://doi.org/10.14188/j.2095-6045.2020445.
url: https://doi.org/10.14188/j.2095-6045.2020445
|
| [26] |
Lu D D, Zou J G. Multi-classifier combined method for LiDAR point cloud classification[J/OL]. Journal of Geomatics:1-7[2022-04-20].https://doi.org/10.14188/j.2095-6045.2020445.
url: https://doi.org/10.14188/j.2095-6045.2020445
|
| [27] |
鄢文苗, 任东, 黄应平, 等. 基于SVM土壤重金属污染评价的训练数据集构建[J]. 武汉大学学报(理学版), 2019, 65(3):316-322.
|
| [27] |
Yan W M, Ren D, Huang Y P, et al. Training dataset construction for SVM soil heavy metal pollution assessment[J]. Journal of Wuhan University (Natural Science Edition), 2019, 65(3):316-322.
|
| [28] |
陈雪莹, 高雪娇, 许嘉巍, 等. 长白山风灾景观30年格局变化过程分析[J]. 生态学报, 2022, 42(4):1327-1339.
|
| [28] |
Chen X Y, Gao X J, Xu J W, et al. Analysis of the pattern change process of Changbai Mountain wind-damaged landscape in the past thirty years[J]. Acta Ecologica Sinica, 2022, 42(4):1327-1339.
|
| [29] |
Pérez G, Escolà A, Rosell-Polo J R, et al. 3D characterization of a Boston Ivy double-skin green building facade using a LiDAR system[J]. Building and Environment, 2021, 206:108320.
doi: 10.1016/j.buildenv.2021.108320
url: https://linkinghub.elsevier.com/retrieve/pii/S0360132321007186
|
| [30] |
Chen Z, Xu B, Devereux B. Urban landscape pattern analysis based on 3D landscape models[J]. Applied Geography, 2014, 55:82-91.
doi: 10.1016/j.apgeog.2014.09.006
url: https://linkinghub.elsevier.com/retrieve/pii/S0143622814002070
|
| [31] |
Bonczak B, Kontokosta C E. Large-scale parameterization of 3D building morphology in complex urban landscapes using aerial LiDAR and city administrative data[J]. Computers,Environment and Urban Systems, 2019, 73:126-142.
doi: 10.1016/j.compenvurbsys.2018.09.004
url: https://linkinghub.elsevier.com/retrieve/pii/S0198971518300176
|
|
Viewed |
|
|
|
Full text
|
|
|
|
|
Abstract
|
|
|
|
|
Cited |
|
|
|
|
| |
Shared |
|
|
|
|
| |
Discussed |
|
|
|
|
 2023,
Vol. 35
2023,
Vol. 35