|
|
 |
|

|
|
|
Remote sensing analysis of temporal-spatial variations of urban heat island effect over Beijing |
Min YANG1,2,3, Guijun YANG2,3,4( ), Yanjie WANG2,3,4, Yongfeng ZHANG5, Zhihong ZHANG6, Chenhong SUN7 ), Yanjie WANG2,3,4, Yongfeng ZHANG5, Zhihong ZHANG6, Chenhong SUN7 |
1. Shaanxi Earthquake Agency, Xi’an 710068, China;
2. National Engineering Research Center for Information Technology in Agriculture, Beijing 100097, China
3. Key Laboratory of Agri-informatics, Ministry of Agriculture, Beijing 100097, China
4. Beijing Engineering Research Center of Agricultural Internet of Things, Beijing 100097, China
5. Xi’an Zhongtianweidi Surveying & Mapping Technology Co.,Ltd., Xi’an 710054, China;
6. College of Geomatics, Xi’an University of Science and Technology, Xi’an 710054, China;
7. Xi’an Aerospace Tian Painted Data Technology Co., Ltd., Xi’an 710054, China; |
|
|
|
|
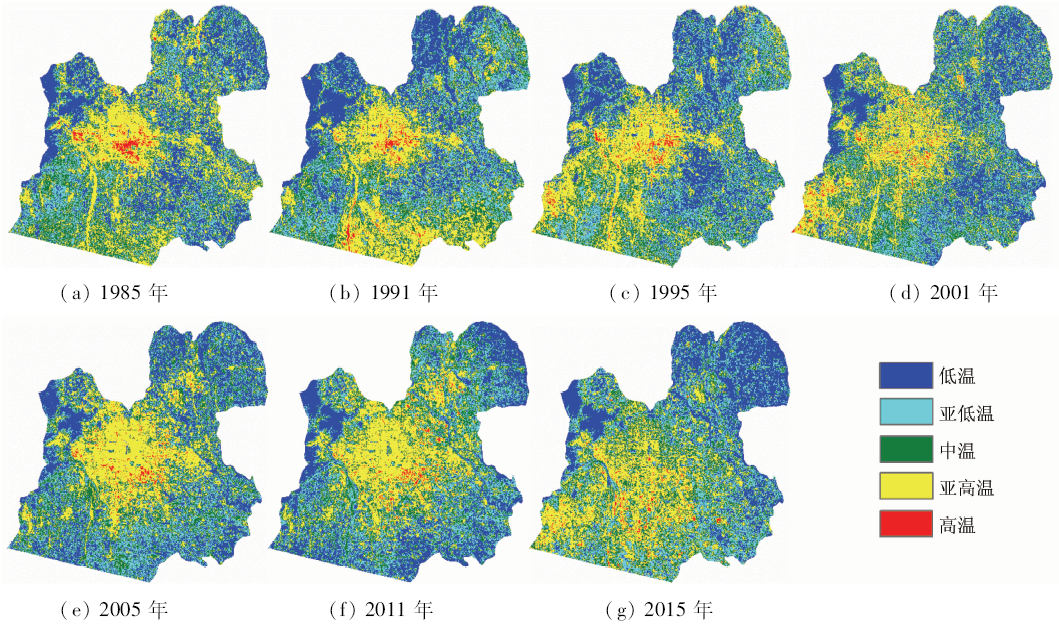
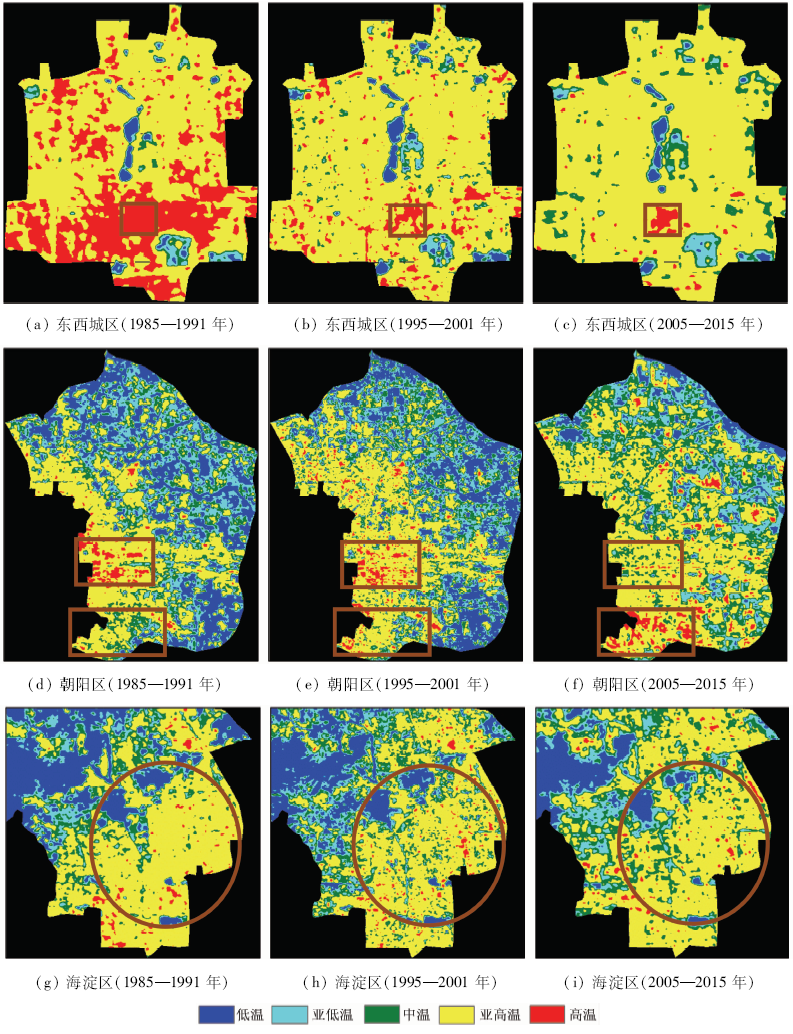
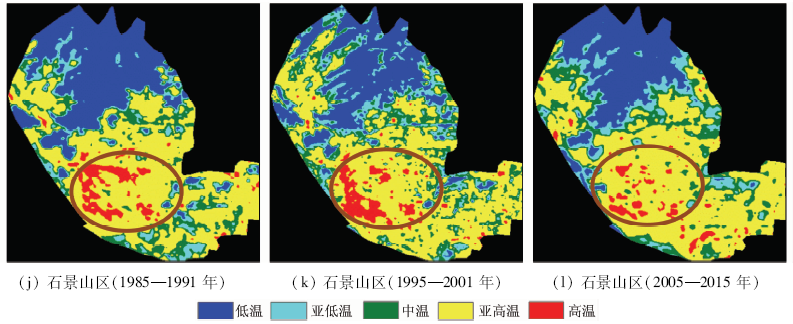
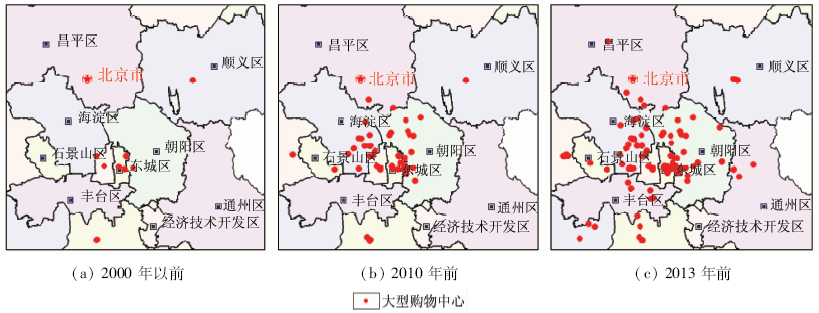
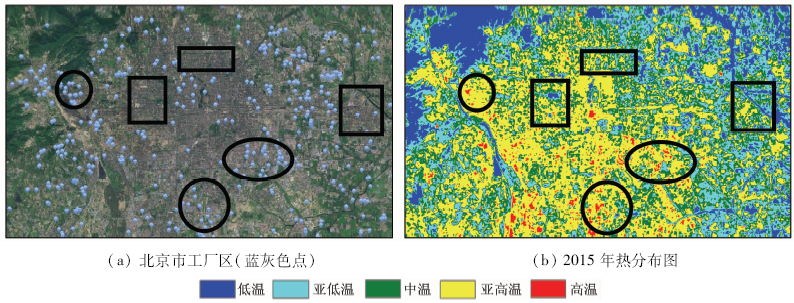
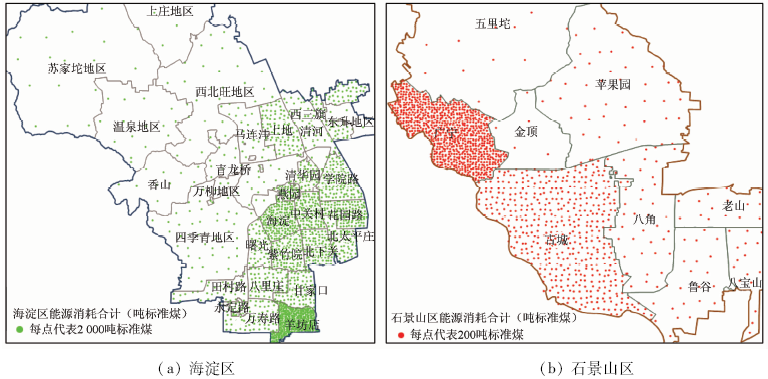
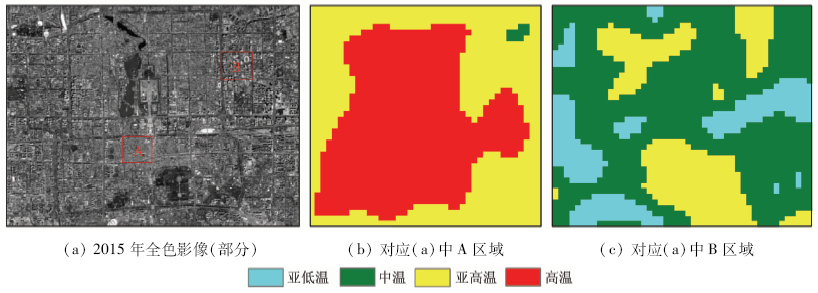
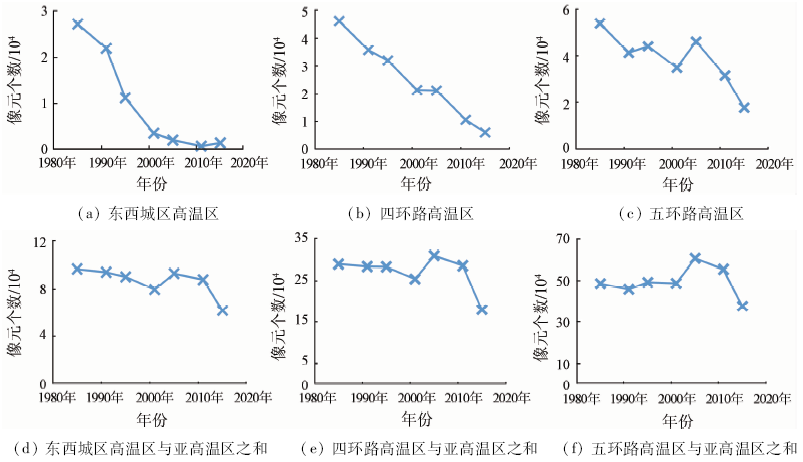
Abstract In order to study the temporal-spatial variation of the urban heat island effect over Beijing since 1985, the authors utilized the 7 phases of Landsat TM/ETM+/TIRS images in summer to perform retrieval of the land surface brightness temperature so as to replace the true land surface temperature(LST). And the LST data were used for a series of qualitative and quantitative analysis of urban heat island effect to reveal Beijing heat distribution and the characteristics of urban heat island effect. Some conclusions have been reached: ① The high-temperature regions and sub-high temperature regions are continuously centralized to the urban area, but the high-temperature regions in Dongcheng District and Xicheng District show a significant downward trend, and the large scale of heat island is replaced by the small heat islands;② The influence of industrial estate on the urban heat island effect in Beijing is much higher than that of the residential district in Beijing;③ The temperature of the areas with low-rise and dense buildings and low vegetation coverage are much higher than the temperature of the areas with tall and sparse buildings and high vegetation coverage. The results of the study would play an important role in urban planning in that they provide the reference frame for the government departments to reduce the impact of urban heat island effect based on rational planning of the distribution of water, green land,industrial estate and residential areas.
|
| Keywords
land surface brightness temperature
land surface temperature(LST)
urban heat island
spatial distribution
temporal and spatial variation
Beijing
|
|
|
|
Corresponding Authors:
Guijun YANG
E-mail: yanggj@nercita.org.cn
|
|
Issue Date: 10 September 2018
|
|
|
| [1] |
马晓河, 胡拥军 . 中国城镇化进程、面临问题及其总体布局[J].改革, 2010(10):30-45.
|
| [1] |
Ma X H, Hu Y J . The process,problems and general layout of urbanization in China[J].Reform, 2010(10):30-45.
|
| [2] |
王骏飞 . 西(安)咸(阳)新区城市地表温度遥感反演及其变化研究[D]. 重庆:西南大学, 2015.
|
| [2] |
Wang J F . Research of Xixian New Area Land Surface Temperature Retrieval and Its Changes Based on Remote Sensing Images[D]. Chongqing:Southwest University, 2015.
|
| [3] |
Li X M, Zhou W Q, Ouyang Z Y . Relationship between land surface temperature and spatial pattern of greenspace:What are the effects of spatial resolution?[J]. Landscape and Urban Planning, 2013,114:1-8.
doi: 10.1016/j.landurbplan.2013.02.005
url: http://linkinghub.elsevier.com/retrieve/pii/S0169204613000261
|
| [4] |
刘宇峰, 原志华, 孔伟 , 等. 1993—2012年西安城区城市热岛效应强度变化趋势及影响因素分析[J]. 自然资源学报, 2015,30(6):974-985.
|
| [4] |
Liu Y F, Yuan Z H, Kong W , et al. The changing trend of heat island intensity and main influencing factors during 1993─2012 in Xi’an City[J]. Journal of Natural Resources, 2015,30(6):974-985.
|
| [5] |
Yuan F, Bauer M E . Comparison of impervious surface area and normalized difference vegetation index as indicators of surface urban heat island effects in Landsat imagery[J]. Remote Sensing of Environment, 2007,106(3):375-386.
doi: 10.1016/j.rse.2006.09.003
url: http://linkinghub.elsevier.com/retrieve/pii/S0034425706003191
|
| [6] |
宋艳玲, 董文杰, 张尚印 , 等. 北京市城、郊气候要素对比研究[J]. 干旱气象, 2003,21(3):63-68.
|
| [6] |
Song Y L, Dong W J, Zhang S Y , et al. Study on characteristics of climate elements in Beijing[J] Arid Meteorology, 2003,21(3):63-68.
|
| [7] |
董妍, 李星敏, 杨艳超 , 等. 西安城市热岛的时空分布特征[J]. 干旱区资源与环境, 2011,25(8):107-112.
url: http://d.wanfangdata.com.cn/Periodical/ghqzyyhj201108019
|
| [7] |
Dong Y, Li X M, Yang Y C , et al. Distributive characters of urban heat island effect in Xi’an City[J]. Journal of Arid Land Resources and Environment, 2011,25(8):107-112.
|
| [8] |
Giannaros T M, Melas D, Daglis I A , et al. Numerical study of the urban heat island over Athens (Greece) with the WRF model[J]. Atmospheric Environment, 2013,73:103-111.
doi: 10.1016/j.atmosenv.2013.02.055
url: http://linkinghub.elsevier.com/retrieve/pii/S1352231013001726
|
| [9] |
Nichol J E, Hang T P . Temporal characteristics of thermal satellite images for urban heat stress and heat island mapping[J]. ISPRS Journal of Photogrammetry and Remote Sensing, 2012,74:153-162.
doi: 10.1016/j.isprsjprs.2012.09.007
url: http://linkinghub.elsevier.com/retrieve/pii/S0924271612001761
|
| [10] |
王艳慧, 肖瑶 . 北京市1989—2010年地表温度时空分异特征分析[J]. 国土资源遥感, 2014,26(3):146-152.doi: 10.6046/gtzyyg.2014.03.24.
doi: 10.6046/gtzyyg.2014.03.24
|
| [10] |
Wang Y H, Xiao Y . A temporal-spatial variation analysis of land surface temperature in Beijing[J]. Remote Sensing for Land and Resources, 2014,26(3):146-152.doi: 10.6046/gtzyyg.2014.03.24.
|
| [11] |
纪瑞鹏, 张喜民, 李刚 . 沈阳等6城市热岛效应卫星监测研究[J].辽宁气象, 2000(4):22-23.
|
| [11] |
Ji R P, Zhang X M, Li G . Study on satellite monitoring of urban heat island effect in 6 cities[J].Liaoning Meteorology, 2000(4):22-23.
|
| [12] |
Flores R J L, Filho A J P, Karam H A . Estimation of long term low resolution surface urban heat island intensities for tropical cities using MODIS remote sensing data[J]. Urban Climate, 2016,17:32-66.
doi: 10.1016/j.uclim.2016.04.002
url: http://linkinghub.elsevier.com/retrieve/pii/S2212095516300220
|
| [13] |
王亚维, 宋小宁, 唐伯惠 , 等. 基于FY-2C数据的地表温度反演验证——以黄河源区玛曲为例[J]. 国土资源遥感, 2015,27(4):68-72.doi: 10.6046/gtzyyg.2015.04.11.
doi: 10.6046/gtzyyg.2015.04.11
url: http://d.wanfangdata.com.cn/Periodical/gtzyyg201504011
|
| [13] |
Wang Y W, Song X N, Tang B H , et al. Validation of FY-2C derived land surface temperature over the source region of the Yellow River:A case study of Maqu County[J]. Remote Sensing for Land and Resources, 2015,27(4):68-72.doi: 10.6046/gtzyyg.2015.04.11.
|
| [14] |
Bokaie M, Zarkesh M K, Arasteh P D , et al. Assessment of urban heat island based on the relationship between land surface temperature and land use/ land cover in Tehran[J]. Sustainable Cities and Society, 2016,23:94-104.
doi: 10.1016/j.scs.2016.03.009
url: http://linkinghub.elsevier.com/retrieve/pii/S2210670716300403
|
| [15] |
宋彩英, 覃志豪, 王斐 . 基于Landsat TM的地表温度分解算法对比[J]. 国土资源遥感, 2015,27(1):172-177.doi: 10.6046/gtzyyg.2015.01.27.
doi: 10.6046/gtzyyg.2015.01.27
|
| [15] |
Song C Y, Qin Z H, Wang F . Comparison of two models for decomposition of land surface temperature image using Landsat TM data[J]. Remote Sensing for Land and Resources, 2015,27(1):172-177.doi: 10.6046/gtzyyg.2015.01.27.
|
| [16] |
李昕瑜, 杜培军, 阿里木·赛买提 .南京市地表参数变化与热岛效应时空分析[J]. 国土资源遥感, 2014,26(2):177-183.doi: 10.6046/gtzyyg.2014.02.28.
doi: 10.6046/gtzyyg.2014.02.28
|
| [16] |
Li X Y, Du P J, Alim S . Spatial-temporal analysis of urban heat island effect and surface parameters variation in Nanjing City[J]. Remote Sensing for Land and Resources, 2014,26(2):177-183.doi: 10.6046/gtzyyg.2014.02.28.
|
| [17] |
Gallo K P, Mcnab A L, Karl T R , et al. The use of NOAA AVHRR data for assessment of the urban heat island effect[J]. Journal of Applied Meteorology, 1993,32(5):899-908.
doi: 10.1175/1520-0450(1993)032<0899:TUONAD>2.0.CO;2
url: http://journals.ametsoc.org/doi/abs/10.1175/1520-0450%281993%29032%3C0899%3ATUONAD%3E2.0.CO%3B2
|
| [18] |
Chen W, Zhang Y, Gao W J , et al. The investigation of urbanization and urban heat island in Beijing based on remote sensing[J]. Procedia-Social and Behavioral Sciences, 2016,216:141-150.
doi: 10.1016/j.sbspro.2015.12.019
url: http://linkinghub.elsevier.com/retrieve/pii/S1877042815061996
|
| [19] |
Mathew A, Khandelwal S, Kaul N . Spatial and temporal variations of urban heat island effect and the effect of percentage impervious surface area and elevation on land surface temperature:Study of Chandigarh City,India[J]. Sustainable Cities and Society, 2016,26:264-277.
doi: 10.1016/j.scs.2016.06.018
url: http://linkinghub.elsevier.com/retrieve/pii/S2210670716301287
|
| [20] |
Shen H F, Huang L W, Zhang L P , et al. Long-term and fine-scale satellite monitoring of the urban heat island effect by the fusion of multi-temporal and multi-sensor remote sensed data:A 26-year case study of the city of Wuhan in China[J]. Remote Sensing of Environment, 2016,172:109-125.
doi: 10.1016/j.rse.2015.11.005
url: http://linkinghub.elsevier.com/retrieve/pii/S0034425715301930
|
| [21] |
许飞, 张雪红, 李栋 , 等. “白屋顶计划”对缓解城市热岛效应的有效性评价[J]. 国土资源遥感, 2014,26(1):90-96.doi: 10.6046/gtzyyg.2014.01.16.
doi: 10.6046/gtzyyg.2014.01.16
|
| [21] |
Xu F, Zhang X H, Li D , et al. Evaluation of the “white roof plan” for alleviating heat island effect[J]. Remote Sensing for Land and Resources, 2014,26(1):90-96.doi: 10.6046/gtzyyg.2014.01.16.
|
| [22] |
Xu L Y, Xie X D, Li S . Correlation analysis of the urban heat island effect and the spatial and temporal distribution of atmospheric particulates using TM images in Beijing[J]. Environmental Pollution, 2013,178:102-114.
doi: 10.1016/j.envpol.2013.03.006
url: http://linkinghub.elsevier.com/retrieve/pii/S026974911300122X
|
| [23] |
Peng J, Xie P, Liu Y X , et al. Urban thermal environment dynamics and associated landscape pattern factors:A case study in the Beijing metropolitan region[J]. Remote Sensing of Environment, 2016,173:145-155.
doi: 10.1016/j.rse.2015.11.027
url: http://linkinghub.elsevier.com/retrieve/pii/S0034425715302145
|
| [24] |
Wang J, Huang B, Fu D J , et al. Response of urban heat island to future urban expansion over the Beijing-Tianjin-Hebei metropolitan area[J]. Applied Geography, 2016,70:26-36.
doi: 10.1016/j.apgeog.2016.02.010
url: http://linkinghub.elsevier.com/retrieve/pii/S014362281630011X
|
| [25] |
杨可明, 周玉洁, 齐建伟 , 等. 城市不透水面及地表温度的遥感估算[J]. 国土资源遥感, 2014,26(2):134-139.doi: 10.6046/gtzyyg.2014.02.22.
doi: 10.6046/gtzyyg.2014.02.22
url: http://d.wanfangdata.com.cn/Periodical/gtzyyg201402023
|
| [25] |
Yang K M, Zhou Y J, Qi J W , et al. Remote sensing estimating of urban impervious surface area and land surface temperature[J]. Remote Sensing for Land and Resources, 2014,26(2):134-139.doi: 10.6046/gtzyyg.2014.02.22.
|
| [26] |
北京市统计局.人口[EB/OL].( 2015- 11- 09)[2016-12-09]. .
url: http://www.bjstats.gov.cn/tjsj/cysj/201511/t20151109_311727.html
|
| [27] |
NASA.Landsat 7 Science Data Users Handbook[EB/OL].( 2016 -08)[2016-12-09].
url: https://landsat.gsfc.nasa.gov/wp-content/uploads/2016/08/Landsat7_Handbook.pdf.
|
| [28] |
北京市第三次全国经济普查数据可视化系统:主题研究[EB/OL].[ 2016- 12- 09]. .
url: http://gis.bjhgk.gov.cn
|
| [29] |
鞠鹏艳 . 转型期的石景山区规划[J].北京规划建设, 2007(2):133-138.
doi: 10.3969/j.issn.1003-627X.2007.02.036
url: http://d.wanfangdata.com.cn/Periodical_bjghjs200702036.aspx
|
| [29] |
Ju P Y . Planning of Shijingshan District in transitional[J].Beijing Planning Review, 2007(2):133-138.
|
|
Viewed |
|
|
|
Full text
|
|
|
|
|
Abstract
|
|
|
|
|
Cited |
|
|
|
|
| |
Shared |
|
|
|
|
| |
Discussed |
|
|
|
|
 2018,
Vol. 30
2018,
Vol. 30