A comparative study on the changes in heat island effect in Chinese and foreign megacities
WANG Meiya1(), XU Hanqiu2()
1. School of History and Geography, Minnan Normal University, Zhangzhou 363000, China 2. College of Environment and Resources, Institute of Remote Sensing Information Engineering, Fujian Provincial Key Laboratory of Remote Sensing of Soil Erosion and Disaster Prevention, Fuzhou University, Fuzhou 350116, China
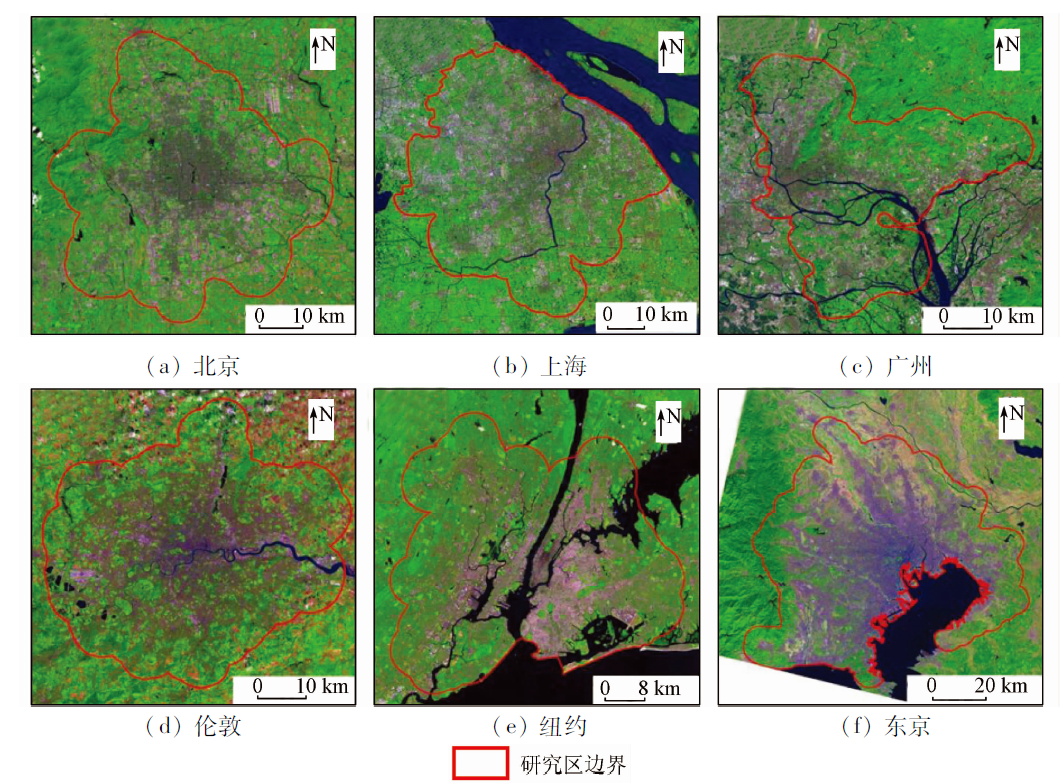
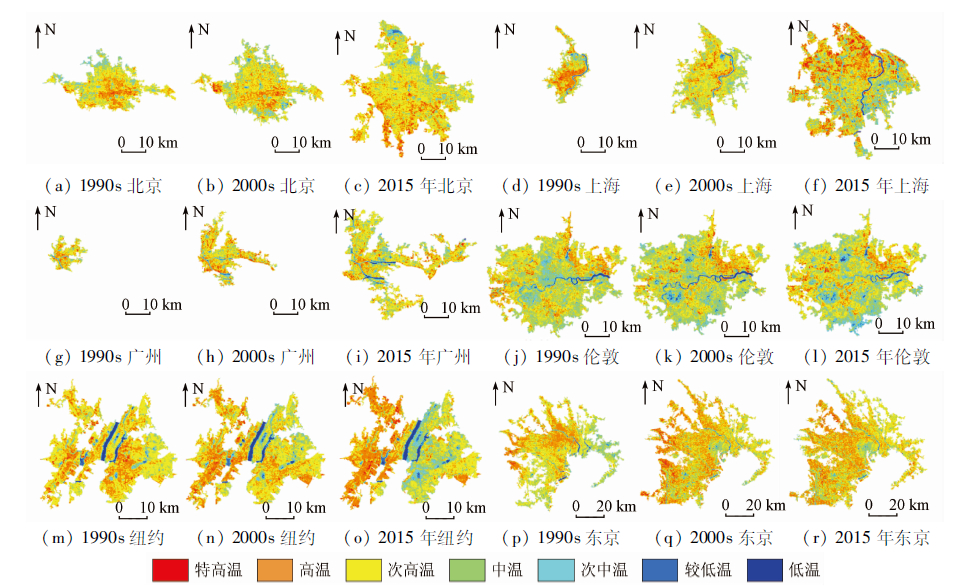
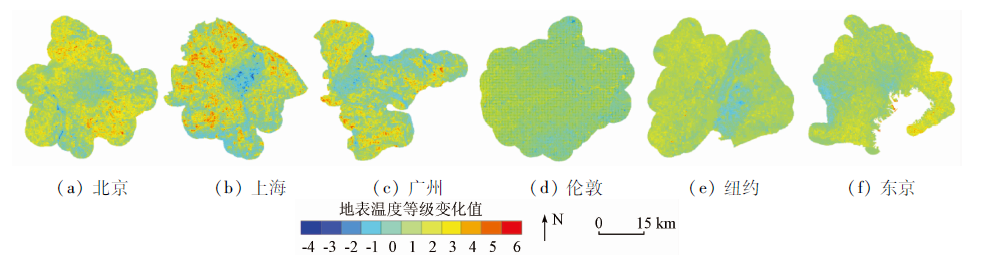
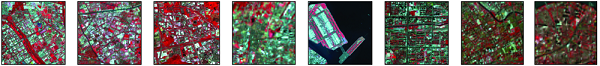
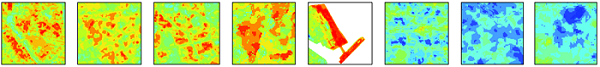
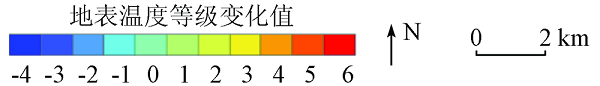
快速城市化形成超大城市导致地表覆盖快速变化,改变地表热平衡,使得城市热环境剧烈变化。以1990s,2000s和2015年这3个时期为研究时相,选取中外6个典型超大城市(北京、上海、广州、伦敦、纽约和东京)为研究对象,多时相Landsat遥感影像为主要数据源,进行城市热环境变化对比及成因分析。利用普适性单通道算法反演各城市地表温度,计算城市热岛比例指数(urban heat island ratio index,URI)来定量对比研究期间各城市热岛效应时空变化。城市热岛效应对比研究结果表明,1990s—2015年间,北京、上海和东京的URI呈总体上升趋势,广州、伦敦和纽约的URI呈总体下降趋势。到2015年,东京城市热岛效应最严重(URI=0.630),其次是北京、上海、纽约和广州,分别为0.617,0.594,0.555和0.530,伦敦的URI指数最小为0.433。整个研究期间,北京、上海、广州和东京等超大城市均有较大幅度扩张,建成区面积均增加500 km2以上,不透水面面积增加370 km2以上,不断向外蔓延并占用生态用地,加上城市组团间无法形成良好的绿化分隔带,造成城市地表温度等级大幅上升,尤其是新城区热岛效应增强显著; 而在老城区通过旧城改造,热环境得到显著改善。伦敦和纽约城市无明显扩张,地表温度变化幅度较小。在今后城市建设中,需注重生态理念,优化城市地表空间格局,提高生态用地效益。
Megacities have formed due to rapid urbanization. As a result, the surface cover has rapidly changed, which changes the heat balance of Earth's surface and induces drastic changes in the thermal environment in megacities. With six typical megacities (Beijing, Shanghai, Guangzhou, London, New York, and Tokyo) across the world as study objects and multi-temporal Landsat remote-sensing images of the 1990s, the 2000s, and 2015 as the main data sources, this study compares the changes in the thermal environment among the six megacities and analyzes their causes. For each of the megacities, the surface temperature was determined through reversion using the universal single-channel algorithm and the urban heat island ratio index (URI) was calculated to quantitatively compare the spatial-temporal changes in the heat island effect during the study period. The results are as follows. From the 1990s to 2015, the URI values of Beijing, Shanghai, and Tokyo showed an overall upward trend, and while that of Guangzhou, London, and New York showed an overall downward trend. In 2015, Tokyo suffered the most serious urban heat island effect (URI=0.630), followed by Beijing, Shanghai, New York, and Guangzhou successively, of which the URI values were 0.617, 0.594, 0.555, and 0.530, respectively. In contrast, London had the smallest URI of 0.433. The megacities such as Beijing, Shanghai, Guangzhou, and Tokyo all considerably expanded throughout the study period. In these cities, the built-up areas and impervious surfaces increased by more than 500 km2 and more than 370 km2 on average, respectively in terms of area. They continuously spread outwards and occupied ecological land. Furthermore, green belts can not be formed between urban clusters. All these caused a significant increase in urban surface temperature and especially the significant aggravation of the heat island effect in new urban areas. In comparison, the thermal environment in the old urban areas was significantly improved through urban reconstruction. London and New York were not significantly expanded, where the surface temperature slightly changed. Therefore, it is necessary to pay attention to ecological philosophy, optimize the pattern of urban surface space, and improve the efficiency of ecological land in future urban construction.
王美雅, 徐涵秋. 中外超大城市热岛效应变化对比研究[J]. 自然资源遥感, 2021, 33(4): 200-208.
WANG Meiya, XU Hanqiu. A comparative study on the changes in heat island effect in Chinese and foreign megacities. Remote Sensing for Natural Resources, 2021, 33(4): 200-208.
Kuang W H, Yang T R, Liu A L, et al. An EcoCity model for regulating urban land cover structure and thermal environment:Taking Beijing as an example[J]. Science China Earth Sciences, 2017,47(7):847-859.
[2]
Xu H Q, Wang M Y, Shi T T, et al. Prediction of ecological effects of potential population and impervious surface increases using a remote sensing based ecological index(RSEI)[J]. Ecological Indicators, 2018,93:730-740.
doi: 10.1016/j.ecolind.2018.05.055
[3]
Croft-White M V, Cvetkovic M, Rokitnicki-Wojcik D, et al. A shoreline divided:Twelve-year water quality and land cover trends in Lake Ontario coastal wetlands[J]. Journal of Great Lakes Research, 2017,43(6):1005-1015.
doi: 10.1016/j.jglr.2017.08.003
[4]
United Nations. State of the world population 2014-the power of 1.8 billion:Adolescents,youth and the transformation of the future[EB/OL]. https://reliefweb.int/report/world/state-world-population-2014-power-18-billion-adolescents-youth-and-transformation.
[5]
Meng F, Shan B Y, Liu M. Remote-sensing evaluation of the relationship between urban heat islands and urban biophysical descriptors in Jinan,China[J]. Journal of Applied Remote Sensing, 2014,8(1):083693.
doi: 10.1117/1.JRS.8.083693
Ge R F, Wang J L, Zhang L X, et al. Impacts of urbanization on the urban thermal environment in Beijing[J]. Acta Ecologica Sinica, 2016,36(19):6040-6049.
[7]
Feyisa G L, Meilby H, Jenerette G D, et al. Locally optimized separability enhancement indices for urban land cover mapping:Exploring thermal environmental consequences of rapid urbanization in Addis Ababa,Ethiopia[J]. Remote Sensing of Environment, 2016,175:14-31.
doi: 10.1016/j.rse.2015.12.026
[8]
Weng Q H, Lu D S. A sub-pixel analysis of urbanization effect on land surface temperature and its interplay with impervious surface and vegetation coverage in Indianapolis,United States[J]. International Journal of Applied Earth Observation and Geoinformation, 2008,10(1):68-83.
doi: 10.1016/j.jag.2007.05.002
[9]
Zheng B J, Myint S W, Fan C. Spatial configuration of anthropogenic land cover impacts on urban warming[J]. Landscape and Urban Planning, 2014,130:104-111.
doi: 10.1016/j.landurbplan.2014.07.001
[10]
Chen Y J, Yu S X. Impacts of urban landscape patterns on urban thermal variations in Guangzhou,China[J]. International Journal of Applied Earth Observation and Geoinformation, 2017,54:65-71.
doi: 10.1016/j.jag.2016.09.007
[11]
Kotharkar R, Bagade A. Evaluating urban heat island in the critical local climate zones of an Indian city[J]. Landscape and Urban Planning, 2018,169:92-104.
doi: 10.1016/j.landurbplan.2017.08.009
[12]
中国国家统计局. 中国统计年鉴(2015年)[M]. 北京: 中国统计出版社, 2016.
National Bureau of Statistics of China. China statistical yearbook[M]. Beijing: China Statistics Press, 2016.
[13]
United Nations. World population prospects:The 2018 revision[EB/OL]. https://population.un.org/wup/Publications/.
[14]
中国住房和城乡建设部. 中国城市建设统计年鉴2014[M]. 北京: 中国统计出版社, 2015.
Ministry of Housing and Urban-Rural Development of the People's Republic of China. China urban construction statistical yearbook[M]. Beijing: China Statistics Press, 2015.
[15]
Van de Voorde T, Jacquet W, Canters F. Mapping form and function in urban areas:An approach based on urban metrics and continuous impervious surface data[J]. Landscape and Urban Planning, 2011,102(3):143-155.
doi: 10.1016/j.landurbplan.2011.03.017
[16]
Chander G, Markham B L, Helder D L. Summary of current radiometric calibration coefficients for Landsat MSS,TM,ETM+,and EO-1 ALI sensors[J]. Remote Sensing of Environment, 2009,113(5):893-903.
doi: 10.1016/j.rse.2009.01.007
[17]
Charvz Jr P S. Image-based atmospheric corrections-revisited and revised[J]. Photogrammetric Engineering and Remote Sensing, 1996,62(9):1025-1036.
[18]
Jiménez-Muñoz J C, Cristobal J, Sobrino J A, et al. Revision of the single-channel algorithm for land surface temperature retrieval from Landsat thermal-infrared data[J]. IEEE Transactions on Geoscience and Remote Sensing, 2009,47(1):339-349.
doi: 10.1109/TGRS.2008.2007125
[19]
Jiménez-Muñoz J C, Sobrino J A. A generalized single-channel method for retrieving land surface temperature from remote sensing data[J]. Journal of Geophysical Research Atmospheres, 2003,108(D22):4688.
[20]
Jiménez-Muñoz J C, Sobrino J A, Skoković D, et al. Land surface temperature retrieval methods from Landsat8 thermal infrared sensor data[J]. IEEE Geoscience and Remote Sensing Letters, 2014,11(10):1840-1843.
doi: 10.1109/LGRS.2014.2312032
Xu H Q, Chen B Q. An image processing technique for the study of urban heat island changes using different seasonal remote sensing data[J]. Remote Sensing Technology and Application, 2003,18(3):129-133.
[22]
国家环保部. 生态环境状况评价技术规范(发布稿)[S]. 北京: 中国标准出版社, 2015.
Ministry of Ecology and Environment the People's Republic of China. Technical criterion for ecosystem status evaluation[S]. Beijing: Standards Press of China, 2015.
Ministry of Housing and Urban-Rural Development of the People's Republic of China. Guidelines for performance assessment of urban ecological construction[M]. Beijing: China Architecture and Building Press, 2015.
Fan Z Y, Zhan Q M, Liu H M, et al. Spatial-temporal distribution of urban heat island and the heating effect of impervious surface in summer in Wuhan[J]. Journal of Geo-Information Science, 2019,21(2):226-235.
[25]
Breiman L. Random forests[J]. Machine Learning, 2001,45(1):5-32.
doi: 10.1023/A:1010933404324
[26]
Du P J, Samat A, Waske B, et al. Random forest and rotation forest for fully polarized SAR image classification using polarimetric and spatial features[J]. ISPRS Journal of Photogrammetry and Remote Sensing, 2015,105:38-53.
doi: 10.1016/j.isprsjprs.2015.03.002
[27]
Padmanaban R, Bhowmik A K, Cabral P. A remote sensing approach to environmental monitoring in a reclaimed mine area[J]. ISPRS International Journal of Geo-Information, 2017,6(12):401.
doi: 10.3390/ijgi6120401
[28]
Schneider A. Monitoring land cover change in urban and peri-urban areas using dense time stacks of Landsat satellite data and a data mining approach[J]. Remote Sensing of Environment, 2012,124:689-704.
doi: 10.1016/j.rse.2012.06.006
 2021, Vol. 33
  ), 徐涵秋2(