Please wait a minute...
 
国土资源遥感  2021, Vol. 33 Issue (2): 202-212    DOI: 10.6046/gtzyyg.2020183
  技术应用 本期目录 | 过刊浏览 | 高级检索 |
阿拉尔垦区近30年耕地变化及其驱动因子分析
宋奇(), 冯春晖, 高琪, 王明玥, 吴家林, 彭杰()
塔里木大学植物科学学院,阿拉尔 843300
Change of cultivated land and its driving factors in Alar reclamation area in the past thirty years
SONG Qi(), FENG Chunhui, GAO Qi, WANG Mingyue, WU Jialin, PENG Jie()
College of Plant Science, Tarim University, Alar 843300, China
全文: PDF(7094 KB)   HTML  
输出: BibTeX | EndNote (RIS)      
摘要 

耕地动态变化趋势及其驱动因子的明确,是确保国家粮食安全、水土资源合理开发利用和土地利用结构调整的重要依据。以南疆阿拉尔垦区为例,基于1990—2019年间7个重要时期的Landsat卫星遥感影像、人口、国内生产总值(gross domestic product,GDP)等数据,将波谱角 (spectral angle mapper, SAM)、神经网络 (artificial neural net, ANN)、最小距离(minimum distance classification, MDC)、最大似然 (maximum likelihood classification, MLC)和支持向量机 (support vector machine, SVM) 5种分类方法经全连接条件随机场(fully connected conditional random field, FC—CRF)处理后进行对比,从中筛选出最佳算法来解译遥感影像,利用解译结果分析耕地面积变化、类型转化和空间动态变化特征,并探讨耕地面积变化的主要驱动因子、作用路径和强度。结果表明,在5种分类算法中,SVM—CRF算法的分类精度最高,总体精度为0.95,Kappa系数为0.94,其他4类算法的总体精度为0.65~0.89,Kappa系数为0.58~0.86。研究区1990—2019年间耕地面积呈持续增长趋势,耕地面积净增长量为729.97 km2(312.21%),耕地转入和转出分别呈现出向外扩张和向内收缩趋势。总人口、GDP、全社会固定资产投资、农业生产总值和棉花价格是耕地面积变化的5个主要驱动因子,其中GDP对耕地面积变化的直接影响最大,棉花价格的直接影响最小,除GDP对耕地面积表现为负向作用外,其他4个因子对耕地面积变化均表现为正向作用。

服务
把本文推荐给朋友
加入引用管理器
E-mail Alert
RSS
作者相关文章
宋奇
冯春晖
高琪
王明玥
吴家林
彭杰
关键词 耕地变化驱动因子遥感Landsat土地利用/覆被    
Abstract

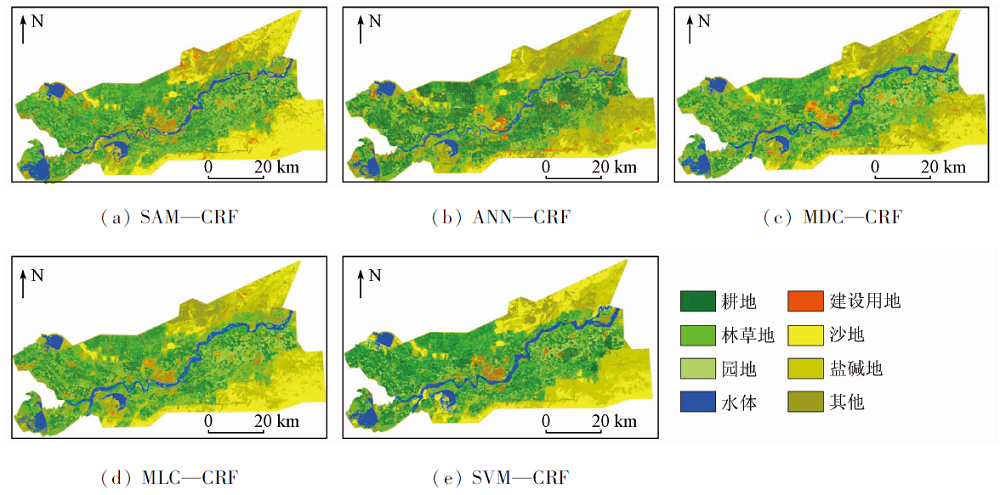
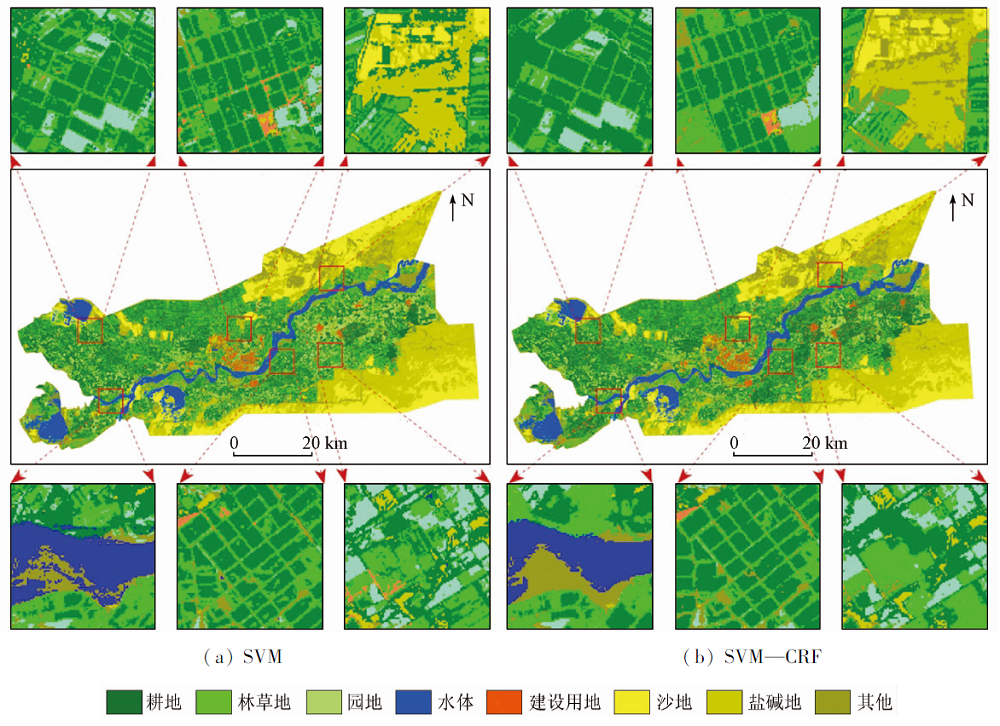
The clarification of the dynamic change trend of cultivated land and its driving factors is an important basis for ensuring national food security, rationally developing and utilizing soil and water resources and adjusting land use structure. Taking Alar reclamation area in southern Xinjiang as an example and based on Landsat satellite remote sensing images, population, GDP and other data of seven important periods from 1990 to 2019, the authors selected the best algorithm to interpret remote sensing images by comparing the accuracy of five classification algorithms comprising SAM-CRF, ANN-CRF, MDC-CRF, MLC-CRF and SVM-CRF. Next, the characteristics of cultivated land area change, type transformation and spatial dynamic change were analyzed by using the interpretation results, and then the main driving factors, action path and intensity of cultivated land area change were discussed. The results show that the SVM-CRF algorithm has the highest classification accuracy among the five classification algorithms, with the overall accuracy of 0.95 and the Kappa coefficient of 0.94. The overall accuracy of the other four algorithms is between 0.65 and 0.89, and the Kappa coefficient is between 0.58 and 0.86. The area of cultivated land in the study area has continued to increase in the past three decades, and the net increase in cultivated land area is 729.97 km 2 (312.21%). Cultivated land transfer-in and transfer-out has shown a trend of outward expansion and inward contraction, respectively. Total population, GDP, Total Investment in Fixed Assets, gross agricultural product and cotton price are the main driving factors for the change of cultivated land area,among which GDP has the greatest direct impact on the change of cultivated land area, while cotton price has the least impact. Except that GDP has a negative effect on cultivated land area, the other four factors have a positive effect on cultivated land area, and the overall performance of the five factors is a positive effect.

Key wordschange of cultivated land    driving factors    remote sensing    Landsat    land use/cover
收稿日期: 2020-06-22      出版日期: 2021-07-21
ZTFLH:  TP79  
基金资助:兵团中青年科技创新领军人才项目“棉田土壤剖面盐溃化的卫星遥感监测研究”(2020CB032);国家重点研发计划项目“土壤综合观测与智能服务平台研发与应用”(2018YFE0107000)
通讯作者: 彭杰
作者简介: 宋 奇(1996-),男,硕士研究生,主要研究方向为国土资源与遥感。Email: tarimsongqi@163.com
引用本文:   
宋奇, 冯春晖, 高琪, 王明玥, 吴家林, 彭杰. 阿拉尔垦区近30年耕地变化及其驱动因子分析[J]. 国土资源遥感, 2021, 33(2): 202-212.
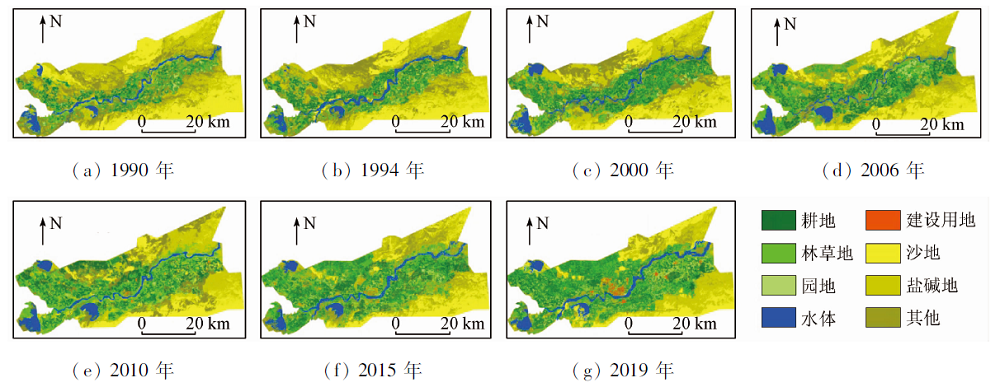
SONG Qi, FENG Chunhui, GAO Qi, WANG Mingyue, WU Jialin, PENG Jie. Change of cultivated land and its driving factors in Alar reclamation area in the past thirty years. Remote Sensing for Land & Resources, 2021, 33(2): 202-212.
链接本文:  
https://www.gtzyyg.com/CN/10.6046/gtzyyg.2020183      或      https://www.gtzyyg.com/CN/Y2021/V33/I2/202
Fig.1  研究区地理位置图
Fig.2  1990—2019年阿拉尔垦区卫星遥感影像
类型 包含地类 假彩色影像特征 假彩色影像 实地照片
耕地 棉地、玉米地、小麦地、高粱地等 鲜红色,形状规则,一般为矩形,均匀分布
林草地 胡杨、草场、柽柳等 红色,形状不规则,一般分布在河流及道路两侧
园地 苹果地、葡萄地、枣地、香梨地等 暗红色,形状相对规则,连片分布
水体 河流、水库、沟渠等 蓝色,形状规则,有明显边界线
建设用地 城镇、学校、乡村、工矿等各类建设用地 白色、浅蓝色,形状规则,连片分布
沙地 沙漠、沙质土壤 淡黄色,形状不规则,有清晰纹理,成片分布
盐碱地 受到盐渍化污染的土壤 白色,形状不规则,有明显白色斑块,成片分布
其他 湿地、裸石、荒地等 棕色或黑色,形状不规则,多分布于水体及荒地附近
Tab.1  阿拉尔垦区分类体系及解译标志
Fig.3  每类样本点个数和分布图
类型 SAM—CRF ANN—CRF MDC—CRF MLC—CRF SVM—CRF
UA/% PA/% UA/% PA/% UA/% PA/% UA/% PA/% UA/% PA/%
耕地 73.85 74.15 91.56 77.87 92.47 83.30 94.47 89.90 98.41 99.77
林草地 34.50 45.87 65.20 68.33 72.24 69.86 83.59 77.21 97.33 94.89
园地 55.63 63.23 76.44 84.08 81.09 85.30 92.05 87.91 96.89 97.64
水体 85.48 72.13 88.65 79.47 90.66 82.84 91.67 85.69 92.81 93.34
建设用地 42.13 47.57 63.30 71.29 67.70 72.92 83.15 86.12 96.43 90.40
沙地 78.89 48.73 85.02 76.09 88.11 86.38 89.11 88.49 95.32 89.49
盐碱地 60.37 87.37 73.51 90.31 81.59 91.57 82.23 92.71 95.63 93.74
其他 52.60 72.03 78.61 77.82 81.57 83.96 88.46 88.19 91.93 98.95
Kappa 0.58 0.77 0.82 0.86 0.94
OA 0.64 0.81 0.84 0.89 0.95
Tab.2  2019年SAM—CRF,ANN—CRF,MDC—CRF,MLC—CRF和SVM—CRF分类结果的精度对比
Fig.4  各方法分类结果比较
Fig.5  SVM和SVM—CRF算法结果局部区域对比

类别
预测类别
总计

UA/%
耕地 林草地 园地 水体 建设用地 沙地 盐碱地 其他
真实类别 耕地 20 896 207 34 8 15 52 16 6 21 234 98.41
林草地 22 10 129 167 26 0 4 25 34 10 407 97.33
园地 22 235 8 867 1 0 8 10 9 9 152 96.89
水体 0 0 0 17 579 0 1 334 7 20 18 940 92.81
建设用地 0 0 0 8 2 485 68 10 6 2 577 96.43
沙地 0 0 0 677 0 17 152 132 33 17 994 95.32
盐碱地 0 51 0 9 193 418 16 855 99 17 625 95.63
其他 4 52 13 525 56 130 926 19 440 21 146 91.93
总计 20 944 10 674 9 081 18 833 2 749 19 166 17 981 19 647 119 075
PA/% 99.77 94.89 97.64 93.34 90.40 89.49 93.74 98.95 OA/% 95.24
Tab.3  阿拉尔垦区用地类型精度评价
Fig.6  1990—2019年阿拉尔垦区土地利用/覆被图
Fig.7  1990—2019年阿拉尔垦区各用地类型所占比例
Fig.8  1990—2019年阿拉尔垦区各土地利用类型的年均变化率
年份 1990年 合计
耕地 林草地 园地 水体 建设用地 沙地 盐碱地 其他
2019年 耕地 94.91 32.95 11.37 1.27 54.97 312.99 345.74 854.20
林草地 52.49 17.74 15.94 0.92 57.43 260.87 258.29 663.68
园地 47.67 59.68 2.43 0.52 17.96 73.15 113.17 314.58
水体 1.08 12.18 0.39 0.09 15.20 67.03 46.20 142.17
建设用地 10.59 12.90 1.82 0.29 1.38 8.03 22.55 57.56
沙地 0.12 4.93 0.15 4.48 0.02 105.39 49.29 164.38
盐碱地 3.13 4.09 0.61 5.05 0.13 351.32 109.86 474.19
其他 9.17 40.13 3.49 35.34 0.53 88.52 177.01 354.19
合计 124.25 228.82 57.15 74.90 3.48 586.78 1 004.47 945.10
Tab.4  1990—2019年阿拉尔垦区各地类变化转换矩阵
Fig.9  1990—2019年耕地空间动态变化图
年份 总人口/
万人
非农业人
口/万人
GDP/
亿元
全社会固定资
产投资/亿元
第一产
业/亿元
农业生产
总值/亿元
棉花价格/
(元·kg-1)
年均气
温/℃
年均降
水量/mm
耕地面
积/km2
1990年 -1.49 -0.97 -0.79 -0.74 -0.91 -0.82 -1.78 1.05 -0.65 -1.48
1994年 -0.95 -0.87 -0.72 -0.72 -0.79 -0.84 -0.57 0.42 -1.25 -0.95
2000年 -0.16 -0.81 -0.66 -0.67 -0.73 -0.75 -0.29 -0.85 -1.22 -0.40
2006年 0.19 -0.11 -0.47 -0.47 -0.46 -0.46 0.46 -1.17 0.77 0.12
2010年 0.24 0.09 -0.20 -0.25 0.18 0.10 1.25 -0.85 0.89 0.55
2015年 0.65 1.17 1.19 1.13 1.15 1.49 0.15 1.37 0.55 0.84
2019年 1.52 1.50 1.66 1.71 1.56 1.27 0.79 0.04 0.91 1.31
Tab.5  阿拉尔垦区1990—2019年耕地面积变化与相关指标标准化后数值
相关系数 总人口/
万人
非农业人
口/万人
GDP/
亿元
全社会固定资
产投资/亿元
第一产
业/亿元
农业生产
总值/亿元
棉花价格/
(元·kg-1)
年均气
温/℃
年均降
水量/mm
耕地面
积/km2
总人口/万人
非农业人口/万人 0.91
GDP/亿元 0.86 0.97
全社会固定资产投资/亿元 0.85 0.97 0.99
第一产业/亿元 0.89 0.99 0.99 0.98
农业生产总值/亿元 0.83 0.97 0.97 0.96 0.98
棉花价格/
(元·kg-1)
0.82 0.65 0.50 0.49 0.62 0.55
年均气温/℃ -0.22 0.17 0.31 0.31 0.23 0.33 -0.54
年均降水量/mm 0.74 0.79 0.64 0.63 0.72 0.70 0.75 -0.17
耕地面积/km2 0.98 0.93 0.85 0.84 0.91 0.87 0.87 -0.17 0.81
Tab.6  耕地变化驱动力变量相关系数矩阵
因子 直接作用 间接作用
总人口/
万人
GDP/
亿元
全社会固
定资产投
资/亿元
农业生
产总值/
亿元
棉花
价格/
(元·kg-1)
总人口/万人 0.57** -1.29** 0.95** 0.52** 0.21**
GDP/亿元 -1.51** 0.49** 1.12** 0.61** 0.13**
全社会
固定资
产投资/
亿元
1.12** 0.48** -1.51** 0.61** 0.12**
农业生
产总值/
亿元
0.63** 0.47** -1.46** 1.07** 0.14**
棉花价
格/(元·kg-1)
0.26** 0.47** -0.76** 0.54** 0.34**
Tab.7  驱动因子对耕地面积的通径系数
[1] 赵晓丽, 张增祥, 汪潇, 等. 中国近30a耕地变化时空特征及其主要原因分析[J]. 农业工程学报, 2014, 30(3):1-11.
Zhao X L, Zhang Z X, Wang X, et al. Analysis of chinese cultivated land’s spatial-temporal changes and causes in recent 30 years[J]. Transactions of the Chinese Society of Agricultural Engineering, 2014, 30(3):1-11.
[2] Wang Y H, Dai E F, Yin L, et al. Land use/land cover change and the effects on ecosystem services in the Hengduan mountain region,China[J]. Ecosystem Services, 2018, 34(A):55-67.
doi: 10.1016/j.ecoser.2018.09.008
[3] Wang J, Chen Y Q, Shao X M, et al. Land-use changes and policy dimension driving forces in China:Present,trend and future[J]. Land Use Policy, 2012, 29(4):737-749.
doi: 10.1016/j.landusepol.2011.11.010
[4] 陈红, 吴世新, 冯雪力. 基于遥感和GIS的新疆耕地变化及驱动力分析[J]. 自然资源学报, 2010, 25(4):614-624.
Chen H, Wu S X, Feng X L. Study on the changes of cultivated Land and the driving factors in Xinjiang based on RS and GIS[J]. Journal of Natural Resources, 2010, 25(4):614-624.
[5] 李景刚, 何春阳, 史培军, 等. 近20年中国北方13省的耕地变化与驱动力[J]. 地理学报, 2004, 59(2):274-282.
Li J G, He C Y, Shi P J, et al. Change process of cultivated land and its driving forces in northern China during 1983—2001[J]. Acta Geographica Sinica, 2004, 59(2):274-282.
[6] 杨桂山. 土地利用/覆被变化与区域经济发展—长江三角洲近50年耕地数量变化研究的启示[J]. 地理学报, 2004, 59(s1):41-46.
Yang G S. Land use and land cover change and regional economic development:The revelation of the change in cropland area in the Yangtze river delta during the past 50 years[J]. Acta Geographica Sinica, 2004, 59(s1):41-46.
[7] Jia B Q, Zhang Z Q, Ci L G, et al. Oasis land-use dynamics and its influence on the oasis environment in Xinjiang,China[J]. Journal of Arid Environments, 2004, 56(1):11-26.
doi: 10.1016/S0140-1963(03)00002-8
[8] Wang X C, Dong X B, Liu H M, et al. Linking land use change,ecosystem services and human well-being:A case study of the Manas River Basin of Xinjiang,China[J]. Ecosystem Services, 2017, 27(A):113-123.
doi: 10.1016/j.ecoser.2017.08.013
[9] 禹丝思, 孙中昶, 郭华东, 等. 海上丝绸之路超大城市空间扩展遥感监测与分析[J]. 遥感学报, 2017, 21(2):169-181.
Yu S S, Sun Z C, Guo H D, et al. Monitoring and analyzing the spatial dynamics and patterns of megacities along the Maritime Silk Road[J]. Journal of Remote Sensing, 2017, 21(2):169-181.
[10] 蔡利华. 阿拉尔垦区耕地养分现状与分布特征[D]. 石河子:石河子大学, 2013.
Cai L H. The status and spatial distribution of soil nutrient in Alar reclamation area[D]. Shihezi:Shihezi University, 2013.
[11] 张艳波, 闫慧洁. 阿拉尔垦区自然灾害对农业经济影响的研究[J]. 数学的实践与认识, 2017, 47(1):286-290.
Zhang Y B, Yan H J. Effect of natural disaster on agricultural economy in Alar irrigated area[J]. Mathematics in Practice and Theory, 2017, 47(1):286-290.
[12] 朱金峰, 周艺, 王世新, 等. 1975年—2018年白洋淀湿地变化分析[J]. 遥感学报, 2019, 23(5):971-986.
Zhu J F, Zhou Y, Wang S X, et al. Analysis of changes of Baiyangdian wetland from 1975 to 2018 based on remote sensing[J]. Journal of Remote Sensing, 2019, 23(5):971-986.
[13] 梁亮, 杨敏华, 李英芳. 基于ICA与SVM算法的高光谱遥感影像分类[J]. 光谱学与光谱分析, 2010, 30(10):2724-2728.
Liang L, Yang M H, Li Y F. Hyperspectral remote sensing image classification based on ICA and SVM algorithm[J]. Spectroscopy and Spectral Analysis, 2010, 30(10):2724-2728.
[14] 袁静文, 武辰, 杜博, 等. 高分五号高光谱遥感影像的城市土地利用景观格局分析[J]. 遥感学报, 2020, 24(4):465-478.
Yuan J W, Wu C, Du B, et al. Analysis of landscape pattern on urban land use based on GF-5 hyperspectral data[J]. Journal of Remote Sensing(Chinese), 2020, 24(4):465-478.
[15] Gong J Z, Jiang C, Chen W L, et al. Spatiotemporal dynamics in the cultivated and built-up land of Guangzhou:Insights from zoning[J]. Habitat International, 2018, 82:104-112.
doi: 10.1016/j.habitatint.2018.10.004
[16] Liu C H, Ma X X. Analysis to driving forces of land use change in Lu’an mining area[J]. Transactions of Nonferrous Metals Society of China, 2011, 21(3):727-732.
[17] Elagouz M H, Abou-Shleel S M, Belal A A, et al. Detection of land use/cover change in egyptian nile delta using remote sensing[J]. The Egyptian Journal of Remote Sensing and Space Sciences, 2020, 23(1):57-62.
[18] Shen S G, Yue P, Fan C J. Quantitative assessment of land use dynamic variation using remote sensing data and landscape pattern in the Yangtze river delta,China[J]. Sustainable Computing:Informatics and Systems, 2019, 23:111-119.
doi: 10.1016/j.suscom.2019.07.006
[19] 宋戈, 王越, 雷国平. 松嫩高平原黑土区耕地利用系统安全影响因子作用机理研究——以黑龙江省巴彦县为例[J]. 自然资源学报, 2014, 29(1):13-26.
Song G, Wang Y, Lei G P. Effect mechanism research of influential factors of cultivated land use system security of black soil region in songnen high plain:A case study of Bayan County in Heilongjiang Province[J]. Journal of Natural Resources, 2014, 29(1):13-26.
[20] Tian G J, Liu J Y, Xie Y C, et al. Analysis of spatio-temporal dynamic pattern and driving forces of urban land in China in 1990s using TM images and GIS[J]. Cities, 2005, 22(6):400-410.
doi: 10.1016/j.cities.2005.05.009
[21] Fan Q D, Ding S Y. Landscape pattern changes at a county scale:A case study in Fengqiu,Henan Province,China from 1990 to 2013[J]. Catena, 2016, 137:152-160.
doi: 10.1016/j.catena.2015.09.012
[22] Liu Y L, Luo T, Liu Z Q, et al. A comparative analysis of urban and rural construction land use change and driving forces:implications for urbanerural coordination development in Wuhan,Central China[J]. Habitat International, 2015, 47:113-125.
doi: 10.1016/j.habitatint.2015.01.012
[1] 王建强, 邹朝晖, 刘荣波, 刘志松. 基于U2-Net深度学习模型的沿海水产养殖塘遥感信息提取[J]. 自然资源遥感, 2023, 35(3): 17-24.
[2] 王叶兰, 杨鑫, 郝利娜. 2001—2021年川西高原植被NDVI时空变化及影响因素分析[J]. 自然资源遥感, 2023, 35(3): 212-220.
[3] 唐晖, 邹娟, 尹向红, 余姝辰, 贺秋华, 赵动, 邹聪, 罗建强. 基于高分遥感的洞庭湖区河湖采砂监管及典型案例分析[J]. 自然资源遥感, 2023, 35(3): 302-309.
[4] 于航, 安娜, 汪洁, 邢宇, 许文佳, 步凡, 王晓红, 杨金中. 黔西南采煤塌陷区高分遥感动态监测——以六盘水市煤矿采空塌陷区为例[J]. 自然资源遥感, 2023, 35(3): 310-318.
[5] 王静, 王佳, 徐江琪, 黄邵东, 刘东云. 改进遥感生态指数的典型海岸带城市生态环境质量评价——以湛江市为例[J]. 自然资源遥感, 2023, 35(3): 43-52.
[6] 徐欣钰, 李小军, 赵鹤婷, 盖钧飞. NSCT和PCNN相结合的遥感图像全色锐化算法[J]. 自然资源遥感, 2023, 35(3): 64-70.
[7] 刘立, 董先敏, 刘娟. 顾及地学特征的遥感影像语义分割模型性能评价方法[J]. 自然资源遥感, 2023, 35(3): 80-87.
[8] 牛祥华, 黄微, 黄睿, 蒋斯立. 基于注意力特征融合的高保真遥感图像薄云去除[J]. 自然资源遥感, 2023, 35(3): 116-123.
[9] 董婷, 符潍奇, 邵攀, 高利鹏, 武昌东. 基于改进全连接条件随机场的SAR影像变化检测[J]. 自然资源遥感, 2023, 35(3): 134-144.
[10] 郭晓萌, 方秀琴, 杨露露, 曹煜. 基于人工神经网络的西辽河流域根区土壤湿度估算[J]. 自然资源遥感, 2023, 35(2): 193-201.
[11] 李娜, 甘甫平, 董新丰, 李娟, 张世凡, 李彤彤. 基于高分五号高光谱数据的石漠化调查应用研究[J]. 自然资源遥感, 2023, 35(2): 230-235.
[12] 方贺, 张育慧, 何月, 李正泉, 樊高峰, 徐栋, 张春阳, 贺忠华. 浙江省植被生态质量时空变化及其驱动因素分析[J]. 自然资源遥感, 2023, 35(2): 245-254.
[13] 张仙, 李伟, 陈理, 杨昭颖, 窦宝成, 李瑜, 陈昊旻. 露天开采矿区要素遥感提取研究进展及展望[J]. 自然资源遥感, 2023, 35(2): 25-33.
[14] 马世斌, 皮英楠, 王佳, 张焜, 李生辉, 彭玺. 基于遥感的绿色勘查高效监管方法体系研究[J]. 自然资源遥感, 2023, 35(2): 255-263.
[15] 王平. 热红外遥感技术在钢铁去产能监测中的应用[J]. 自然资源遥感, 2023, 35(2): 271-276.
Viewed
Full text


Abstract

Cited

  Shared   
  Discussed   
京ICP备05055290号-2
版权所有 © 2015 《自然资源遥感》编辑部
地址:北京学院路31号中国国土资源航空物探遥感中心 邮编:100083
电话:010-62060291/62060292 E-mail:zrzyyg@163.com
本系统由北京玛格泰克科技发展有限公司设计开发