|
|
 |
|
|
|
|
Effects of climate changes on the NDVI of vegetation in Asia |
PANG Xin1( ), LIU Jun2 ), LIU Jun2 |
1. Shanxi Conservancy Technical Institute, Yuncheng 044000, China
2. College of Mining Engineering, Taiyuan University of Technology, Taiyuan 030024, China |
|
|
|
|
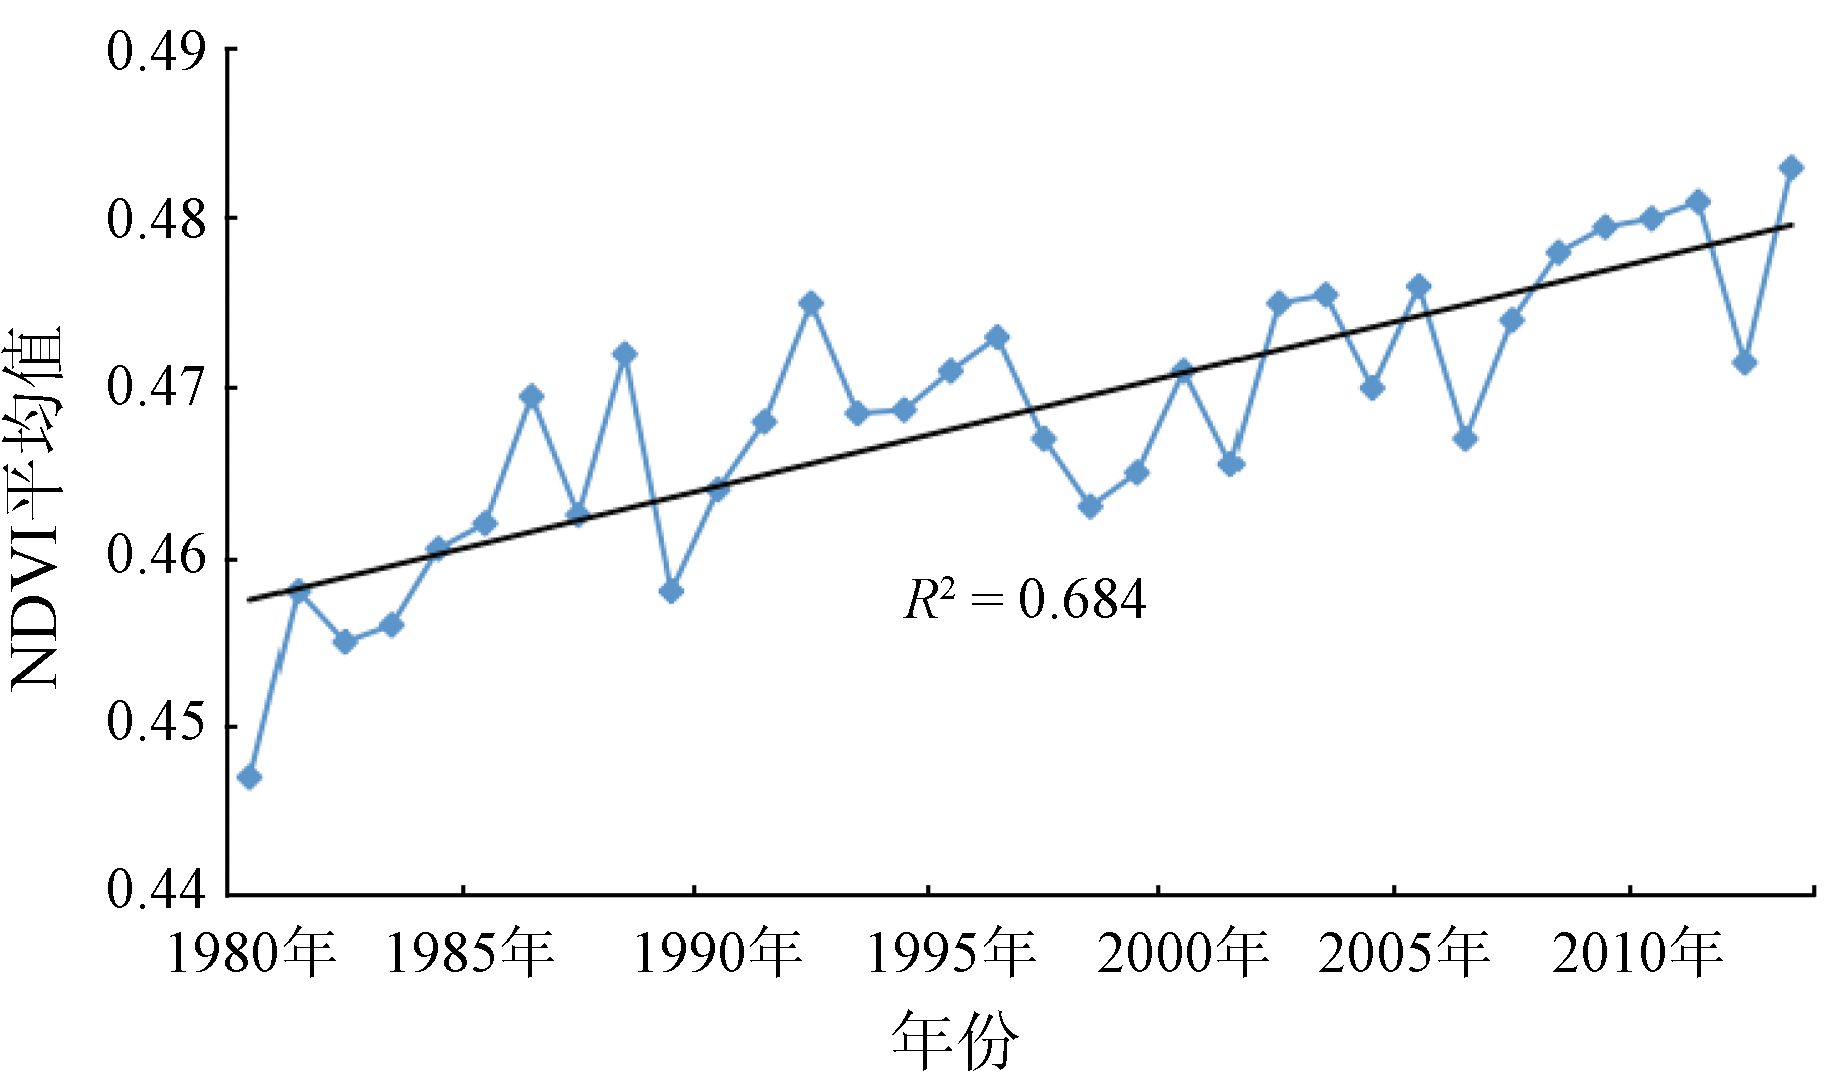
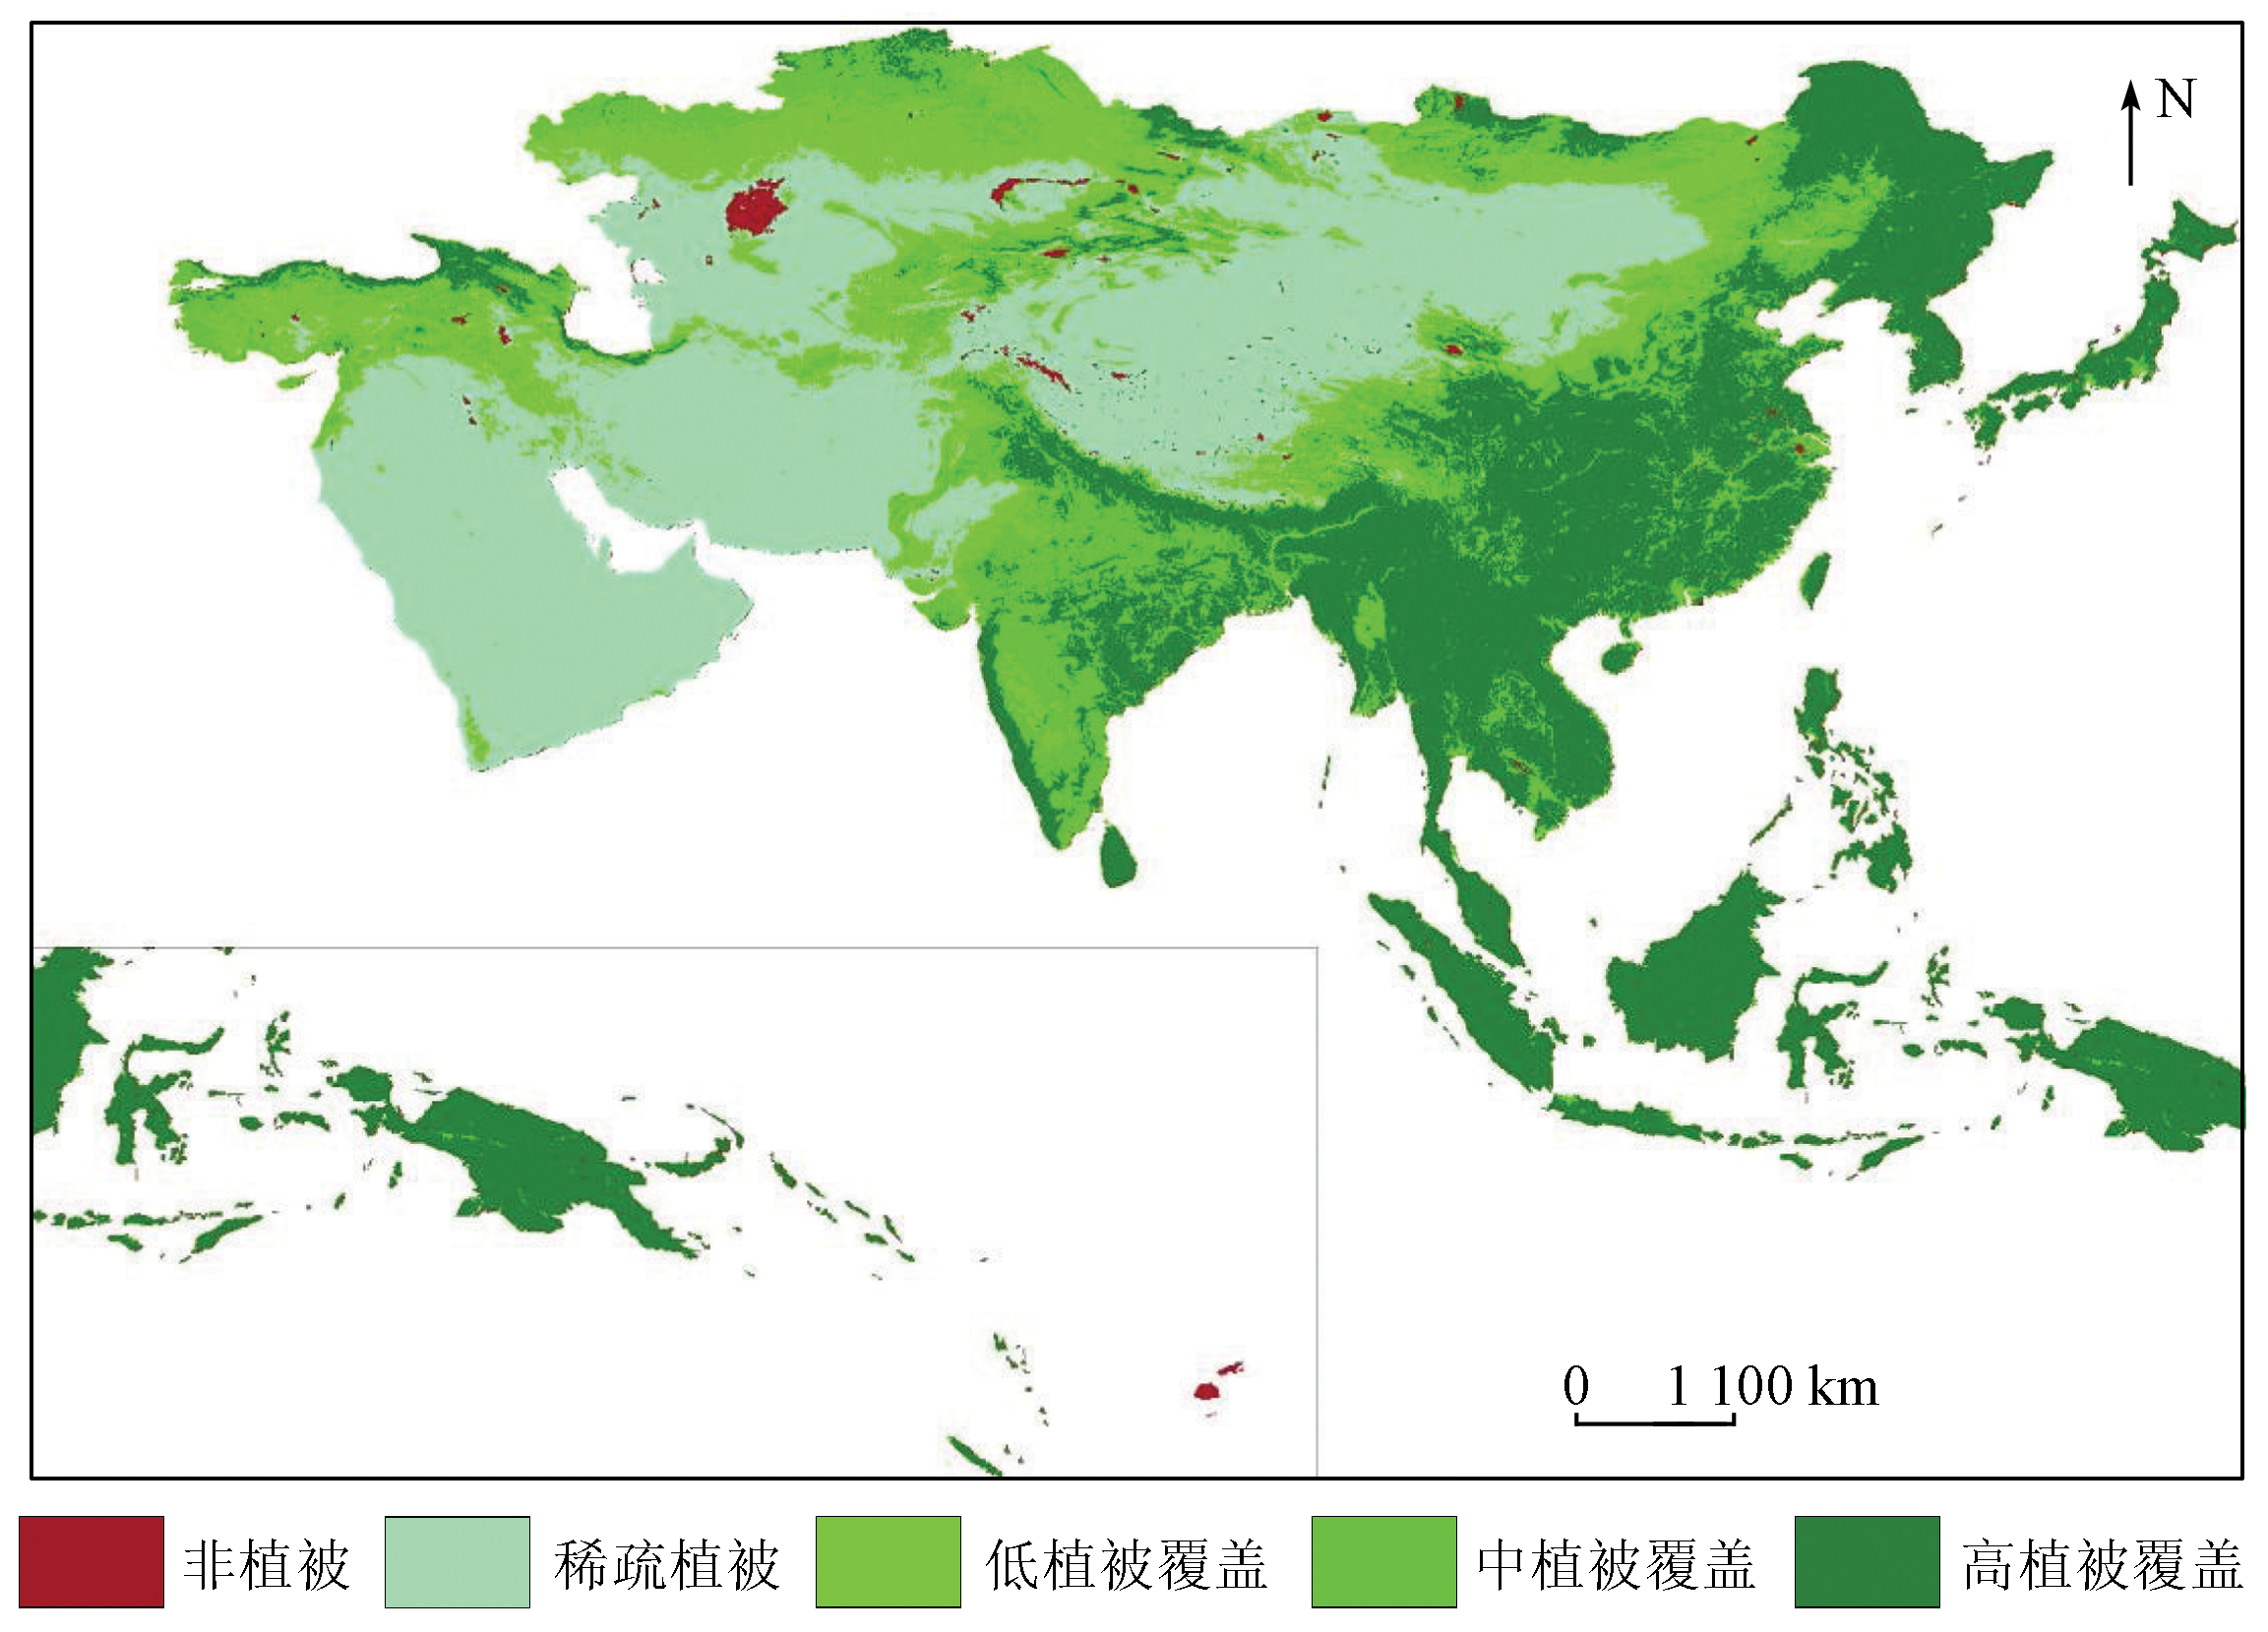
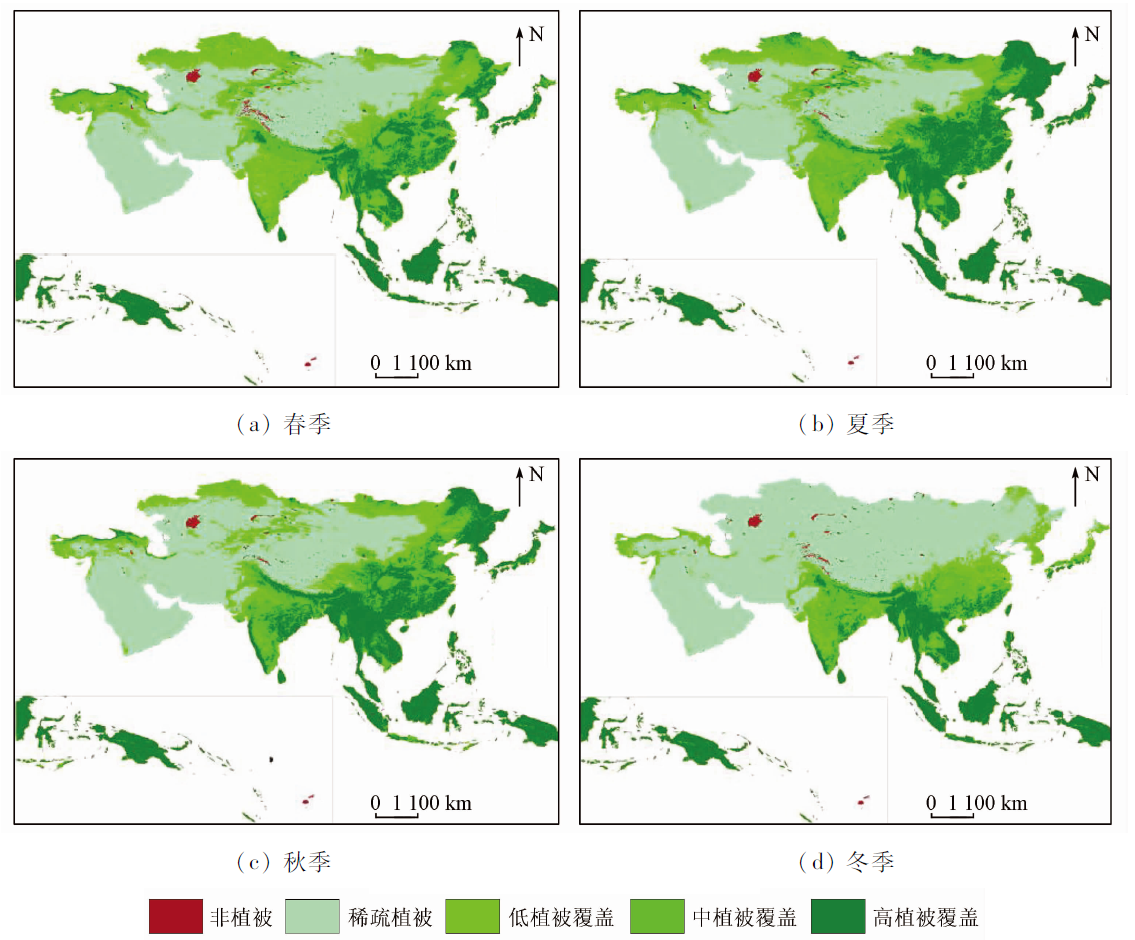
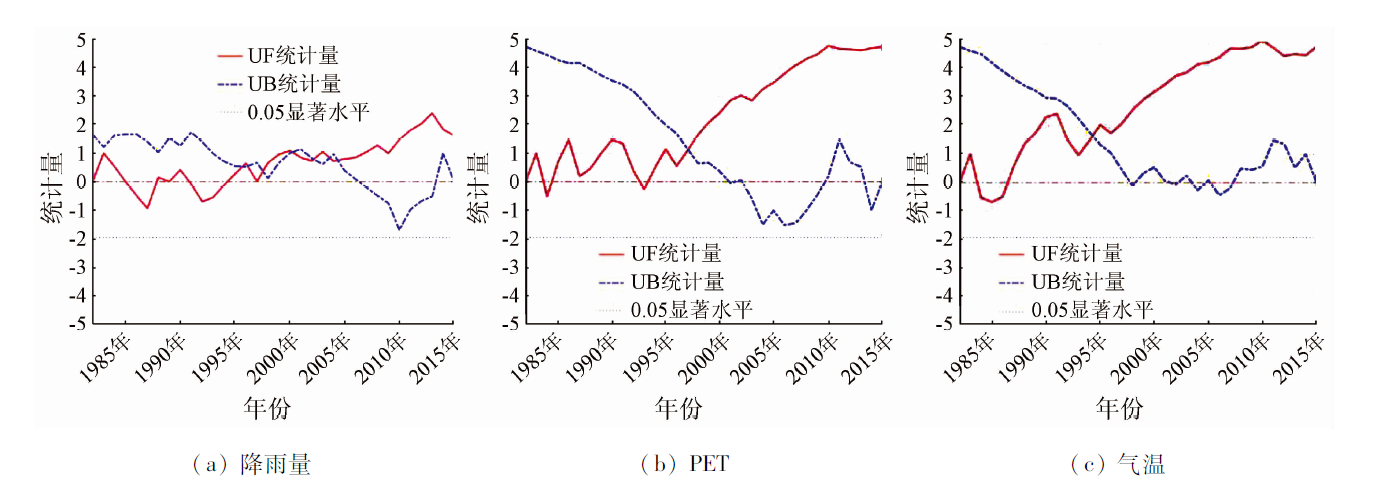
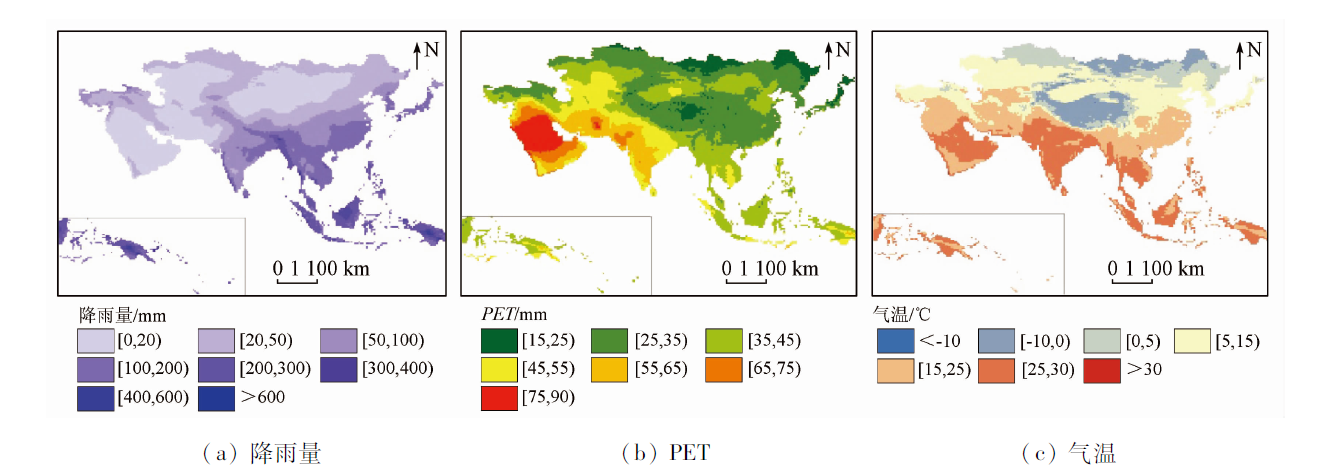
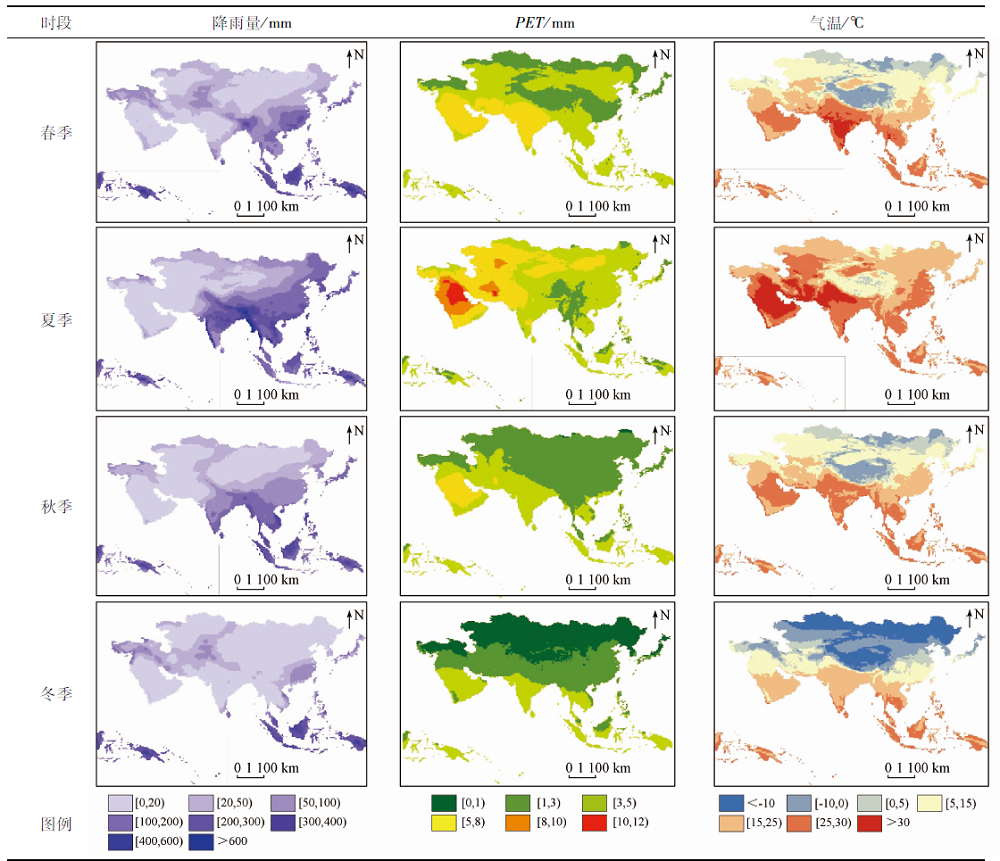
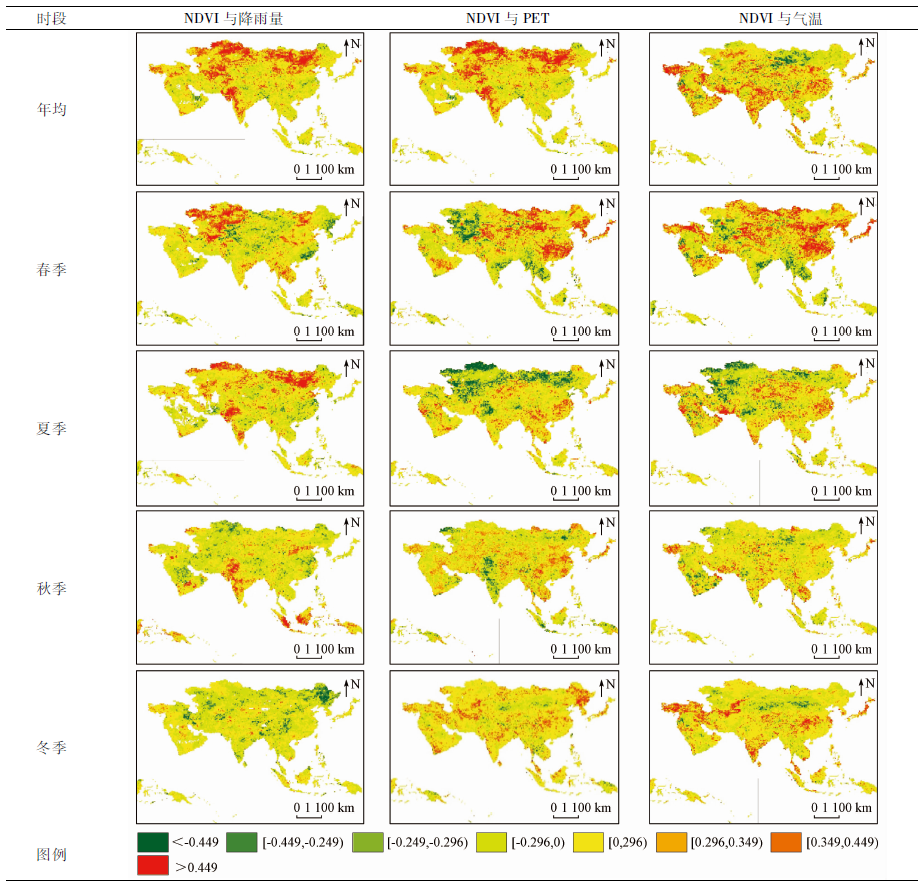
Abstract Based on the long-time-series (1982—2015) GIMMS NDVI3g and CRU Ts datasets of precipitation, temperature, and potential evapotranspiration (PET) of Asia, this study identified the spatio-temporal variations in the vegetation coverage and climatic elements in Asia in the past 34 years using the maximum-value composite procedure, Mann-Kendall trend tests, and correlation analysis. Furthermore, this study analyzed the response of vegetation coverage to climate changes and explored the influence mechanisms of climate changes on the dynamic changes of vegetation. The results show that the vegetation in Asia during 1982—2015 is as follows: ① the vegetation coverage was high (NDVI > 0.5) in Southeast Asia, Japan, India, and the southern coasts of China but low in most parts of central Asia; ② the NDVI in Asia showed an upward trend at an increasing rate of 0.000 7/a. Moreover, the vegetation coverage exhibited a significant seasonal increase, with spring contributing the most to the interannual NDVI; ③ The PET in Asia was high in the west but low in the east. For example, the PET was high (> 40 mm) in arid and semi-arid Central Asia and Western Asia; ④ The temperature in Asia was high in the south and low in the north. For example, in China, the temperature was higher than 15 ℃ in the south and lower than 15 ℃ in the north. Rainfall exhibited a similar but more significant spatial distribution compared to the temperature; ⑤ The temperature, rainfall, and PET showed regional effects on NDVI. For example, rainfall and PET served as the main factors influencing NDVI in northern Asia, while the temperature was the main factor influencing NDVI in central and southern Asia; ⑥ The effects of climate changes on NDVI were significant in spring and especially summer but were nonsignificant in autumn and winter; ⑦ The effects of climate changes on NDVI showed a significant time lag of one month.
|
| Keywords
vegetation coverage
NDVI
climate change
Mann-Kendall trend test
correlation analysis
|
|
|
|
Issue Date: 07 July 2023
|
|
|
| [1] |
Piao S L, Ciais P, Huang Y, et al. The impacts of climate change on water resources and agriculture in China[J]. Nature, 2010, 467(7311):43-51.
doi: 10.1038/nature09364
|
| [2] |
朴世龙, 方精云. 最近18 年来中国植被覆盖的动态变化[J]. 第四纪研究, 2001, 21(4):294-302.
|
| [2] |
Piao S L, Fang J Y. Dynamic vegetation over change over the last 18 years in China[J]. Quaternary Sciences, 2001, 21(4):294-302.
|
| [3] |
孙红雨, 王长耀, 牛铮. 中国地表植被覆盖变化及其与气候因子关系──基于NOAA时间序列数据分析[J]. 遥感学报, 1998, 2(3):204-210.
|
| [3] |
Sun H Y, Wang C Y, Niu Z, et al. Analysis of the vegetation cover change and the relationship btween NDVI and environmental factors by using NOAA time series data[J]. Journal of Remote Sensing, 1998, 2(3):204-210.
|
| [4] |
高江波, 焦珂伟, 吴绍洪. 1982—2013年中国植被NDVI空间异质性的气候影响分析[J]. 地理学报, 2019, 74(3):534-543.
doi: 10.11821/dlxb201903010
|
| [4] |
Gao J B, Jiao K W, Wu S H. Revealing the climatic impacts on spatial heterogeneity of NDVI in China during 1982—2013[J]. Acta Geographica Sinica, 2019, 74(3):534-543.
|
| [5] |
覃巧婷, 陈建军, 杨艳萍, 等. 黄河源植被时空变化及其对地形和气候的响应[J]. 中国环境科学, 2021, 41(8):3832-3841.
|
| [5] |
Qin Q T, Chen J J, Yang Y P, et al. Spatiotemporal variations of vegetation and its response to topography and climate in the source region of the Yellow River[J]. China Environmental Science, 2021, 41(8):3832-3841.
|
| [6] |
崔利芳, 王伦澈, 屈赛, 等. 气温、降水量和人类活动对长江流域植被NDVI的影响[J]. 地球科学, 2020, 45(6):1905-1917.
|
| [6] |
Cui L F, Wang L C, Qu S, et al. Impacts of temperature,precipitation and human activity on vegetation NDVI in Yangtze River basin,China[J]. Earth Science, 2020, 45(6):1905-1917.
|
| [7] |
崔林丽, 史军, 肖风劲, 等. 中国东部NDVI的变化趋势及其与气候因子的相关分析[J]. 资源科学, 2010, 32(1):124-131.
|
| [7] |
Cui L L, Shi J, Xiao F J, et al. Variation trends in vegetation NDVI and its correlation with climatic factors in eastern China[J]. Resources Science, 2010, 32(1):124-131.
|
| [8] |
赵茂盛, 符淙斌, 延晓冬, 等. 应用遥感数据研究中国植被生态系统与气候的关系[J]. 地理学报, 2001, 56(3):287-296.
doi: 10.11821/xb200103005
|
| [8] |
Zhao M S, Fu C B, Yan X D, et al. Study on the relationship between different ecosystems and climate in china using NOAA/AVHRR data[J]. Acta Geographica Sinica, 2001, 56(3):287-296.
doi: 10.11821/xb200103005
|
| [9] |
Ichii K, Kawbata A, Yamaguchi Y. Global correlation analysis for NDVI and climatic variables and NDVI trends: 1982—1990[J]. International Journal Remote Sensing, 2002, 23(18):3873-3878.
doi: 10.1080/01431160110119416
url: https://www.tandfonline.com/doi/full/10.1080/01431160110119416
|
| [10] |
侯静. 基于GIMMS3g的近30年全球荒漠—草原过渡带植被特征及其对气候变化的响应[D]. 银川: 宁夏大学, 2016.
|
| [10] |
Hou J. Characteristics of vegetation changes and its responses to climate change in desert/grassland biome transition zone in the last 30 years based on GIMMS3g[D]. Yinchuan: Ningxia University, 2016.
|
| [11] |
张永强, 孔冬冬, 张选泽, 等. 2003—2017年植被变化对全球陆面蒸散发的影响[J]. 地理学报, 2021, 76(3):584-594.
doi: 10.11821/dlxb202103007
|
| [11] |
Zhang Y Q, Kong D D, Zhang X Z. Impacts of vegetation changes on global evapotranspiration in the period 2003—2017[J]. Acta Geographica Sinica, 2021, 76(3):584-594.
|
| [12] |
杨艳萍, 陈建军, 覃巧婷, 等. 2000—2018年广西植被时空变化及其对地形、气候和土地利用的响应[J]. 农业工程学报, 2021, 37(17):234-241.
|
| [12] |
Yang Y P, Chen J J, Qin Q T, et al. Temporal and spatial variation of vegetation and its response to topography,climate and land use in Guangxi during 2000—2018[J]. Transactions of the Chinese Society of Agricultural Engineering, 2021, 37(17):234-241.
|
| [13] |
Zhang Y L, Song C H, Band L E, et al. Reanalysis of global terrestrial vegetation trends from MODIS products:Browning or greening[J]. Remote Sensing of Environment, 2017, 191:145-155.
doi: 10.1016/j.rse.2016.12.018
url: https://linkinghub.elsevier.com/retrieve/pii/S0034425716304977
|
| [14] |
Huang J, Wang H M, Dai Q, et al. Analysis of NDVI data for crop identification and yield estimation[J]. IEEE Journal of Selected Topics in Applied Earth Observations and Remote Sensing, 2014, 7(11):4374-4384.
doi: 10.1109/JSTARS.4609443
url: https://ieeexplore.ieee.org/xpl/RecentIssue.jsp?punumber=4609443
|
| [15] |
靳文娅. 鄂托克前旗近40a气候变化特征及突变分析[J]. 农业灾害研究, 2021, 11(3):28-29,32.
|
| [15] |
Jin W Y. Characteristics of climate change and abrupt change in Etuokeqian Banner in recent 40 years[J]. Journal of Agricultural Catastrophology, 2021, 11(3):28-29,32.
|
| [16] |
于海英, 陈淑伶, 杨莉琳, 等. 贵阳市近70年气候突变检测及变化趋势分析[J]. 西南大学学报(自然科学版), 2021, 43(9):115-123.
|
| [16] |
Yu H Y, Chen S L, Yang L L, et al. Change point detection of climate in Guiyang during the last 70 years and analysis of its change trend[J]. Journal of Southwest University(Natural Science Edition), 2021, 43(9):115-123.
|
| [17] |
李晓兵, 王瑛, 李克让. NDVI对降水季节性和年际变化的敏感性[J]. 地理学报, 2000(s1):82-89.
doi: 10.11821/xb2000S1013
|
| [17] |
Li X B, Wang Y, Li K R. NDVI sensitivity to seasonal and interannual rainfall variations in northern China[J]. Acta Geographica Sinica, 2000(s1):82-89.
|
| [18] |
刘启兴, 董国涛, 景海涛, 等. 2000—2016年黄河源区植被NDVI变化趋势及影响因素[J]. 水土保持研究, 2019, 26(3):86-92.
|
| [18] |
Liu Q X, Dong G T, Jing H T, et al. Change trend of vegetation NDVI and its influencing factors in the source region of the Yellow River in the period from 2000 to 2016[J]. Research of Soil and Water Conservation, 2019, 26(3):86-92.
|
| [19] |
索玉霞, 王正兴, 刘闯, 等. 中亚地区1982年至2002年植被指数与气温和降水的相关性分析[J]. 资源科学, 2009, 31(8):1422-1429.
|
| [19] |
Suo Y X, Wang Z X, Liu C, et al. Relationship between NDVI and precipitation and temperature in middle Asia during 1982—2002[J]. Resources Science, 2009, 31(8):1422-1429.
|
| [20] |
毕馨予, 刘晓静, 马东来, 等. 辽宁省植被NDVI对气候因子的滞后响应研究[J]. 中国农业资源与区划, 2021, 42(10):233-244.
|
| [20] |
Bi X Y, Liu X J, Ma D L, et al. Lag response of vegetation NDVI to climate factors in Liaoning Province[J]. Chinese Journal of Agricultural Resources and Regional Planning, 2021, 42(10):233-244.
|
|
Viewed |
|
|
|
Full text
|
|
|
|
|
Abstract
|
|
|
|
|
Cited |
|
|
|
|
| |
Shared |
|
|
|
|
| |
Discussed |
|
|
|
|
 2023,
Vol. 35
2023,
Vol. 35