|
|
|
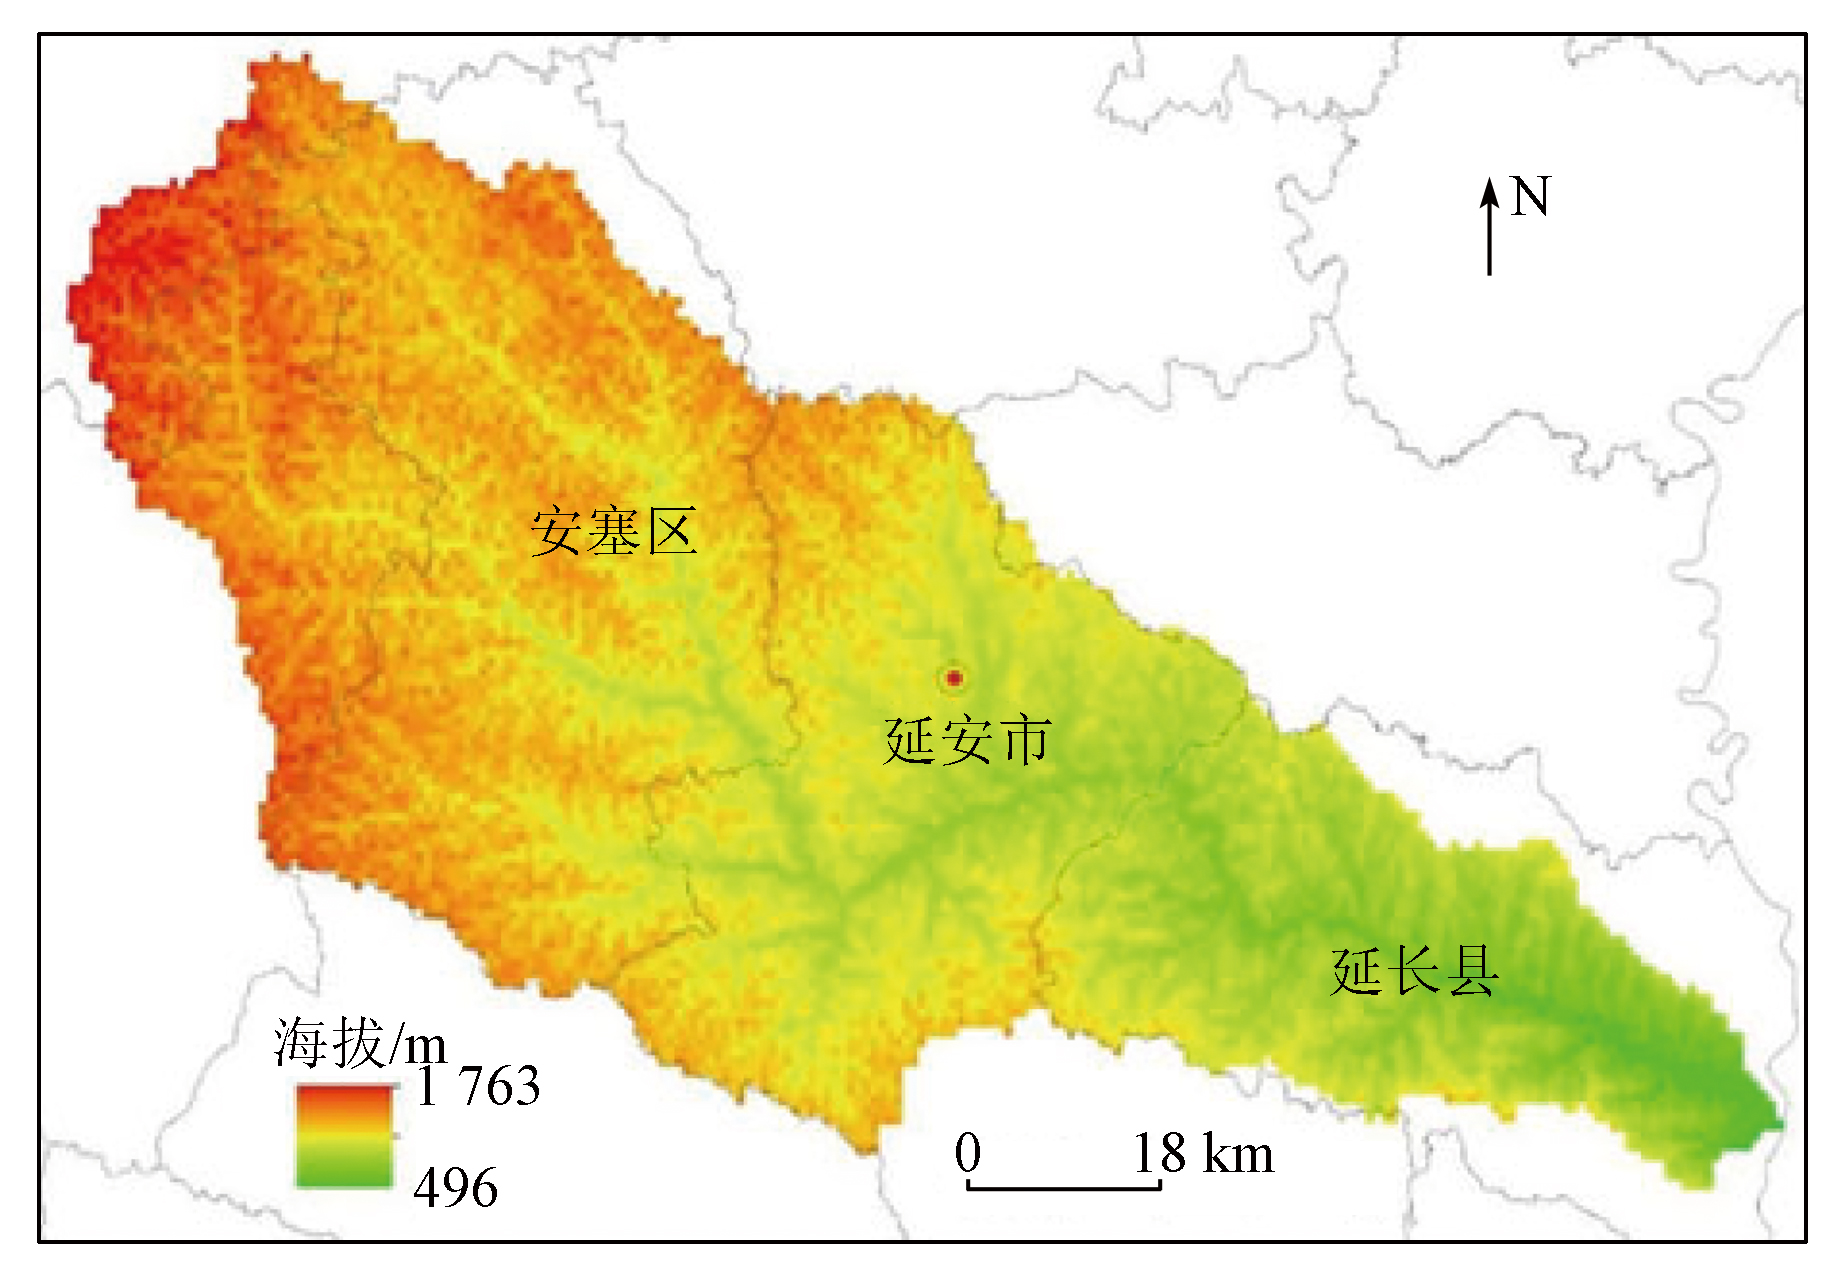
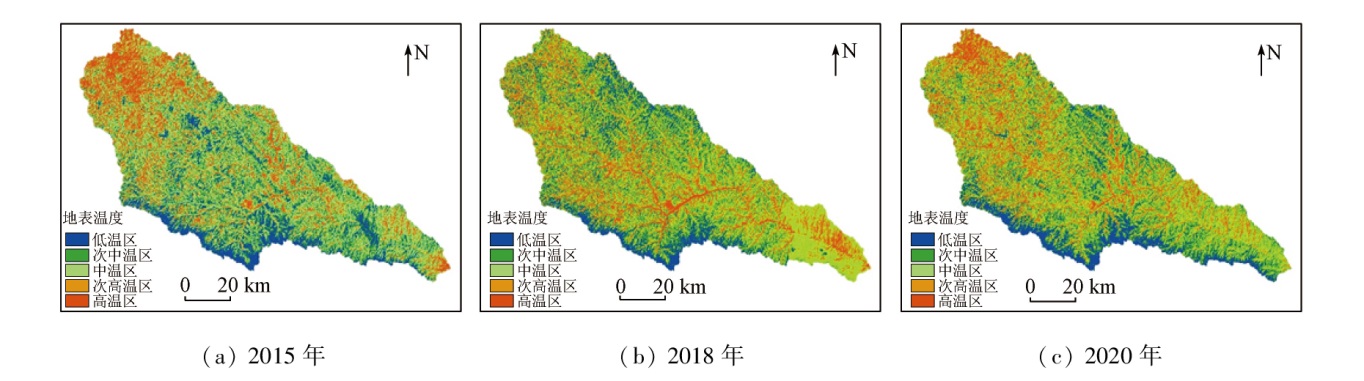
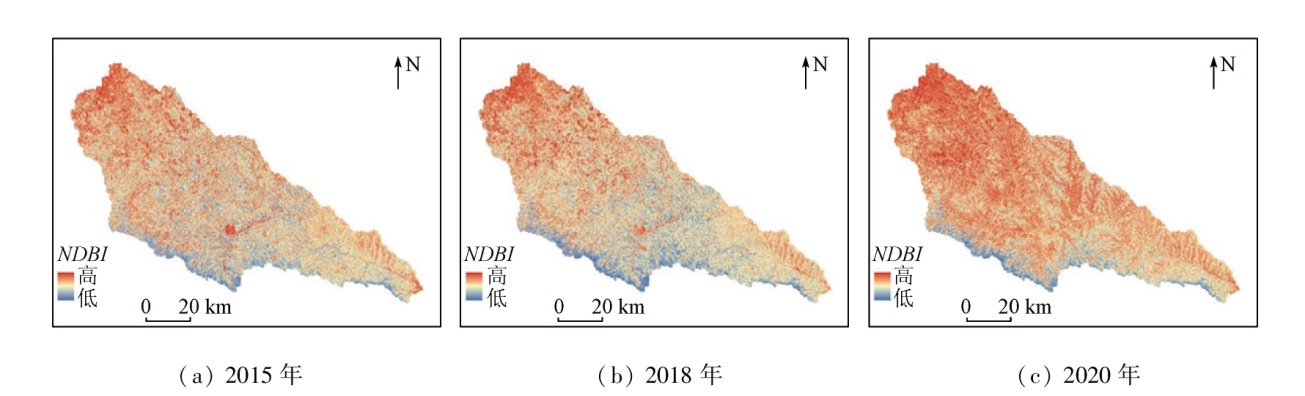
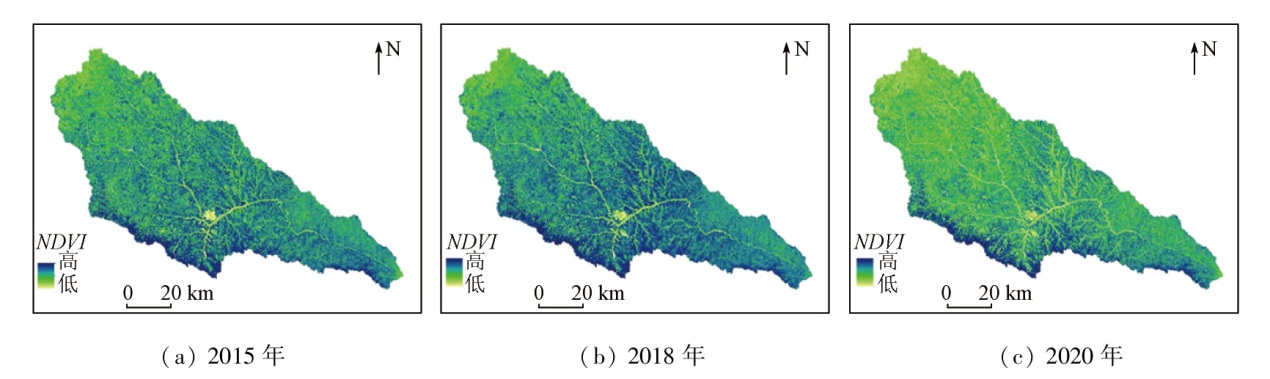
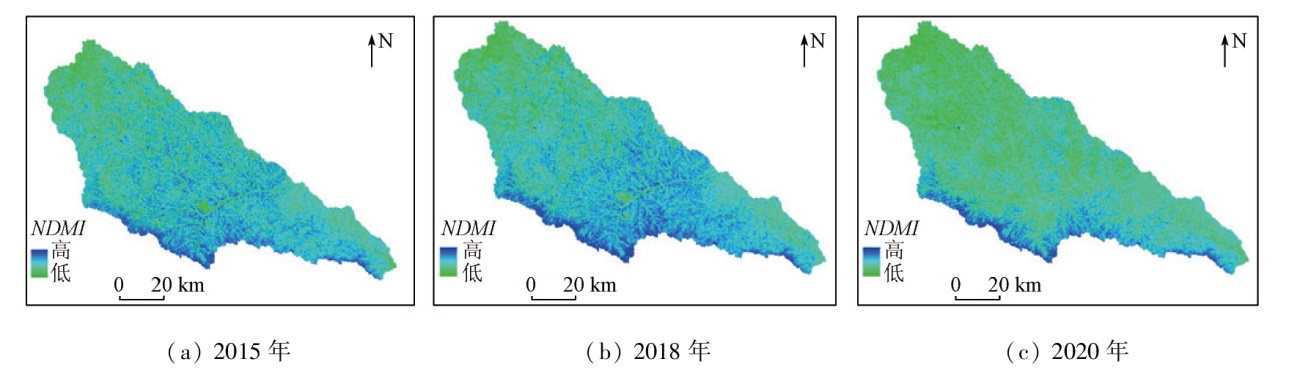
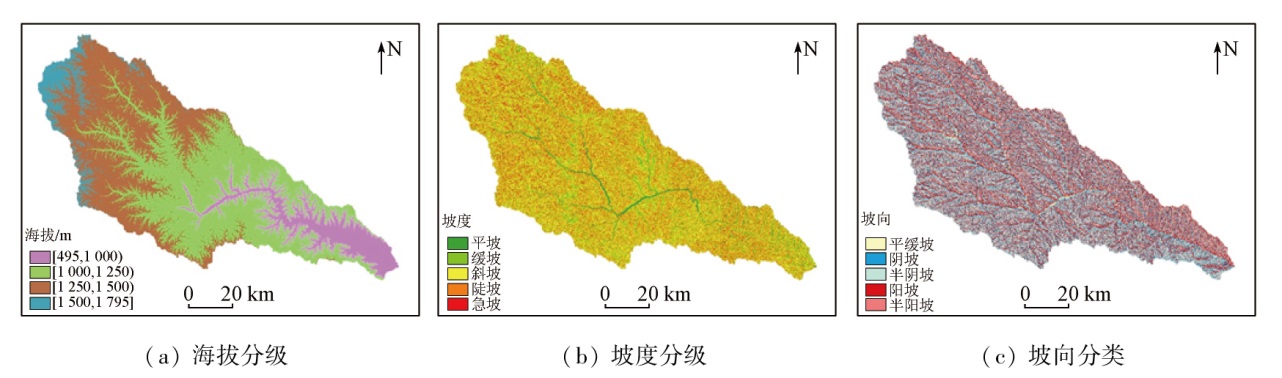
Abstract Surface temperature, a significant parameter of surface energy balance and land surface processes, is closely associated with the changes in surface parameters. With the Yanhe River basin in the Loess Plateau as a study area, this study derived the surface temperatures through inversion using the atmospheric correction method based on the Landsat OLI/TIRS images of 2015, 2018, and 2020. Moreover, by extracting the normalized difference build-up index (NDBI), normalized differential vegetation index (NDVI), and normalized difference moisture index (NDMI), this study analyzed the relationships of surface temperatures with surface parameters and land use types, as well as the spatio-temporal variations of surface temperatures. The results demonstrate that the correlation coefficients between the inverted and verified values of surface temperatures in 2015, 2018, and 2020 were 0.569, 0.675, and 0.632, respectively, all exceeding 0.5, suggesting certain accuracy and feasibility. Concerning the spatio-temporal variations of surface temperatures, the low-, sub-medium-, and sub-high-temperature zones exhibited decreased areas, whereas medium- and high-temperature zones manifested significantly and slightly increased areas, respectively, suggesting that the surface temperatures tended to increase towards medium and high temperatures. In terms of the relationship with land use types, the surface temperatures of underlying surface cover types increased in the order of water area, forest land, grassland, cultivated land, and construction land. The quantitative relationship reveals significant correlations between changes in surface temperatures and surface parameters of the Yanhe River basin. Specifically, the changes in surface temperatures were positively correlated with the NDBI but negatively correlated with the NDVI and the NDMI. From the perspective of geographical environment factors, surface temperatures decreased with increasing altitude. Different slopes exhibited distinct surface temperatures, which were the highest on flat slopes and lower on steeper slopes. Additionally, different slope aspects manifested significantly different surface temperatures, which were significantly higher on sunny slopes compared to shady slopes. The findings of this study will serve as a reference for exploring surface water thermal environments in complex areas.
|
| Keywords
surface temperature
remote sensing
temperature transfer matrix
correlation analysis
Yanhe River basin
|
|
|
|
Issue Date: 14 June 2024
|
|
|
| [1] |
Zhao L, Lee X, Schultz N M. A wedge strategy for mitigation of urban warming in future climate scenarios[J]. Atmospheric Chemistry and Physics, 2017, 17(14):9067-9080.
|
| [2] |
Chen Y Y, Duan S B, Ren H Z, et al. Algorithm development for land surface temperature retrieval:Application to Chinese Gaofen-5 data[J]. Remote Sensing, 2017, 9(2):161.
|
| [3] |
Jiang Y, Weng Q. Estimation of hourly and daily evapotranspiration and soil moisture using downscaled LST over various urban surfaces[J]. GIScience and Remote Sensing, 2017, 54(1):95-117.
|
| [4] |
Anderson M C, Norman J M, Kustas W P, et al. A thermal-based remote sensing technique for routine mapping of land-surface carbon,water and energy fluxes from field to regional scales[J]. Remote Sensing of Environment, 2008, 112(12):4227-4241.
|
| [5] |
Mia M B, Fujimitsu Y, Nishijima J. Monitoring of thermal activity at the Hatchobaru-Otake geothermal area in Japan using multi-Source satellite images:With comparisons of methods,and solar and seasonal effects[J]. Remote Sensing, 2018, 10(9):1430.
|
| [6] |
侯宇初, 张冬有. 基于Landsat8遥感影像的地表温度反演方法对比研究[J]. 中国农学通报, 2019, 35(10):142-147.
doi: 10.11924/j.issn.1000-6850.casb18120100
|
| [6] |
Hou Y C, Zhang D Y. Comparison study on land surface temperature retrieval algorithms based on Landsat8 remote sensing image[J]. Chinese Agricultural Science Bulletin, 2019, 35(10):142-147.
|
| [7] |
Jimenez-Munoz J C, Cristobal J, Sobrino J A, et al. Revision of the single-channel algorithm for land surface temperature retrieval from Landsat thermal-infrared data[J]. IEEE Transactions on Geoscience and Remote Sensing, 2009, 47(1):339-349.
|
| [8] |
Jin M J, Li J M, Wang C L, et al. A practical split-window algorithm for retrieving land surface temperature from Landsat8 data and a case study of an urban area in China[J]. Remote Sensing, 2015, 7(4):4371-4390.
|
| [9] |
Ren H Z, Du C, Liu R Y, et al. Atmospheric water vapor retrieval from Landsat8 thermal infrared images[J]. Journal of Geophysical Research:Atmospheres, 2015, 120(5):1723-1738.
|
| [10] |
Maulana J, Bioresita F. Monitoring of land surface temperature in Surabaya,Indonesia from 2013-2021 using Landsat8 imagery and Google Earth Engine[J]. IOP Conference Series:Earth and Environmental Science, 2023, 1127(1):012027.
|
| [11] |
Kimothi S, Thapliyal A, Gehlot A, et al. Spatio-temporal fluctuations analysis of land surface temperature (LST) using Remote Sensing data (LANDSAT TM5/8) and multifractal technique to characterize the urban heat Islands (UHIs)[J]. Sustainable Energy Technologies and Assessments, 2023, 55:102956
|
| [12] |
Galve J M, Sánchez J M, García-Santos V, et al. Assessment of land surface temperature estimates from Landsat8-TIRS in a high-contrast semiarid agroecosystem,algorithms intercomparison[J]. Remote Sensing, 2022, 14(8):1843.
|
| [13] |
Bradtke K. Landsat8 data as a source of high resolution sea surface temperature maps in the Baltic Sea[J]. Remote Sensing, 2021, 13(22):4619-4619.
|
| [14] |
Guha S, Govil H. Annual assessment on the relationship between land surface temperature and six remote sensing indices using Landsat data from 1988 to 2019[J]. Geocarto International, 2022, 37(15):4292-4311
|
| [15] |
Mallick J, Singh C K, Shashtri S, et al. Land surface emissivity retrieval based on moisture index from LANDSAT TM satellite data over heterogeneous surfaces of Delhi city[J]. International Journal of Applied Earth Observation and Geoinformation, 2012, 19:348-358.
|
| [16] |
Rehman A, Qin J, Pervez A, et al. Land-Use/Land Cover changes contribute to land surface temperature:A case study of the upper Indus basin of Pakistan[J]. Sustainability, 2022, 14(2):934.
|
| [17] |
钱乐祥, 丁圣彦. 珠江三角洲土地覆盖变化对地表温度的影响[J]. 地理学报, 2005, 60(5):761-770.
|
| [17] |
Qian L X, Ding S Y. Influence of land cover change on land surface temperature in Zhujiang delta[J]. Acta Geographica Sinica, 2005, 60(5):761-770.
doi: 10.11821/xb200505007
|
| [18] |
SimÓ G, García-Santos V, JimÉnez M A, et al. Landsat and local land surface temperatures in a heterogeneous terrain compared to MODIS values[J]. Remote Sensing, 2016, 8(10):849.
|
| [19] |
Peng X, Wu W, Zheng Y, et al. Correlation analysis of land surface temperature and topographic elements in Hangzhou,China[J]. Scientific Reports, 2020, 10:10451.
|
| [20] |
赵伟, 李爱农, 张正健, 等. 基于Landsat8热红外遥感数据的山地地表温度地形效应研究[J]. 遥感技术与应用, 2016, 31(1):63-73.
|
| [20] |
Zhao W, Li A N, Zhang Z J, et al. A study on land surface temperature terrain effect over mountainous area based on Landsat8 Thermal infrared data[J]. Remote Sensing Technology and Application, 2016, 31(1):63-73.
|
| [21] |
袁毓婕, 高学睿, 黄可静, 等. 基于RHESSys模型的延河流域水文要素定量模拟[J]. 南水北调与水利科技(中英文), 2023, 21(1):116-126.
|
| [21] |
Yuan Y J, Gao X R, Huang K J, et al. Quantitative simulation of hydrological elements based on RHESSys model in Yanhe River basin[J]. South-to-North Water Transfers and Water Science & Technology, 2023, 21(1):116-126.
|
| [22] |
韩磊, 朱会利, 刘钊. 延安市退耕还林前后土地利用动态变化分析[J]. 西北师范大学学报(自然科学版), 2017, 53(5):101-108.
|
| [22] |
Han L, Zhu H L, Liu Z. Analysis on land use dynamic changes of pre and post returning farmland to forestland in Yan’an City[J]. Journal of Northwest Normal University(Natural Science), 2017, 53(5):101-108.
|
| [23] |
刘强, 穆兴民, 赵广举, 等. 延河流域水沙变化及其对降水和土地利用变化的响应[J]. 干旱区资源与环境, 2021, 35(7):129-135.
|
| [23] |
Liu Q, Mu X M, Zhao G J, et al. Runoff and sediment changes and their responses to precipitation and land use change in the Yanhe river basin[J]. Journal of Arid Land Resources and Environment, 2021, 35(7):129-135.
|
| [24] |
吴志刚, 江滔, 樊艳磊, 等. 基于Landsat8数据的地表温度反演及分析研究——以武汉市为例[J]. 工程地球物理学报, 2016, 13(1):135-142.
|
| [24] |
Wu Z G, Jiang T, Fan Y L, et al. Land surface temperature retrieval and result analysis based on Landsat8 data in Wuhan City[J]. Chinese Journal of Engineering Geophysics, 2016, 13(1):135-142.
|
| [25] |
Zhong X, Zhao L H, Wang J, et al. A retrieval method for land surface temperatures based on UAV broadband thermal infrared images via the three-dimensional look-up table[J]. Building and Environment, 2022, 226:109793.
|
| [26] |
Qin Z, Karnieli A, Berliner P. A mono-window algorithm for retrieving land surface temperature from Landsat TM data and its application to the Israel-Egypt border region[J]. International Journal of Remote Sensing, 2001, 22(18):3719-3746.
|
| [27] |
Kachar H, Vafsian A R, Modiri M, et al. Evaluation of spatial and temporal distribution changes of LST using Landsat images (case study:Tehran)[J]. The International Archives of the Photogrammetry,Remote Sensing and Spatial Information Sciences, 2015, XL-1/W5:351-356.
|
| [28] |
刘思煜, 吴焱, 许娟, 等. 延安市地表热环境与下垫面指数的关系研究[J]. 西北林学院学报, 2022, 37(6):207-214+265.
|
| [28] |
Liu S Y, Wu Y, Xu J, et al. Relationship between surface thermal environment and underlying surface index in Yan’an City[J]. Journal of Northwest Forestry University, 2022, 37(6):207-214,265.
|
| [29] |
赵禾苗, 阿里木江·卡斯木. 基于地理探测器的喀什市地表热场空间分异及影响因素分析[J]. 生态与农村环境学报, 2022, 38(2):147-156.
|
| [29] |
Zhao H M, Alimujiang K. Analysis of spatial differentiation and influencing factors of surface thermal field in Kashgar City based on geographic detector[J]. Journal of Ecology and Rural Environment, 2022, 38(2):147-156.
|
| [30] |
Kuang W, Liu Y, Dou Y, et al. What are hot and what are not in an urban landscape:Quantifying and explaining the land surface temperature pattern in Beijing,China[J]. Landscape Ecology, 2015, 30(2):357-373.
|
| [31] |
查勇, 倪绍祥, 杨山. 一种利用TM图像自动提取城镇用地信息的有效方法[J]. 遥感学报, 2003, 7(1):37-40,82.
|
| [31] |
Zha Y, Ni S X, Yang S. An effective approach to automatically extract urban land-use from TM Imagery[J]. National Remote Sensing Bulletin, 2003, 7(1):37-40,82.
|
| [32] |
郭宇, 王宏伟, 张喆, 等. 南京市热环境与地表覆被的时空尺度效应及驱动机制研究[J]. 生态环境学报, 2020, 29(7):1403-1411.
doi: 10.16258/j.cnki.1674-5906.2020.07.015
|
| [32] |
Guo Y, Wang H W, Zhang Z, et al. Spatio-temporal scale effect and driving mechanism of thermal environment and land surface cover in Nanjing[J]. Ecology and Environmental Sciences, 2020, 29(7):1403-1411.
|
| [33] |
钱乐祥, 崔海山. 归一化水汽指数与地表温度的关系[J]. 地理研究, 2008, 27(6):1358-1366,1483.
|
| [33] |
Qian L X, Cui H S. Relationship between normalized difference moisture index and land surface temperature[J]. Geographical Research, 2008, 27(6):1358-1366,1483.
doi: 10.11821/yj2008060015
|
|
Viewed |
|
|
|
Full text
|
|
|
|
|
Abstract
|
|
|
|
|
Cited |
|
|
|
|
| |
Shared |
|
|
|
|
| |
Discussed |
|
|
|
|
 2024,
Vol. 36
2024,
Vol. 36
 ), SHI Haijing2(