Please wait a minute...
 
Remote Sensing for Natural Resources    2025, Vol. 37 Issue (5) : 243-253     DOI: 10.6046/zrzyyg.2024316
|
Dynamic monitoring and driving factor analysis for eco-environmental quality in alpine gorges of northwest Yunnan based on a remote sensing ecological index model
ZHANG Ping1(), PANG Yong1(), CHEN Qingsong1,2, YANG Kun1, ZOU Zujian1, HOU Yunhua1, WANG Caiqiong1, FENG Siqi1
1. Kunming Natural Resources Comprehensive Survey Center of China Geological Survey,Kunming 650100,China
2. Southwest Mountain Ecological Geological Evolution,Conservation and Restoration Innovation Base,Geological Society of China,Kunming 650100,China
Download: PDF(4356 KB)   HTML
Export: BibTeX | EndNote | Reference Manager | ProCite | RefWorks    
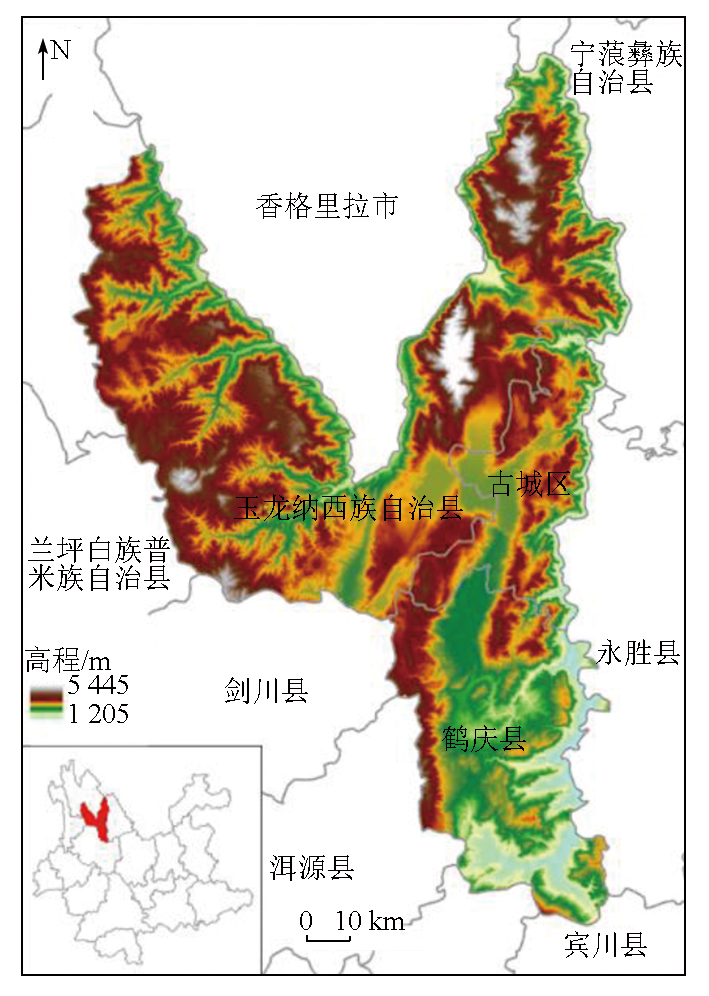
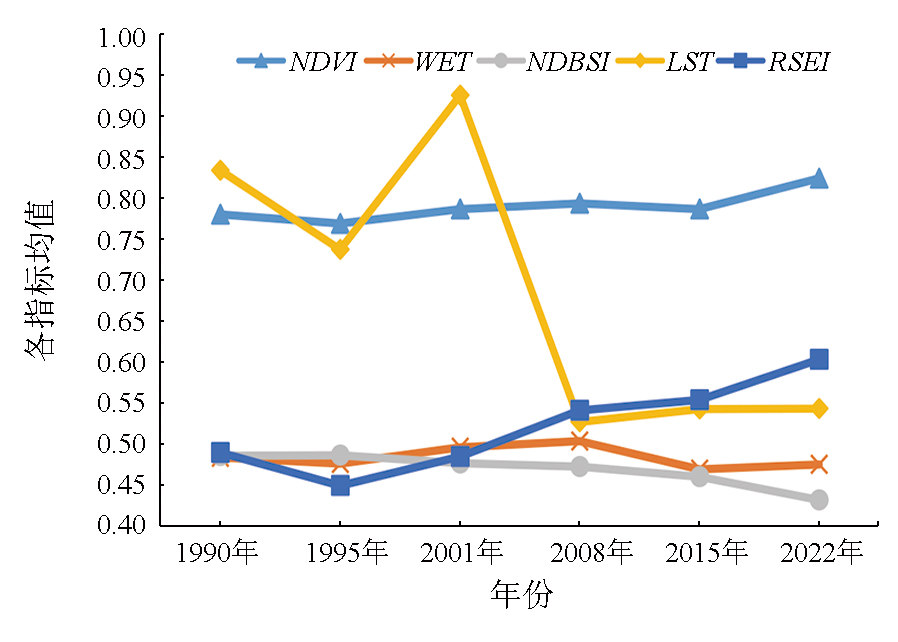
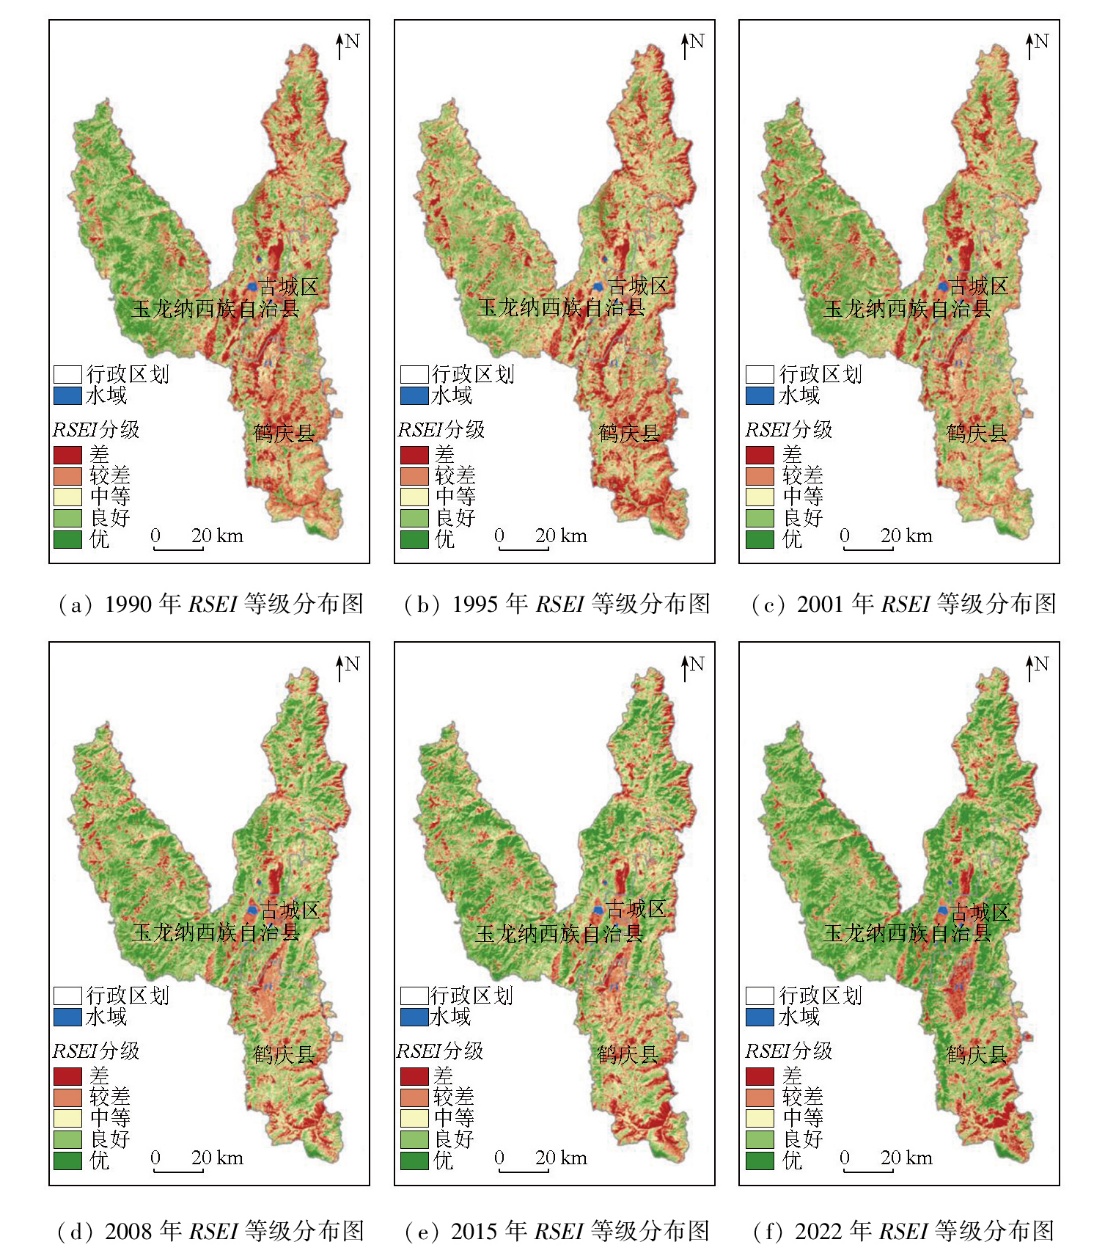
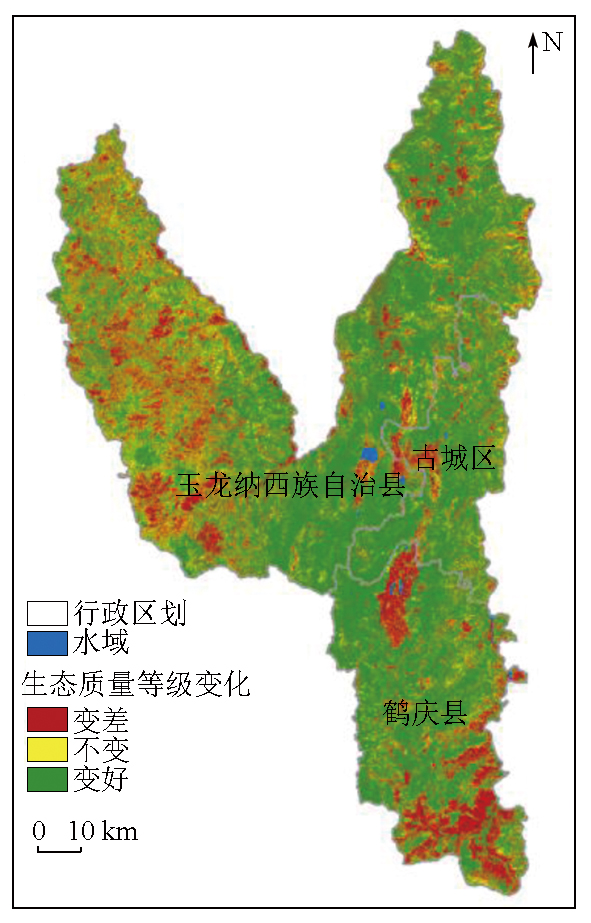
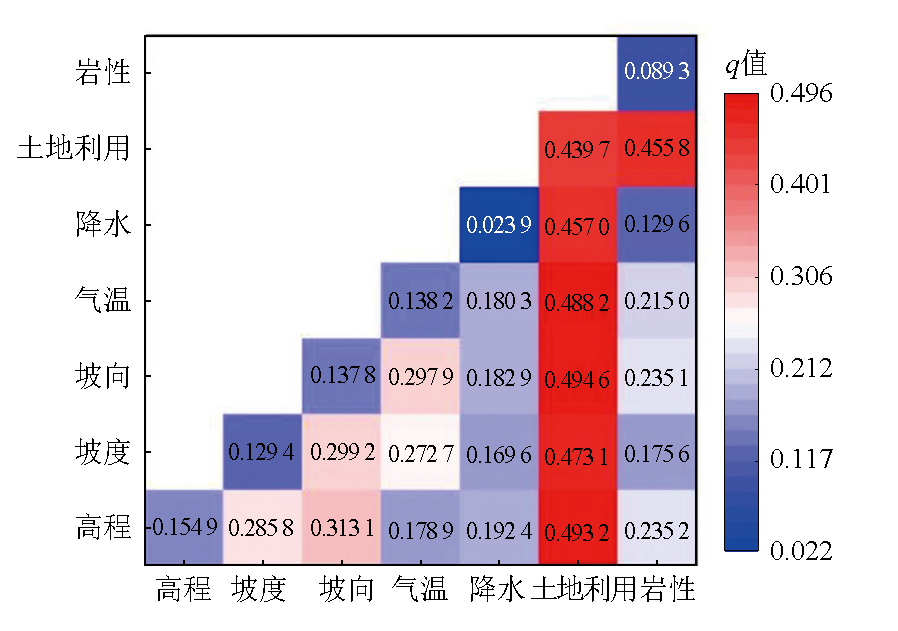
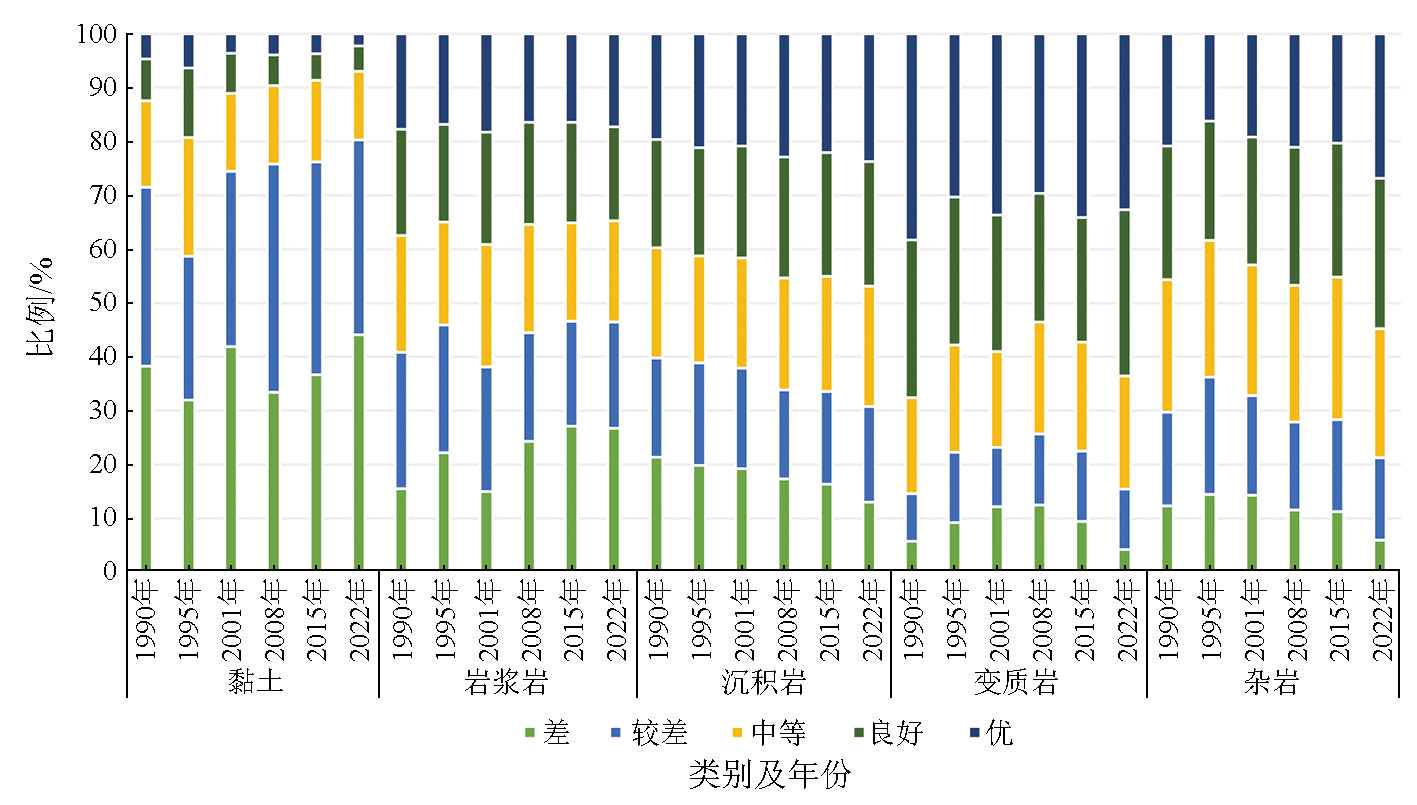
Abstract  

The alpine gorges in northwest Yunnan,important ecological reserves in China,are facing increasingly prominent environmental problems due to accelerated urbanization. Insights into the spatiotemporal changes in eco-environmental quality are of great significance for eco-environmental protection and construction in the alpine gorges of Northwest Yunnan. This study selected Landsat TM/OLI remote sensing images from 1990,1995,2001,2008,2015,and 2022 as the data source to extract four ecological indices:normalized difference vegetation Index (NDVI),wetness (WET),normalized difference bare soil index (NDBSI),and land surface temperature (LST). Consequently,a remote sensing ecological index (RSEI) was constructed to assess and monitor the eco-environmental quality of the alpine gorges in northwest Yunnan from 1990 to 2022. The results indicate that from 1990 to 2022,the average RSEI in the study area showed a trend of an initial decline followed by an increase. Specifically,the RSEI reached its lowest value of 0.450 in 1995 and then increased continuously from 0.450 in 1995 to 0.604 in 2022. Over this period,the proportion of areas with excellent and good eco-environmental quality increased by 22.03%,while those classified as poor and very poor eco-environmental quality decreased by 14.49%. These variations were predominantly composed of improvements,covering 62.42% of the study area. Spatially,areas with very poor quality were primarily concentrated in agricultural areas,urban construction land,along the Jinsha River,low-altitude areas with sparse vegetation,and the slopes of landform intermontane basins (Bazi) in Heqing County. In contrast,areas with excellent quality were mainly distributed in high-altitude mountainous regions characterized by lush vegetation and minimal human disturbance. Moreover,the land use type was identified as the main driving factor influencing the eco-environmental quality in the study area. The strongest interaction was observed between elevation (X1) and land use (X6),exerting the greatest impacts on eco-environmental quality in the study area. Besides,areas with clay soils were dominated by poor and very poor quality. The magmatic rock areas displayed a clear trend of ecological deterioration,while the sedimentary rock area presented significant improvements. Conversely,the metamorphic and complex rock areas maintained relative stability.

Keywords eco-environmental quality      remote sensing ecological index (RESI)      geodetector      driving factor      alpine gorge in northwest Yunnan     
ZTFLH:  TP79  
Issue Date: 28 October 2025
Service
E-mail this article
E-mail Alert
RSS
Articles by authors
Ping ZHANG
Yong PANG
Qingsong CHEN
Kun YANG
Zujian ZOU
Yunhua HOU
Caiqiong WANG
Siqi FENG
Cite this article:   
Ping ZHANG,Yong PANG,Qingsong CHEN, et al. Dynamic monitoring and driving factor analysis for eco-environmental quality in alpine gorges of northwest Yunnan based on a remote sensing ecological index model[J]. Remote Sensing for Natural Resources, 2025, 37(5): 243-253.
URL:  
https://www.gtzyyg.com/EN/10.6046/zrzyyg.2024316     OR     https://www.gtzyyg.com/EN/Y2025/V37/I5/243
Fig.1  Location map of the research area
数据类型 数据时期 分辨率/m 数据来源
年均降水量 1990—2022年 1 000 国家地球系统科学数据中心(https://www.geodata.cn)
年均气温 1990—2022年 1 000 国家地球系统科学数据中心(https://www.geodata.cn)
高程 2019年 30 欧洲航天局(European Space Agency,ESA)
坡度 30 由DEM提取得到
坡向 30 由DEM提取得到
土地利用 1990—2022年 30 https://zenodo.org/
1∶25万
地质图
云南省测绘资料档案馆(云南省基础地理信息中心)
Tab.1  Data type and source
年份 指标 NDVI WET NDBSI LST 特征值 贡献率/%
1990年 PC1 -0.733 019 -0.675 479 0.080 012 -0.002 920 0.017 3 76.24
PC2 -0.268 505 0.183 089 -0.904 060 0.277 595 0.003 9 17.05
PC3 0.622 254 -0.713 416 -0.321 146 0.026 516 0.001 4 6.11
PC4 0.058 204 -0.035 280 0.270 440 0.960 328 0.000 1 0.60
1995年 PC1 -0.693 931 -0.704 739 0.143 292 -0.035 632 0.019 4 65.37
PC2 -0.251 984 0.124 664 -0.389 030 0.877 279 0.005 9 19.79
PC3 0.626 182 -0.691 483 -0.336 319 0.128 981 0.003 6 12.25
PC4 0.250 717 -0.098 249 0.845 584 0.460 951 0.000 8 2.59
2001年 PC1 -0.716 393 -0.691 728 0.088 302 0.022 252 0.015 9 77.99
PC2 -0.271 631 0.178 840 -0.886 031 0.330 426 0.003 2 15.70
PC3 0.638 512 -0.699 655 -0.315 282 0.058 156 0.001 1 5.52
PC4 0.072 801 -0.003 198 0.328 250 0.941 776 0.000 2 0.79
2008年 PC1 0.621 550 0.463 497 -0.630 783 -0.030 969 0.020 7 66.68
PC2 0.257 623 -0.146 374 0.099 662 0.949 880 0.006 0 19.23
PC3 -0.530 956 -0.318 177 -0.765 585 0.175 300 0.003 8 12.29
PC4 -0.515 162 0.813 946 0.077 846 0.256 980 0.000 6 1.80
2015年 PC1 0.624 463 0.641 042 -0.443 251 0.051 381 0.020 8 65.23
PC2 0.177 633 -0.089 233 0.231 590 0.952 287 0.007 4 23.14
PC3 -0.473 379 -0.132 025 -0.825 767 0.276 751 0.003 4 10.57
PC4 -0.595 319 0.750 781 0.260 776 0.117 979 0.000 3 1.06
2022年 PC1 0.707 173 0.407 722 -0.577 196 0.022 692 0.019 9 68.28
PC2 0.155 665 -0.032 550 0.205 687 0.965 609 0.005 8 19.96
PC3 -0.522 730 -0.220 301 -0.786 452 0.244 367 0.003 2 11.09
PC4 -0.449 921 0.885 534 0.077 664 0.085 839 0.000 2 0.67
Tab.2  Principal component loadings and contribution rates of various ecological indicators in different years
Fig.2  Mean of single indicator and RSEI from 1990 to 2022
RSEI 1990年 1995年 2001年 2008年 2015年 2022年
面积/km2 占比/% 面积/km2 占比/% 面积/km2 占比/% 面积/km2 占比/% 面积/km2 占比/%/ 面积/km2 占比/%
1 449.33 14.75 1 726.05 17.57 1 313.17 13.37 852.63 8.68 880.38 8.96 825.95 8.41
较差 2 274.26 23.15 2 340.74 23.83 2 121.28 21.60 1 792.07 18.24 1 923.64 19.58 1 474.42 15.01
中等 2 391.87 24.35 2 733.98 27.83 2 437.65 24.82 2 369.45 24.12 2 359.77 24.02 1 651.31 16.81
良好 2 367.18 24.10 2 428.64 24.72 2 838.56 28.90 3 243.93 33.02 2 970.30 30.24 3 205.67 32.63
1 340.19 13.64 593.43 6.04 1 112.18 11.32 1 564.75 15.93 1 688.75 17.19 2 665.49 27.14
Tab.3  Statistics of area and proportion of different ecological environment quality grades in the study area from 1990 to 2022
Fig.3  Distribution of ecological environment quality levels in the study area from 1990 to 2022
时间 类别 情况 级差 级面积/km2 占比/% 类面积/km2 占比/%
1990—1995年 变差 显著变差 -3 374.94 3.82 4 502.79 45.84
明显变差 -2 1 189.09 12.11
略微变差 -1 2 938.76 29.92
不变 无明显变化 0 3 292.22 33.52 3 292.22 33.52
变好 略微变好 1 1 356.62 13.81 2 027.83 20.64
明显变好 2 480.61 4.89
显著变好 3 190.60 1.94
时间 类别 情况 级差 级面积/km2 占比/% 类面积/km2 占比/%
1995—2001年 变差 显著变差 -3 215.70 2.20 1 787.01 18.19
明显变差 -2 492.72 5.02
略微变差 -1 1 078.59 10.98
不变 无明显变化 0 2 975.98 30.30 2 975.98 30.30
变好 略微变好 1 3 188.69 32.46 5 059.85 51.51
明显变好 2 1 576.49 16.05
显著变好 3 294.67 3.00
2001—2008年 变差 显著变差 -3 106.47 1.08 2 060.14 20.97
明显变差 -2 466.05 4.74
略微变差 -1 1 487.62 15.14
不变 无明显变化 0 2 888.91 29.41 2 888.91 29.41
变好 略微变好 1 2 846.38 28.98 4 873.79 49.62
明显变好 2 1 621.02 16.50
显著变好 3 406.40 4.14
2008—2015年 变差 显著变差 -3 153.69 1.56 2 328.07 23.70
明显变差 -2 422.85 4.30
略微变差 -1 1 751.52 17.83
不变 无明显变化 0 5 000.81 50.91 5 000.81 50.91
变好 略微变好 1 2 120.45 21.59 2 493.96 25.39
明显变好 2 326.11 3.32
显著变好 3 47.40 0.48
2015—2022年 变差 显著变差 -3 100.56 1.02 1 299.58 13.23
明显变差 -2 290.16 2.95
略微变差 -1 908.86 9.25
不变 无明显变化 0 3 108.71 31.65 3 108.71 31.65
变好 略微变好 1 3 887.83 39.58 5 414.54 55.12
明显变好 2 1 417.94 14.44
显著变好 3 108.77 1.11
Tab.4  Statistical table of changes in ecological environment quality in various periods of the study area
Fig.4  Monitoring of RSEI changes in alpine mountain canyon area of Northwest Yunnan from 1990 to 2022
驱动因子 1990年 1995年 2001年 2008年 2015年 2022年 1990—2022
年平均值
q 排序 q 排序 q 排序 q 排序 q 排序 q 排序 q 排序
高程 0.125 8 3 0.113 7 2 0.088 8 3 0.166 7 3 0.197 6 3 0.236 5 2 0.154 9 2
坡度 0.129 3 2 0.064 5 5 0.120 6 2 0.131 3 5 0.146 0 5 0.184 6 4 0.129 4 5
坡向 0.085 7 6 0.105 0 4 0.086 6 4 0.197 7 2 0.218 9 2 0.132 8 6 0.137 8 4
气温 0.120 2 4 0.109 9 3 0.074 4 5 0.141 7 4 0.180 5 4 0.202 2 3 0.138 2 3
降水 0.016 8 7 0.011 7 7 0.017 9 7 0.017 3 7 0.041 8 7 0.038 0 7 0.023 9 7
土地利用 0.398 5 1 0.339 4 1 0.387 9 1 0.486 5 1 0.470 5 1 0.555 4 1 0.439 7 1
岩性 0.086 6 5 0.035 8 6 0.070 7 6 0.083 7 6 0.102 4 6 0.156 8 5 0.089 3 6
Tab.5  Results of factor detection in different periods of the study area
Fig.5  Results of factor interaction detection
Fig.6  Spatial distribution of ecological environment quality in different geological units in different years
岩性 恶化 不变 改善
黏土 19.24 10.17 6.32
岩浆岩 24.24 19.17 18.46
沉积岩 40.61 49.75 62.47
变质岩 12.83 17.77 9.70
杂岩 1.86 2.48 2.88
Tab.6  Changes in ecological environment quality of different lithologies in the study area from 1990 to 2022 (%)
地层单元 恶化 不变 改善
新生界 第四系 19.22 10.16 6.33
新近系 0.05 0.07 0.08
古近系 18.90 17.58 10.32
中生界 白垩系 0.22 0.16 0.34
三叠系 15.63 24.31 42.93
古生界 二叠系 19.30 14.78 17.10
石炭系 0.86 1.16 0.94
泥盆系 2.72 3.29 4.01
志留系 0.51 0.64 0.77
奥陶系 0.53 0.56 0.37
新元古界 5.16 6.55 4.13
古元古界 7.37 10.86 5.36
Tab.7  Changes in ecological environment quality of different stratigraphic units in the study area from 1990 to 2022 (%)
[1] 徐燕, 周华荣. 初论我国生态环境质量评价研究进展[J]. 干旱区地理, 2003, 26(2):166-172.
[1] Xu Y, Zhou H R. Preliminary discussion on the research progress of ecological environment quality assessment in China[J]. Arid Land Geography, 2003, 26(2):166-172.
[2] 田佳良. 区域生态环境质量评价研究综述[J]. 环境保护与循环经济, 2013, 33(11):63-66.
[2] Tian J L. A review of research on regional ecological environment quality assessment[J]. Environmental Protection and Circular Economy, 2013, 33 (11):63-66.
[3] Geng J W, Yu K Y, Xie Z, et al. Analysis of spatio-temporal variation and drivers of ecological quality in Fuzhou based on RSEI[J]. Remote Sensing, 2022, 14(19):4900.
[4] 潘明慧, 袁轶男, 王亚蕾, 等. 基于 RSEI 的福州旗山国家森林公园生态环境质量变化研究[J]. 山东农业大学学报(自然科学版), 2020, 51(1):57-63.
[4] Pan M H, Yuan Y N, Wang Y L, et al. Research on the changes in ecological environment quality of Qishan National Forest Park in Fuzhou based on RSEI[J]. Journal of Shandong Agricultural University(Natural Science Edition), 2020, 51 (1):57-63.
[5] 范雅慧, 刘英, 衡文静, 等. 基于遥感生态指数的神东矿区 1990—2022 年煤炭开采对生态环境的影响分析[J]. 绿色矿山, 2024, 2(1):41-53.
[5] Fan Y H, Liu Y, Heng W J, et al. Analysis of the impact of coal mining on the ecological environment in Shendong mining area from 1990 to 2022 based on remote sensing ecological index[J]. Journal of Green Mine, 2024, 2 (1):41-53.
[6] Jing Y, Zhang F, He Y, et al. Assessment of spatial and temporal variation of ecological environment quality in Ebinur Lake Wetland National Nature Reserve,Xinjiang,China[J]. Ecological Indicators, 2020, 110:105874.
[7] 杨泽康, 田佳, 李万源, 等. 黄河流域生态环境质量时空格局与演变趋势[J]. 生态学报, 2021, 41(19):7627-7636.
[7] Yang Z K, Tian J, Li W Y, et al. The spatiotemporal pattern and evolution trend of ecological environment quality in the Yellow River basin[J]. Acta Ecologica Sinica, 2021, 41 (19):7627-7636.
[8] 李应鑫, 李石华, 彭双云. 云南省九大高原湖泊流域 NDVI 时空演变及其与气候的响应关系[J]. 水土保持研究, 2020, 27(4):192-200.
[8] Li Y X, Li S H, Peng S Y. The spatiotemporal evolution of NDVI in the nine major plateau lake basins in Yunnan Province and its res-ponse to climate[J]. Research of Soil and Water Conservation, 2020, 27 (4):192-200.
[9] 温旭丁, 罗赵慧, 符良刚. 气候与土地利用变化对粤港澳大湾区增强型植被指数时空变化影响[J]. 生态科学, 2023, 42(6):222-232.
[9] Wen X D, Luo Z H, Fu L G. The impact of climate and land use change on the spatiotemporal changes of enhanced vegetation index in the Guangdong Hong Kong Macao Greater Bay Area[J]. Ecological Science, 2023, 42 (6):222-232.
[10] 伍明飞, 林杰. 基于 Landsat 影像的杭州市主城区地表温度和热岛效应研究[J]. 科学技术与工程, 2022, 22(24):10812-10817.
[10] Wu M F, Lin J. Research on surface temperature and heat island effect in the main urban area of Hangzhou City based on landsat images[J]. Science Technology and Engineering, 2022, 22 (24):10812-10817.
[11] 徐尚昭, 陈斌, 周阳阳, 等. 矿区植被覆盖度时空变化遥感监测研究——以广东省大宝山矿区为例[J]. 安徽农业科学, 2023, 51(5):46-50.
[11] Xu S Z, Chen B, Zhou Y Y, et al. Research on remote sensing monitoring of spatiotemporal changes in vegetation coverage in mining areas:A case study of Dabaoshan mining area in Guangdong Province[J]. Journal of Anhui Agricultural Sciences, 2023, 51 (5):46-50.
[12] 徐涵秋. 城市遥感生态指数的创建及其应用[J]. 生态学报, 2013, 33(24):7853-7862.
[12] Xu H Q. Creation and application of urban remote sensing ecological index[J]. Acta Ecologica Sinica, 2013, 33 (24):7853-7862.
[13] 程琳琳, 王振威, 田素锋, 等. 基于改进的遥感生态指数的北京市门头沟区生态环境质量评价[J]. 生态学杂志, 2021, 40(4):1177-1185.
[13] Cheng L L, Wang Z W, Tian S F, et al. Ecological environment quality evaluation of Mentougou District,Beijing based on improved remote sensing ecological index[J]. Chinese Journal of Ecology, 2021, 40 (4):1177-1185.
[14] Liu Q, Yu F H, Mu X M. Evaluation of the ecological environment quality of the Kuye River source basin using the remote sensing eco-logical index[J]. International Journal of Environmental Research and Public Health, 2022, 19(19):12500.
[15] Baig M H A, Zhang L F, Shuai T, et al. Derivation of atasselled cap transformation based on Landsat-8 satellite reflectance[J]. Remote Sensing Letters, 2014, 5(5):423-431.
[16] Crist E P. A TM tasseled cap equivalent transformationfor reflectance factor data[J]. Remote Sensing of Environment, 1985, 17(3):301-306.
[17] 林雪, 季建万, 沙晋明. 大田县近22a环境变化遥感监测研究[J]. 福建师范大学学报(自然科学版), 2018, 34(5):24-31.
[17] Lin X, Ji J W, Sha J M. Research on remote sensing monitoring of environmental changes in Datian County over the past 22 years[J]. Journal of Fujian Normal University(Natural Science Edition), 2018, 34 (5):24-31.
[18] 徐涵秋. 水土流失区生态变化的遥感评估[J]. 农业工程学报, 2013, 29(7):91-97,294.
[18] Xu H Q. Remote sensing assessment of ecological changes in soil erosion areas[J]. Transactions of the Chinese Society of Agricultural Engineering, 2013, 29 (7):91-97,294.
[19] Janet N. Remote sensing of urban heat island by day and night[J]. Photogrammetric Engineering and Remote Sensing, 2005, 71(5):613-621.
[20] Chander G, Markham B L, Helder D L. Summary of current radiometric calibration coefficients for Landsat MSS,TM,ETM+,and EO-1 ALI sensors[J]. Remote Sensing of Environment, 2009, 113(5):893-903.
[21] Yu X, Guo X, Wu Z. Land surface temperature retrieval from Landsat 8 TIRS-comparison between radiative transfer equation-based method,split window algorithm and single channel method[J]. Remote Sensing, 2014, 6(10):9829-9852.
[22] Sobrino J A, Jimenez-munoz J C, Paolini L. Land surface retrieval from Landsat TM5[J]. Remote Sensing of Environment, 2004, 90(4):434-440.
[23] 王劲峰, 徐成东. 地理探测器:原理与展望[J]. 地理学报, 2017, 72(1):116-134.
doi: 10.11821/dlxb201701010
[23] Wang J F, Xu C D. Geographic detector:Principles and prospects[J]. Acta Geographica Sinica, 2017, 72 (1):116-134.
[24] 中华人民共和国环境保护部. 生态环境状况评价技术规范:HJ 192—2015[S]. 北京: 中国环境科学出版社, 2015.
[24] Ministry of Environmental Protection of the People’s Republic of China. Technical specification for ecological environment assessment:HJ 192—2015[S]. Beijing: China Environmental Science Press, 2015.
[1] MA Maonan, CHANG Liang, YU Guoqiang, ZHOU Jianwei, HAN Haihui, ZHANG Qunhui, CHEN Xiaoyan, DU Chao. Spatiotemporal changes in land use and their driving factors in the Golmud River basin from 1980 to 2020[J]. Remote Sensing for Natural Resources, 2025, 37(4): 184-193.
[2] WANG Yuanyuan, ZANG Xiechao, XU Weiwei, YANG Changxia, JIN Yang, REN Jinghua, HE Xinxing. SRP model-based assessment and analysis of ecological vulnerability in the Yangtze River economic belt within Jiangsu Province[J]. Remote Sensing for Natural Resources, 2025, 37(3): 170-182.
[3] AO Yong, WANG Ya, WANG Xiaofeng, WU Jingsheng, ZHANG Yiheng, LI Xuejiao. Spatiotemporal changes of ecological quality and their driving factors in Zhengzhou City over the last 20 years[J]. Remote Sensing for Natural Resources, 2025, 37(1): 102-112.
[4] LU Junjing, SUN Leigang, ZUO Lu, LIU Jianfeng, MA Xiaoqian, HAO Qingtao. A functional zoning-based study of the spatiotemporal evolutionary characteristics and influencing factors of vegetation fractional cover in the Beijing-Tianjin-Hebei region[J]. Remote Sensing for Natural Resources, 2024, 36(4): 242-253.
[5] ZHAO Hairong, MO Hongwei. Dynamic and natural driving factors of vegetation carbon sink in Hunan Province[J]. Remote Sensing for Natural Resources, 2024, 36(4): 304-313.
[6] SU Yue, LIU Hong, YANG Wunian, OUYANG Yuan, ZHANG Jinghua, ZHANG Tengjiao, HUANG Yong. Ecological vulnerability of highland mountain areas:A case study of Kangding City, Sichuan Province[J]. Remote Sensing for Natural Resources, 2024, 36(3): 206-215.
[7] YUAN Na, LIU Suihua, HU Haitao, YIN Xia, SONG Shanhai. Spatio-temporal variations and influencing factors of the stable forest land surface albedo in southeastern Guizhou Province[J]. Remote Sensing for Natural Resources, 2024, 36(1): 200-209.
[8] LIU Xiaomin, AMUGULENG , YANG Yaotian, LIU Yong. Ecological security evaluation of counties/banners in the Yellow River basin in Ordos[J]. Remote Sensing for Natural Resources, 2023, 35(4): 139-148.
[9] ZHI Lu, HU Tao, ZOU Bin, LI Haosheng, ZHAO Yongqiang. Spatio-temporal differentiation of vegetation net primary productivity in Henan Province as well as its driving factors[J]. Remote Sensing for Natural Resources, 2023, 35(4): 169-177.
[10] CUI Dunyue, WANG Shidong, ZHANG Xuejun. A remote sensing-based study on change in land use and vegetation cover in Xiong’an New Area from 1991 to 2021[J]. Remote Sensing for Natural Resources, 2023, 35(4): 214-225.
[11] WANG Yelan, YANG Xin, HAO Lina. Spatio-temporal changes in the normalized difference vegetation index of vegetation in the western Sichuan Plateau during 2001—2021 and their driving factors[J]. Remote Sensing for Natural Resources, 2023, 35(3): 212-220.
[12] HU Xiaoqiang, YANG Shuwen, YAN Heng, XUE Qing, ZHANG Naixin. Time-series InSAR-based monitoring and analysis of surface deformation in the Axi mining area, Xinjiang[J]. Remote Sensing for Natural Resources, 2023, 35(1): 171-179.
[13] LIN Xuemin, LI Weifeng, WANG Hong, MING Dongping, HAN Lijian. Analysis of the groundwater storage variations and their driving factors in the three eastern coastal urban agglomerations of China[J]. Remote Sensing for Natural Resources, 2022, 34(4): 262-271.
[14] ZHU Sijia, FENG Huihui, ZOU Bin, YE Shuchao. Spatial-temporal characteristics of 2000—2019 vegetation NPP of the Dongting Lake basin and their driving factors[J]. Remote Sensing for Natural Resources, 2022, 34(3): 196-206.
[15] LI Jingzhi, WANG Miao, FENG Wenjing, LI Bin. The characteristics and driving factors of spatiotemporal changes in the ecosystem service value in Xiangxi, Hunan, China[J]. Remote Sensing for Natural Resources, 2022, 34(3): 207-217.
Viewed
Full text


Abstract

Cited

  Shared   
  Discussed   
京ICP备05055290号-2
Copyright © 2017 Remote Sensing for Natural Resources
Support by Beijing Magtech