|
|
 |
|

|
|
|
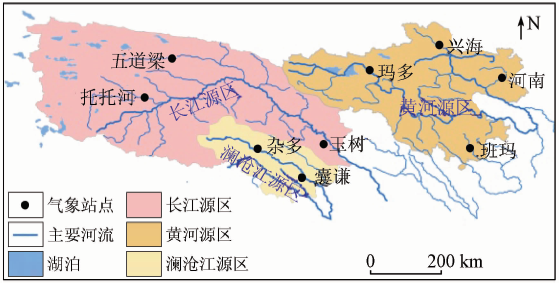
NDVI changes and its correlation with climate factors of the Three River-Headwater region in growing seasons during 2000—2016 |
Jiaxin XU1,2, Shibo FANG2, Tingbin ZHANG1,3, Yongchao ZHU2, Dong WU2, Guihua YI4( ) ) |
1. College of Earth Science, Chengdu University of Technology, Chengdu 610059, China
2. Institute of Ecoenvironment and Agrometeorology, Chinese Academy of Meteorological Sciences, Beijing 100081, China
3. College of the Engineering and Technical, Chengdu University of Technology, Leshan 614000, China
4. College of Management Science, Chengdu University of Technology, Chengdu 610059, China |
|
|
|
|
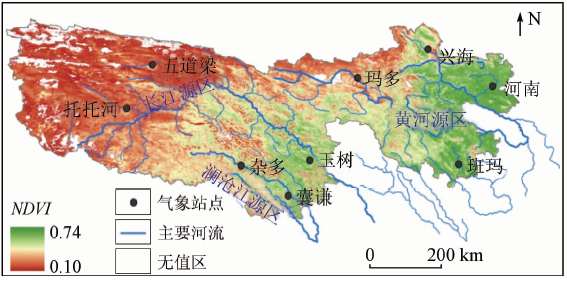
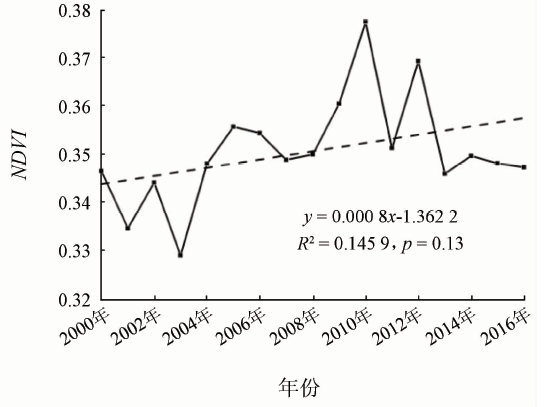
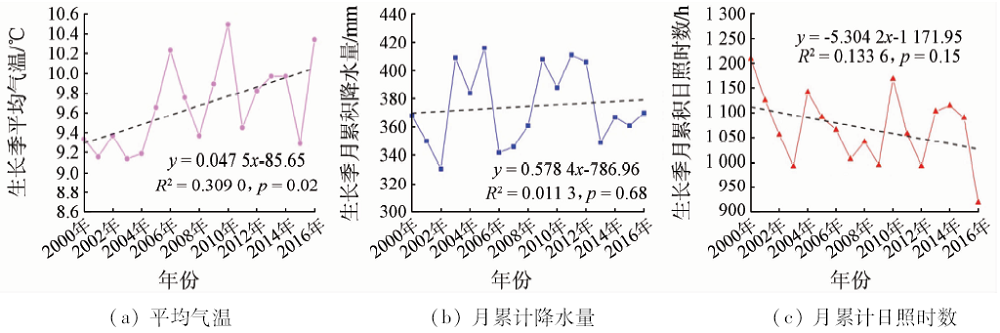
Abstract The correlation analysis between climatic factors and vegetation indexes can not only reflect the impact of climate change on vegetation but also predict the trend of vegetation in the future. Based on the data of MODIS13A1 C6 NDVI of the Three River headwater region and combined with 1∶1 000 000 map of vegetation types and meteorological data, the authors analyzed spatial-temporal characteristics of NDVI and the relationship between vegetation indexes and climatic factors by using correlation analysis from 2000 to 2016. The results are as follows: ① NDVI increased with a rate of 0.8%/10a in Three River headwater region during 2000—2016, whereas vegetation cover increased from the northwest to southeast. ② Climate factors had a greater influence on vegetation growth in the early and middle growing season, but the correlation between NDVI and climate factors was not obvious in the later growing season. ③ The partial correlation between NDVI and climate factors in the vegetation growing season of the study area showed that the influence of the air temperature on NDVI of the alpine meadow grasslands and alpine grasslands was greater than that of precipitation in the early growing season. However, during the middle of the growing season, the precipitation had a greater impact on the growth of three different types of vegetation.
|
| Keywords
NDVI
climatic factors
related analysis
Three River headwater region
|
|
|
|
Corresponding Authors:
Guihua YI
E-mail: yigh@cdut.edu.cn
|
|
Issue Date: 14 March 2020
|
|
|
| [1] |
Pettorelli N, Vik J, Mysterud A , et al. Using the satellite-derived NDVI to assess ecological response to environmental change[J]. Trends in Ecology and Evolution, 2005,20(9):503-510.
|
| [2] |
孙红雨, 王常耀, 牛铮 , 等. 中国地表植被覆盖变化及其与气候因子关系——基于NOAA时间序列数据[J]. 遥感学报, 1998,2(3):204-210.
|
| [2] |
Sun H Y, Wang C Y, Niu Z , et al. Analysis of the vegetation cover change and the relationship between NDVI and environmental factors by using NOAA time series data[J]. Journal of Remote Sensing, 1998,2(3):204-210.
|
| [3] |
Bounoua L, Collatz G J, Los S O , et al. Sensitivity of climate to changes in NDVI[J]. Journal of Climate, 2000,13(13):2277-2292.
|
| [4] |
李本纲, 陶澍 . AVHRR NDVI与气候因子的相关分析[J]. 生态学报, 2000,20(5):898-902.
|
| [4] |
Li B G, Tao S . Correlation between AVHRR NDVI and climate factors[J]. Acta Ecologica Sinica, 2000,20(5):898-902.
|
| [5] |
Xiao J, Moody A . Geographical distribution of global greening trends and their climatic correlates:1982—1998[J]. International Journal of Remote Sensing, 2005,26(11):2371-2390.
|
| [6] |
Ma M G, Wang J, Wang X M , et al. Advance in the inter-annual variability of vegetation and its relation to climate based on remote sensing[J]. Journal of Remote Sensing, 2006,10(3):421-431.
|
| [7] |
Fang S B, Xu D Y, Zhang X S . Desertification process and its driving meteorological factors in Mu Us Sandland[J]. Journal of Desert Research, 2009,29(5):796-801.
|
| [8] |
王强, 张廷斌, 易桂花 , 等. 横断山区2004—2014年植被NPP时空变化及其驱动因子[J]. 生态学报, 2017,37(9):3084-3095.
|
| [8] |
Wang Q, Zhang T B, Yi G H , et al. Tempo-spatial variations and driving factors analysis of net primary productivity in the Hengduan Mountain area from 2004 to 2014[J]. Acta Ecologica Sinica, 2017,37(9):3084-3095.
|
| [9] |
Carlson T N, Ripley D A . On the relation between NDVI,fractional vegetation cover,and leaf area index[J]. Remote Sensing of Environment, 1997,62(3):241-252
|
| [10] |
Zhou L M, Tucker C J, Kaufmann R K , et al. Variations in northern vegetation activity inferred from satellite data of vegetation index during 1981—1999[J]. Journal of Geophysical Research, 2001,106(D17):20069-20083.
|
| [11] |
Leahy M G, Jollineau M Y, Howarth P J , et al. The use of Landsat data for investigating the long-term trends in wetland change at Long Point,Ontario[J]. Canadian Journal of Remote Sensing, 2005,31(3):240-254.
|
| [12] |
Fu B H, Burgher I . Riparian vegetation NDVI dynamics and its relationship with climate,surface water and groundwater[J]. Journal of Arid Environments, 2015,113:59-68.
|
| [13] |
刘宪锋, 任志远, 林志慧 , 等. 2000—2011年三江源区植被覆盖时空变化特征[J]. 地理学报, 2013,68(7):897-908.
|
| [13] |
Liu X F, Ren Z Y, Lin Z H , et al. The spatial-temporal changes of vegetation coverage in the Three-River Headwater region in recent 12 years[J]. Acta Geographica Sinica, 2013,68(7):897-908.
|
| [14] |
Shen B, Fang S B, Li G . Vegetation coverage changes and their response to meteorological variables from year 2000 to 2009 in Naqu,Tibet,China[J]. Canadian Journal of Remote Sensing,2014,40:( 1):67-74.
|
| [15] |
赵玉萍, 张宪洲, 王景升 , 等. 1982年至2003年藏北高原草地生态系统NDVI与气候因子的相关分析[J]. 资源科学, 2009,31(11):1988-1998.
|
| [15] |
Zhao Y P, Zhang X Z, Wang J S , et al. Correlation analysis between NDVI and climatic factors of grassland ecosystems in the northern Tibetan Plateau from 1982 to 2003[J]. Resources Science, 2009,31(11):1988-1998.
|
| [16] |
崔林丽, 史军, 肖风劲 , 等. 中国东部NDVI的变化趋势及其与气候因子的相关分析[J]. 资源科学, 2010,32(1):124-131.
|
| [16] |
Cui L L, Shi J, Xiao F J , et al. Variation trends in vegetation NDVI and its correlation with climatic factors in eastern China[J]. Resources Science, 2010,32(1):124-131.
|
| [17] |
李晓兵, 史培军 . 中国典型植被类型NDVI动态变化与气温、降水变化的敏感性分析[J]. 植物生态学报, 2000,24(3):379-382.
|
| [17] |
Li X B, Shi P J . Sensitivity analysis of variation in NDVI,temperature and precipitation in typical vegetation types across China[J]. Acta Phytoecologica Sinica, 2000,24(3):379-382.
|
| [18] |
林辉, 熊育久, 万玲凤 , 等. 湖南省MODIS遥感植被指数的时空变化[J]. 应用生态学报, 2007,18(3):581-585.
|
| [18] |
Lin H, Xiong Y J, Wan L F , et al. Temporal and spatial variation of MODIS vegetation indices in Hunan Province[J]. Chinese Journal of Applied Ecology, 2007,18(3):581-585.
|
| [19] |
邵全琴, 刘纪远, 黄麟 , 等. 2005—2009年三江源自然保护区生态保护和建设工程生态成效综合评估[J]. 地理研究, 2013,32(9):1645-1656.
|
| [19] |
Shao Q Q, Liu J Y, Huang L , et al. Integrated assessment on the effectiveness of ecological conservation in Sanjiangyuan National Nature Reserve[J]. Geographical Research, 2013,32(9):1645-1656.
|
| [20] |
陈琼, 周强, 张海峰 , 等. 三江源地区基于植被生长季的NDVI对气候因子响应的差异性研究[J]. 生态环境学报, 2010,26(6):1284-1289.
|
| [20] |
Chen Q, Zhou Q, Zhang H F , et al. Spatial disparity of NDVI response in vegetation growing season to climate change in the Three-River Headwaters region[J]. Ecology and Environment, 2010,26(6):1284-1289.
|
| [21] |
张新时 . 中国植被及其地理格局[M]. 北京: 地质出版社, 2007.
|
| [21] |
Zhang X S. Vegetation of China and Its Geographic Pattern[M]. Beijing: Geological Publishing House, 2007.
|
| [22] |
范微维 . 2000—2014年三江源区植被NDVI时空变化特征与气候变化响应分析[D]. 成都:成都理工大学, 2017.
|
| [22] |
Fan W W . Analysis of NDVI Changes and Its Climate Driving Factors in the Three River-Headwater Region During 2000—2014[D]. Chengdu:Chengdu University of Technology, 2017.
|
| [23] |
任雨 . 青藏高原的极端气候:变化事实与概率模拟[D]. 北京:中国科学院研究生院, 2009.
|
| [23] |
Ren Y . Climate Extremes over the Qinghai-Tibetan Plateau:Observed Changes and Probability Simulation[D]. Beijing:Graduate University of Chinese Academy of Sciences, 2009.
|
| [24] |
刘峰贵, 张海峰, 周强 , 等. 三江源地区冰雹灾害分布特征及其成因[J]. 干旱区地理, 2013,36(2):238-244.
|
| [24] |
Liu F G, Zhang H F, Zhou Q , et al. Distribution features of hail disasters and its formation analysis of the Three-River Headwaters region[J]. Arid Land Geography, 2013,36(2):238-244.
|
| [25] |
王建林, 关法春 . 高级作物生理学[M]. 北京: 中国农业大学出版社, 2013.
|
| [25] |
Wang J L, Guan F C. Advanced Crop Physiology[M]. Beijing: China Agricultural University Press, 2013.
|
| [26] |
何奕萱, 易桂花, 张廷斌 , 等. 红河流域“通道—阻隔”作用下2000—2014年植被EVI变化趋势与驱动力[J]. 生态学报, 2018,38(6):2056-2064.
|
| [26] |
He Y X, Yi G H, Zhang T B , et al. The EVI trends and driving factors in Red River basin affected by the “corridor barrier” function during 2000—2014[J]. Acta Ecologica Sinica, 2018,38(6):2056-2064.
|
| [27] |
毛飞, 卢志光, 张佳华 , 等. 近20年藏北地区AVHRR NDVI与气候因子的关系[J]. 生态学报, 2007,27(8):3198-3205
|
| [27] |
Mao F, Lu Z G, Zhang J H , et al. Relations between AVHRR NDVI and climate factors in northern Tibet in recent 20 years[J]. Acta Ecologica Sinica, 2007,27(8):3198-3205.
|
| [28] |
严丽坤 . 相关系数与偏相关系数在相关分析中的应用[J]. 云南财经大学学报, 2003,19(3):78-80.
|
| [28] |
Yan L K . Application of correlation coefficient and biased correlation coefficient in related analysis[J]. Journal of Yunnan Finance and Trade Institute, 2003,19(3):78-80.
|
| [29] |
李辉霞, 刘国华, 傅伯杰 . 基于NDVI的三江源地区植被生长对气候变化和人类活动的响应研究[J]. 生态学报, 2011,31(19):5495-5504.
|
| [29] |
Li H X, Liu G H, Fu B J . Response of vegetation to climate change and human activity based on NDVI in the Three-River Headwaters region[J]. Acta Ecologica Sinica, 2011,31(19):5495-5504.
|
|
Viewed |
|
|
|
Full text
|
|
|
|
|
Abstract
|
|
|
|
|
Cited |
|
|
|
|
| |
Shared |
|
|
|
|
| |
Discussed |
|
|
|
|
 2020,
Vol. 32
2020,
Vol. 32