|
|
|
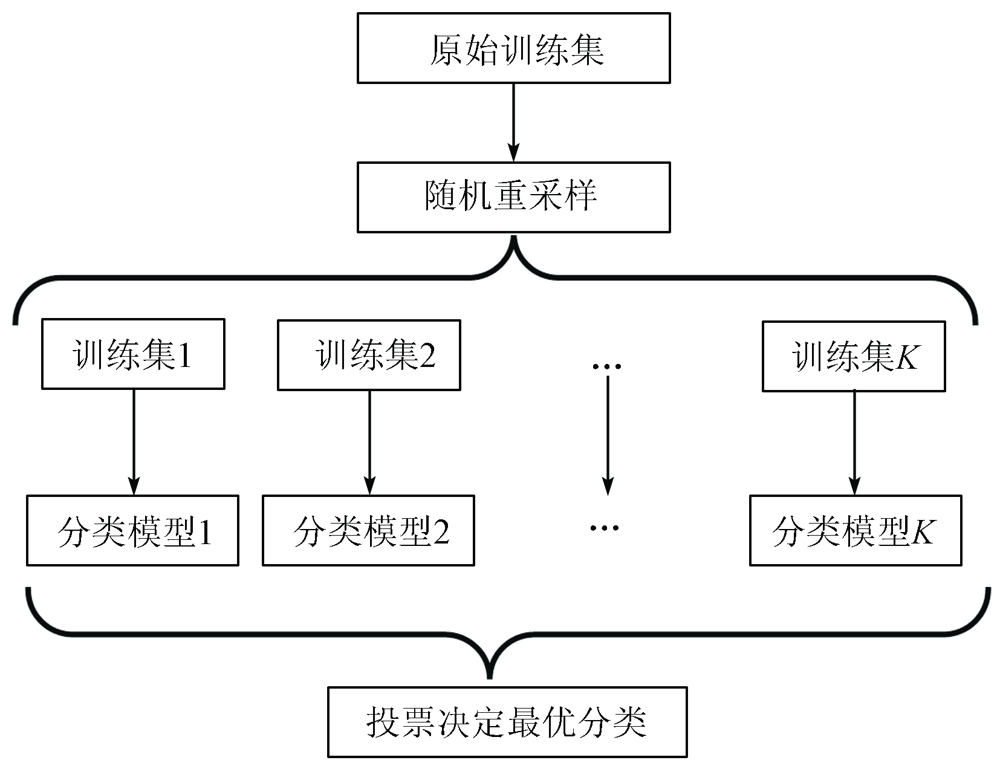
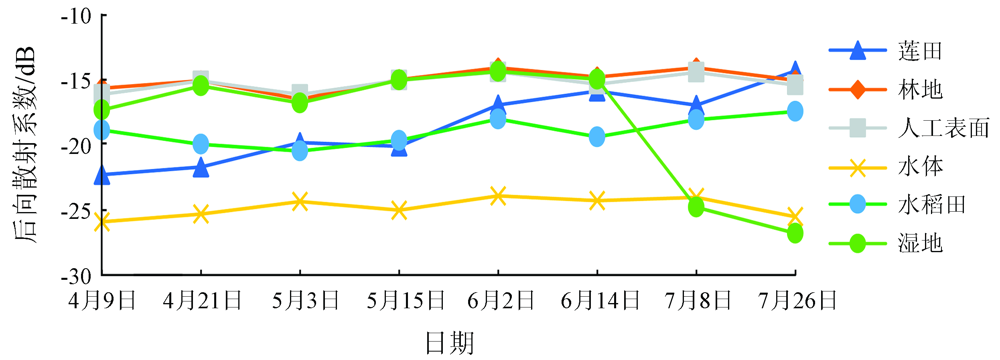
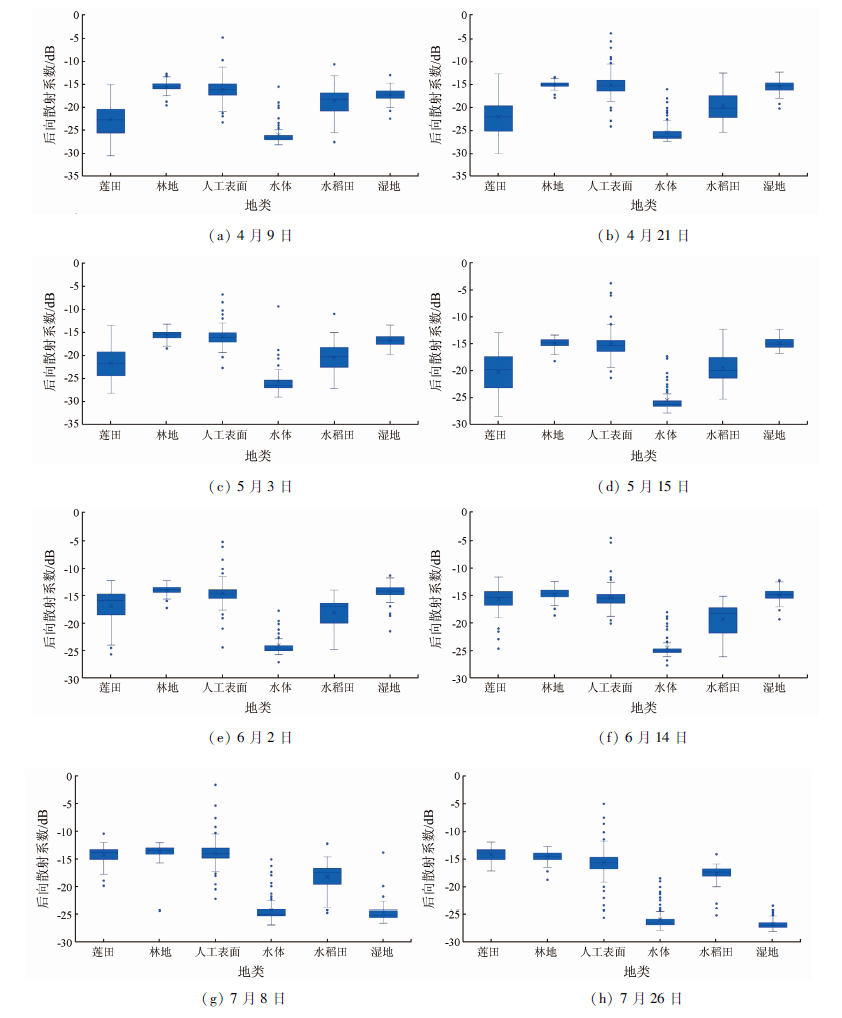
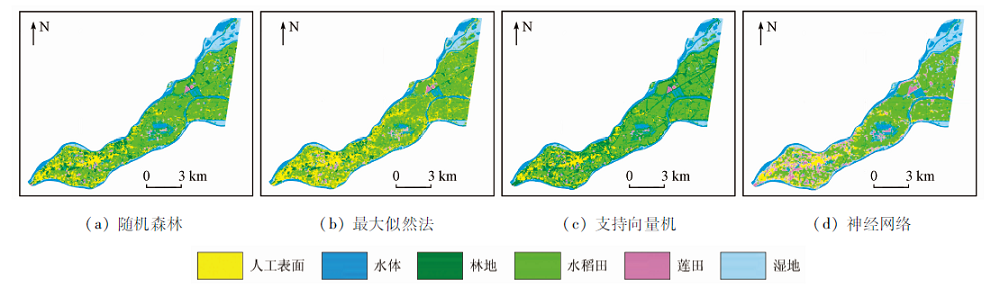
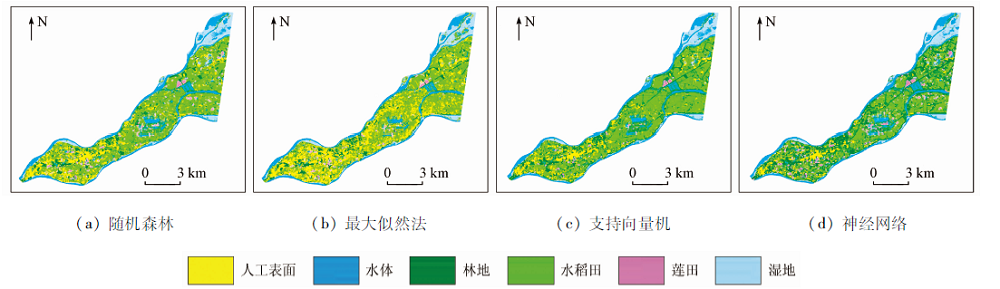
Abstract The monitoring and information extraction of paddy fields using remote sensing techniques is an important means for modern agricultural management. However, it is difficult to obtain effective optical monitoring data of south China due to the frequent cloudy and rainy weather in spring and summer in this area. To accurately extract information on paddy fields in areas subject to frequent cloudy and rainy weather, this study investigated the paddy fields in Jiangxiang Town in Nanchang County, Jiangxi Province, using multi-temporal Sentinel-1 SAR data as the data source. Specifically, this study calculated the J-M distance between paddy fields and other land types in different phenological periods, analyzed the changes in the distance based on the backscattering coefficients of various land types in key phenological periods, and then obtained the best phenological images for the information extraction of paddy fields. Afterward, this study conducted ground object classification using methods such as random forest, maximum likelihood, support vector machine, and neural network and then compared and verified the classification accuracy. The results are as follows. The combined SAR data of the different stages including booting stage (June 14), trefeil stage (April 21), transplantion period (May 3), and transplanting peried of second season late rice (July 26) is the optimal temporal combination for the information extraction of paddy fields. Higher classification accuracy of ground objects in the study area can be obtained using the random forest method, with overall classification accuracy of up to 0.943 and a Kappa coefficient of 0.932. This study conducted the mapping of paddy fields in areas with frequent cloudy and rainy weather using SAR data and will provide important references for the temporal selection and classification.
|
| Keywords
remote sensing and monitoring
information extraction
SAR
Sentinel-1
|
|
|
|
Corresponding Authors:
CAI Haisheng
E-mail: 345914421@qq.com;chs@jxau.edu.cn
|
|
Issue Date: 21 September 2022
|
|
|
| [1] |
Lu Z, Wang D Q, Deng Z D, et al. Application of red edge band in remote sensing extraction of surface water body:A case study based on GF-6 WFV data in arid area[J]. Hydrology Research, 2021, 52(6):1526-1541.
doi: 10.2166/nh.2021.050
url: https://iwaponline.com/hr/article/52/6/1526/83254/Application-of-red-edge-band-in-remote-sensing
|
| [2] |
吴炳方, 张淼, 曾红伟, 等. 全球农情遥感速报系统20年[J]. 遥感学报, 2019, 23(6):1053-1063.
|
| [2] |
Wu B F, Zhang M, Zeng H W, et al. Twenty years of crop watch:Progress and prospect[J]. Journal of Remote Sensing, 2019, 23(6):1053-1063.
|
| [3] |
杨知. 基于极化SAR的水稻物候期监测与参数反演研究[D]. 北京: 中国科学院大学, 2017.
|
| [3] |
Yang Z. Rice phenology estimation and parameter retrieval based on polarimetric synthetic aperture radar[D]. Beijing: The University of Chinese Academy of Sciences, 2017.
|
| [4] |
Perros N, Kalivas D, Giovos R. Spatial analysis of agronomic data and UAV imagery for rice yield estimation[J]. Agriculture, 2021, 11(9):809.
doi: 10.3390/agriculture11090809
url: https://www.mdpi.com/2077-0472/11/9/809
|
| [5] |
陈仲新, 任建强, 唐华俊, 等. 农业遥感研究应用进展与展望[J]. 遥感学报, 2016, 20(5):748-767.
|
| [5] |
Chen Z X, Ren J Q, Tang H J, et al. Progress and perspectives on agricultural remote sensing research and applications in China[J]. Journal of Remote Sensing, 2016, 20(5):748-767.
|
| [6] |
陈怀亮, 李颖, 张红卫. 农作物长势遥感监测业务化应用与研究进展[J]. 气象与环境科学, 2015, 38(1):95-102.
|
| [6] |
Chen H L, Li Y, Zhang H W. Operational application and research review of crop growth monitoring with remote sensing[J]. Meteorological and Environmental Sciences, 2015, 38(1):95-102.
|
| [7] |
Zhu L H, Liu X N, Wu L, et al. Detection of paddy rice cropping systems in southern China with time series Landsat images and phenology-based algorithms[J]. GIScience & Remote Sensing, 2021, 58(5):1-23.
|
| [8] |
Cao J J, Cai X L, Tan J W, et al. Mapping paddy rice using Landsat time series data in the Ganfu Plain irrigation system,Southern China,from 1988-2017[J]. International Journal of Remote Sensing, 2021, 42(4):1556-1576.
doi: 10.1080/01431161.2020.1841321
url: https://www.tandfonline.com/doi/full/10.1080/01431161.2020.1841321
|
| [9] |
Li R Y, Xu M Q, Chen Z Y, et al. Phenology-based classification of crop species and rotation types using fused MODIS and Landsat data:The comparison of a random-forest-based model and a decision-rule-based model[J]. Soil and Tillage Research, 2021, 206:104838.
doi: 10.1016/j.still.2020.104838
url: https://linkinghub.elsevier.com/retrieve/pii/S0167198720306206
|
| [10] |
Chandna P, Mondal S. Analyzing multi-year rice-fallow dynamics in Odisha using multi-temporal Landsat-8 OLI and Sentinel-1 Data[J]. GIScience & Remote Sensing, 2020, 57(4):431-449.
|
| [11] |
杨辉山, 谢萍. 华南地区季度性全覆盖卫星影像获取方案优化[J]. 测绘与空间地理信息, 2019, 42(5):159-162.
|
| [11] |
Yang H S, Xie P. Optimized solution of the high frequency and full coverage of satellite images acquisition in southern China[J]. Geomatics & Spatial Information Technology, 2019, 42(5):159-162.
|
| [12] |
Gasnier N, Denis L, Fjrtoft R, et al. Narrow river extraction from SAR images using exogenous information[J]. IEEE Journal of Selected Topics in Applied Earth Observations and Remote Sensing, 2021, 14:5720-5734.
doi: 10.1109/JSTARS.2021.3083413
url: https://ieeexplore.ieee.org/document/9440665/
|
| [13] |
Chang L, Chen Y T, Wang J H, et al. Rice-field mapping with sentinel-1A SAR time-series data[J]. Remote Sensing, 2021, 13(1):103.
doi: 10.3390/rs13010103
url: https://www.mdpi.com/2072-4292/13/1/103
|
| [14] |
Wu X X, Washaya P, Liu L, et al. Rice yield estimation based on spaceborne SAR:A review from 1988 to 2018[J]. IEEE Access, 2020(8):157462-157469.
|
| [15] |
Son N T, Chen C F, Chen C R, et al. A phenological object-based approach for rice crop classification using time-series Sentinel-1 synthetic aperture Radar (SAR) data in Taiwan[J]. International Journal of Remote Sensing, 2021, 42(7):2722-2739.
doi: 10.1080/01431161.2020.1862440
url: https://www.tandfonline.com/doi/full/10.1080/01431161.2020.1862440
|
| [16] |
Graman M, Kaliaperumal R, Pazhanivelan S, et al. Rice area estimation using parameterized classification of sentinel 1A SAR data[J]. ISPRS - International Archives of the Photogrammetry,Remote Sensing and Spatial Information Sciences, 2019, XLII-3/W6:141-147.
|
| [17] |
Zhu H L, Wang W Y, Leung R. SAR target classification based on Radar image luminance analysis by deep learning[J]. IEEE Sensors Letters, 2020, 4(3):1-4.
|
| [18] |
Bianchi F, Espeseth M, Borch N. Large-scale detection and categorization of oil spills from SAR images with deep learning[J]. Remote Sensing, 2020, 12(14):2260.
doi: 10.3390/rs12142260
url: https://www.mdpi.com/2072-4292/12/14/2260
|
| [19] |
邓刚, 唐志光, 李朝奎, 等. 基于MODIS时序数据的湖南省水稻种植面积提取及时空变化分析[J]. 国土资源遥感, 2020, 32(2):177-185.doi: 10.6046/gtzyyg.2020.02.23.
doi: 10.6046/gtzyyg.2020.02.23
|
| [19] |
Deng G, Tang Z G, Li C K, et al. Extraction and analysis of spatiotemporal variation of rice planting area in Hunan Province based on MODIS time-series data[J]. Remote Sensing for Land and Resources, 2020, 32(2):177-185.doi: 10.6046/gtzyyg.2020.02.23.
doi: 10.6046/gtzyyg.2020.02.23
|
| [20] |
张悦琦, 李荣平, 穆西晗, 等. 基于多时相GF-6遥感影像的水稻种植面积提取[J]. 农业工程学报, 2021, 37(17):189-196.
|
| [20] |
Li Y Q, Li R P, Mu X H, et al. Extraction of paddy rice planting areas based on multi-temporal GF-6 remote sensing image[J]. Transactions of the Chinese Society of Agricultural Engineering, 2021, 37(17):189-196.
|
| [21] |
Woodhouse I. Introduction to microwave remote sensing[M]. USA: CRC Press, 2017:157-158.
|
| [22] |
Xu Z. Wavelength-resolution SAR speckle model[J]. IEEE Geoscience and Remote Sensing Letters, 2022, 19:1-5.
|
| [23] |
Hu C B, Laurent L F, Kuang G Y. Ship discrimination using polarimetric SAR data and coherent time-frequency analysis[J]. Remote Sensing, 2013, 5(12):6899-6920.
doi: 10.3390/rs5126899
url: http://www.mdpi.com/2072-4292/5/12/6899
|
| [24] |
Luo Y J, Zhao Y S, Li X W, et al. Research and application of multi-angle polarization characteristics of water body mirror reflection[J]. Science in China(Series D:Earth Sciences), 2007, 50(6):946-952.
|
| [25] |
Jang J W, Kim T Y, Lim S B. RF Interference analysis and verification in the synthetic aperture Radar satellite system[J]. Aerospace Engineering and Technology, 2009, 8(1):187-196.
|
| [26] |
吴琳琳, 李晓燕, 毛德华, 等. 基于遥感和多源地理数据的城市土地利用分类[J]. 自然资源遥感, 2022, 34(1):127-134.doi: 10.6046/zrzyyg.2021061.
doi: 10.6046/zrzyyg.2021061
|
| [26] |
Wu L L, Li X Y, Mao D H, et al. Urban land use classification based on remote sensing and multi-source geographic data[J]. Remote Sensing for Natural Resources, 2022, 34(1):127-134.doi: 10.6046/zrzyyg.2021061.
doi: 10.6046/zrzyyg.2021061
|
| [27] |
桂预风, 李振平, 万爽, 等. 收敛性随机森林模型及其遥感应用[J]. 数学的实践与认识, 2015, 45(18):207-212.
|
| [27] |
Gui Y F, Li Z P, Wan S, et al. Convergent random forests model and its application in remote sensing[J]. Mathematics in Practice and Theory, 2015, 45(18):207-212.
|
| [28] |
吕岚. 基于随机森林的快速兴趣点检测[J]. 自动化技术与应用, 2016, 35(9):95-100.
|
| [28] |
Lyu L. A fast interest point detector based on random forest[J]. Techniques of Automation and Applications, 2016, 35(9):95-100.
|
| [29] |
韩冰冰, 陈圣波, 曾庆鸿, 等. 基于J-M距离的多时相Sentinel-1农作物分类[J]. 科学技术与工程, 2020, 20(17):6977-6982.
|
| [29] |
Han B B, Chen S B, Zeng Q H, et al. Time-series classification of Sentinel-1 data based on J-M distance[J] Science Technology and Engineering, 2020, 20(17):6977-6982.
|
| [30] |
刘警鉴, 李洪忠, 华璀, 等. 基于Sentinel-1A数据的临高县早稻面积提取[J]. 国土资源遥感, 2020, 32(1):191-199.doi: 10.6046/gtzyyg.2020.01.26.
doi: 10.6046/gtzyyg.2020.01.26
|
| [30] |
Liu J J, Li H Z, Hua C, et al. Extraction of early paddy rice area in Lingao county based on sentinel-1A data[J]. Remote Sensing for Land and Resources, 2020, 32(1):191-199.doi: 10.6046/gtzyyg.2020.01.26.
doi: 10.6046/gtzyyg.2020.01.26
|
| [31] |
马腾耀, 肖鹏峰, 张学良, 等. 基于特征优选的GF-3全极化数据积雪识别[J]. 遥感技术与应用, 2020, 35(6):1292-1302.
|
| [31] |
Ma T Y, Xiao P F, Zhang X L, et al. Recognition of snow cover based on features selection in GF-3 fully polarimetric data[J]. Remote Sensing Technology and Application, 2020, 35(6):1292-1302.
|
| [32] |
张颖, 高倩倩. 基于随机森林分类算法的巢湖水质评价[J]. 环境工程学报, 2016, 10(2):992-998.
|
| [32] |
Zhang Y, Gao Q Q. Water quality evaluation of Chaohu Lake based on random forest method[J]. Chinese Journal of Environmental Engineering, 2016, 10(2):992-998.
|
|
Viewed |
|
|
|
Full text
|
|
|
|
|
Abstract
|
|
|
|
|
Cited |
|
|
|
|
| |
Shared |
|
|
|
|
| |
Discussed |
|
|
|
|
 2022,
Vol. 34
2022,
Vol. 34
 ), CAI Haisheng1(