|
|
 |
|

|
|
|
Spatiotemporal changes of ecological quality and their driving factors in Zhengzhou City over the last 20 years |
AO Yong1,2,3( ), WANG Ya1, WANG Xiaofeng1,2,3, WU Jingsheng1, ZHANG Yiheng1, LI Xuejiao1 ), WANG Ya1, WANG Xiaofeng1,2,3, WU Jingsheng1, ZHANG Yiheng1, LI Xuejiao1 |
1. School of Land Engineering,Chang’an University, Xi’an 710054, China
2. Shaanxi Key Laboratory of Land Consolidation,Xi’an 710054, China
3. Key Laboratory of Degraded and Unused Land Consolidation Engineering,Ministry of Natural Resource,Xi’an 710054, China |
|
|
|
|
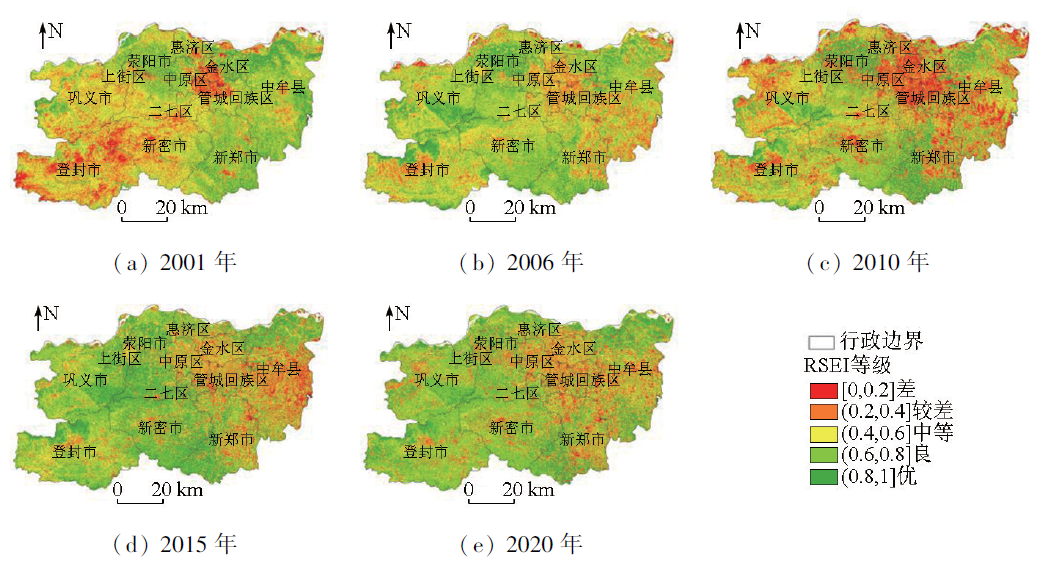
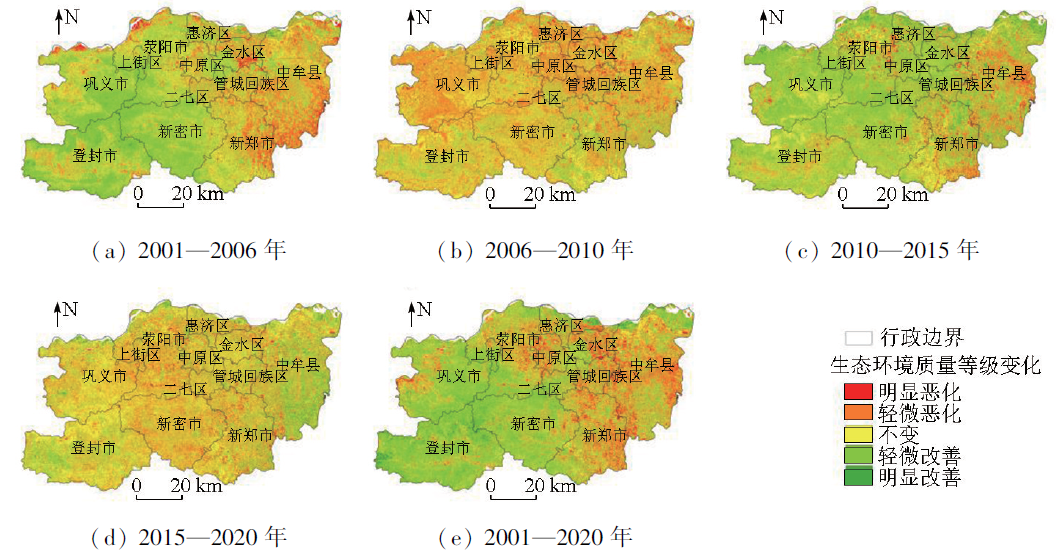
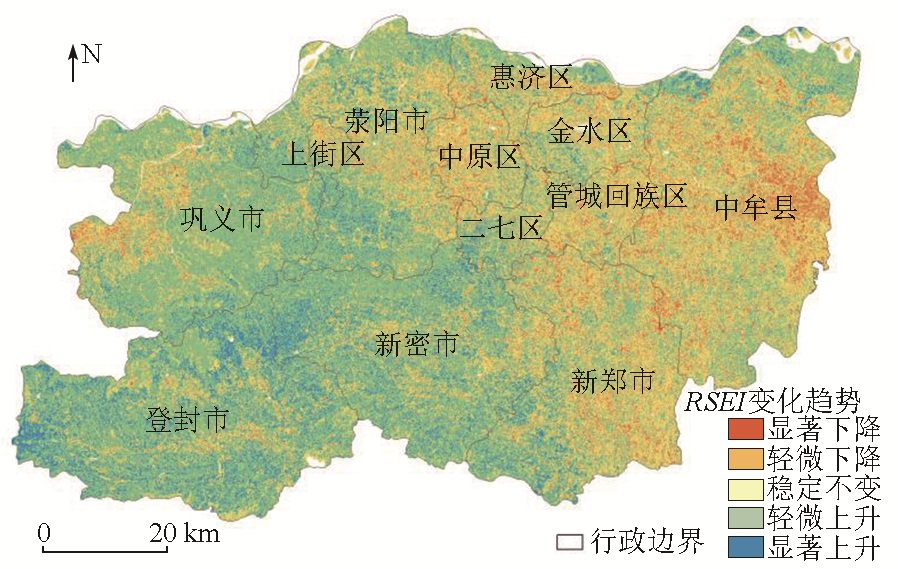
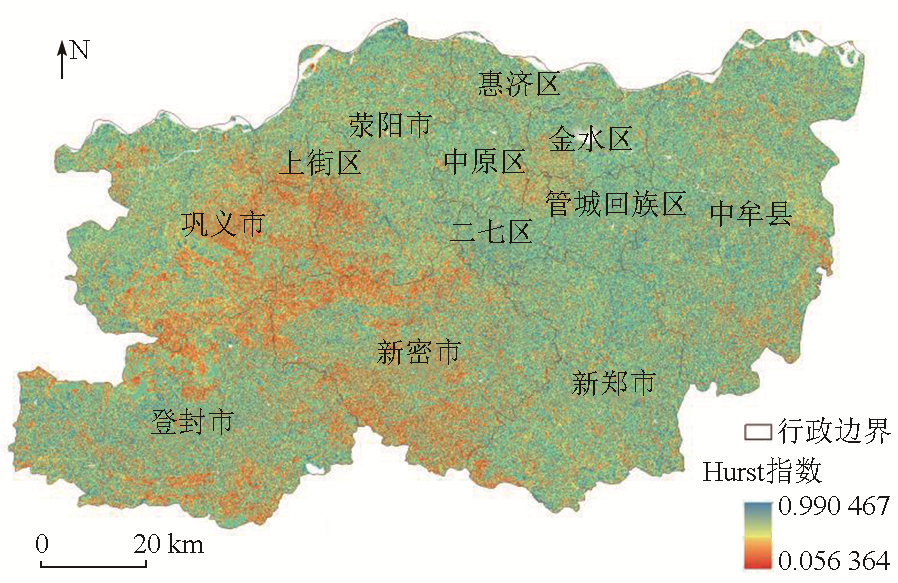
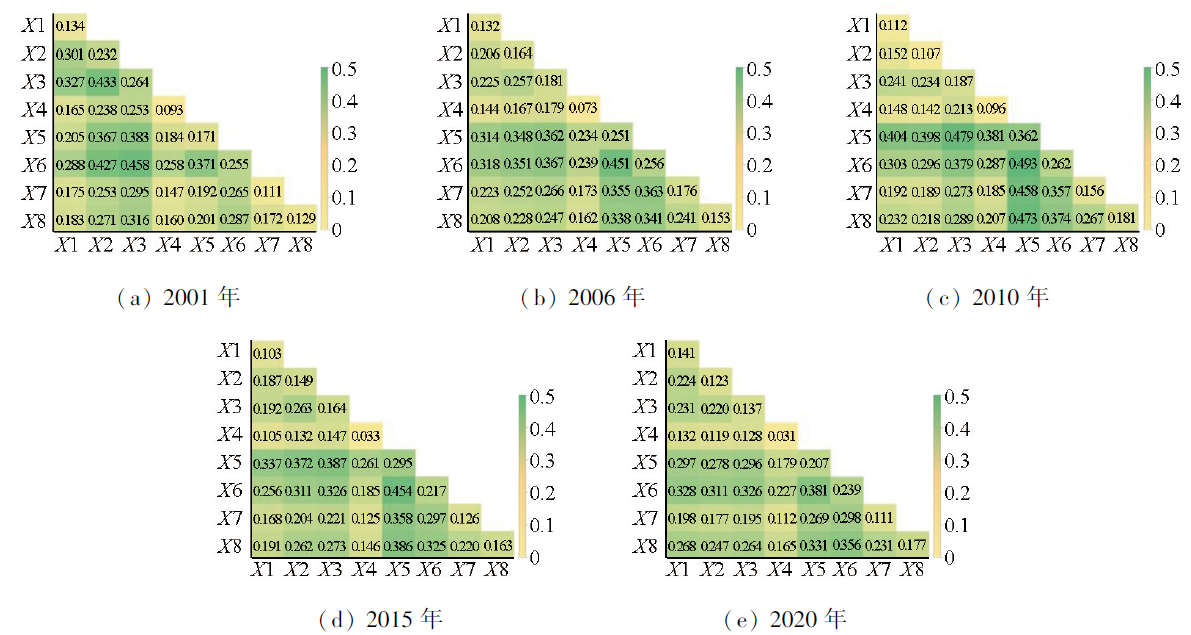
Abstract Ecological quality is an important indicator of a regional development level. Objective, quantitative dynamic monitoring and analysis of long-term ecological quality can provide a scientific basis for urban sustainable development and ecological construction. Based on Landsat remote sensing images, this study constructed the remote sensing ecological index (RSEI) as an evaluation index using principal component analysis. Accordingly, this study explored the spatiotemporal change characteristics of ecological quality in Zhengzhou from 2001 to 2020, as well as the extent of influence of various driving factors, using the Sen+Mann-Kendall trend analysis, the Hurst index, and geographical detectors. The results indicate that from 2001 to 2020, Zhengzhou maintained moderate ecological quality overall. The RSEI showed downward, upward, and then downward trends sequentially. Spatially, the eastern plains showed lower ecological quality, whereas the southwestern mountainous and hilly areas exhibited higher ecological quality. The regional ecological quality remained unchanged predominantly or saw slight improvements over these years except for 2010, when the area of zones with ecological quality deteriorating significantly increased due to high temperature. From 2001 to 2020, the ecological quality in Zhengzhou exhibited significant trends, with 56.34% of areas showing an upward trend and 42.26% exhibiting a downward trend. These results, along with the Hurst index, reveal that the downward trend in ecological quality in the eastern part is primarily characterized by sustainable changes in the future, while the upward trend in ecological quality in the southwestern partition is primarily characterized by anti-sustainable changes in the future. Driving force analysis indicates that over the 20 years, primary factors influencing changes in ecological quality in Zhengzhou included land use type and population density, whose explanatory power is significantly stronger than other factors. The impact of natural factors, such as elevation and average annual precipitation, has gradually diminished, while the influence of the night light index, which reflects the urbanization level, has progressively increased. The results of this study will provide a scientific basis for the evaluation and preservation of ecosystems in Zhengzhou.
|
| Keywords
ecological quality
remote sensing ecological index
Sen-Mann-Kendall
Hurst index
geodetector
|
|
|
|
Issue Date: 17 February 2025
|
|
|
| [1] |
熊欢欢, 梁龙武, 曾赠, 等. 中国城市PM2.5时空分布的动态比较分析[J]. 资源科学, 2017, 39(1):136-146.
doi: 10.18402/resci.2017.01.14
|
| [1] |
Xiong H H, Liang L W, Zeng Z, et al. Dynamic analysis of PM2.5 spatial-temporal characteristics in China[J]. Resources Science, 2017, 39(1):136-146.
|
| [2] |
Zeng S Y, Ma J, Yang Y J, et al. Spatial assessment of farmland soil pollution and its potential human health risks in China[J]. Science of the Total Environment, 2019,687:642-653.
|
| [3] |
罗红霞, 戴声佩, 李茂芬, 等. 海南岛植被覆盖变化驱动因子及相对作用评价[J]. 国土资源遥感, 2020, 32(1):154-161.doi:10.6046/gtzyyg.2020.01.21.
|
| [3] |
Luo H X, Dai S P, Li M F, et al. Relative roles of climate changes and human activities in vegetation variables in Hainan Island[J]. Remote Sensing for Land and Resources, 2020, 32(1):154-161.doi:10.6046/gtzyyg.2020.01.21.
|
| [4] |
胡楠林, 任志彬, 董禹麟, 等. 中国城市群热岛效应时空演变及其影响因素分析[J]. 地理科学, 2022, 42(9):1534-1545.
doi: 10.13249/j.cnki.sgs.2022.09.003
|
| [4] |
Hu N L, Ren Z B, Dong Y L, et al. Spatio-temporal evolution of heat island effect and its driving factors in urban agglomerations of China[J]. Scientia Geographica Sinica, 2022, 42(9):1534-1545.
doi: 10.13249/j.cnki.sgs.2022.09.003
|
| [5] |
中华人民共和国环境保护部. HJ 192—2015 生态环境状况评价技术规范[S]. 北京: 中国环境科学出版社, 2015.
|
| [5] |
Ministry of Environmental Protection of the People’s Republic of China. HJ 192—2015 Technical criterion for ecosystem status evaluation[S]. Beijing: China Environmental Science Press, 2015.
|
| [6] |
Jing Y, Zhang F, He Y, et al. Assessment of spatial and temporal variation of ecological environment quality in Ebinur Lake Wetland National Nature Reserve,Xinjiang,China[J]. Ecological Indicators, 2020,110:105874.
|
| [7] |
张洁, 杨燕琼. 珠江三角洲城市群生态状况变化遥感评价[J]. 西北林学院学报, 2019, 34(1):184-191.
|
| [7] |
Zhang J, Yang Y Q. Remote sensing evaluation on the change of ecological status of Pearl River Delta urban agglomeration[J]. Journal of Northwest Forestry University, 2019, 34(1):184-191.
|
| [8] |
张芳宁, 杨亮洁, 杨永春. 1981—2016年黄土高原植被NDVI变化及对气候和人类活动的响应[J]. 水土保持研究, 2023, 30(2):230-237.
|
| [8] |
Zhang F N, Yang L J, Yang Y C. Change of vegetation NDVI and its response to climatic and human activities in the Loess Plateau during 1981—2016[J]. Research of Soil and Water Conservation, 2023, 30(2):230-237.
|
| [9] |
王阳, 孙然好. 区域气候背景对城市热岛效应的影响规律[J]. 生态学报, 2021, 41(11):4288-4299.
|
| [9] |
Wang Y, Sun R H. Impacts of regional climate on urban heat islands in China[J]. Acta Ecologica Sinica, 2021, 41(11):4288-4299.
|
| [10] |
温小乐, 徐涵秋. 福州城市扩展对闽江下游水质影响的遥感分析[J]. 地理科学, 2010, 30(4):624-629.
|
| [10] |
Wen X L, Xu H Q. Remote sensing analysis of impact of Fuzhou City expansion on water quality of lower Minjiang River,China[J]. Scientia Geographica Sinica, 2010, 30(4):624-629.
|
| [11] |
Musse M A, Barona D A, Santana Rodriguez L M.Urban environmental quality assessment using remote sensing and census data[J]. International Journal of Applied Earth Observation and Geoinformation, 2018,71:95-108.
|
| [12] |
徐涵秋. 城市遥感生态指数的创建及其应用[J]. 生态学报, 2013, 33(24):7853-7862.
|
| [12] |
Xu H Q. A remote sensing urban ecological index and its application[J]. Acta Ecologica Sinica, 2013, 33(24):7853-7862.
|
| [13] |
Karbalaei Saleh S, Amoushahi S, Gholipour M. Spatiotemporal ecological quality assessment of metropolitan cities:A case study of central Iran[J]. Environmental Monitoring and Assessment, 2021, 193(5):305.
doi: 10.1007/s10661-021-09082-2
pmid: 33900465
|
| [14] |
Airiken M, Zhang F, Chan N W, et al. Assessment of spatial and temporal ecological environment quality under land use change of urban agglomeration in the North Slope of Tianshan,China[J]. Environmental Science and Pollution Research, 2022, 29(8):12282-12299.
|
| [15] |
李世杰, 冯徽徽, 王珍, 等. 近十年洞庭湖流域生态环境状况时空动态特征及影响因素[J]. 自然资源遥感:1-10.doi:10.6046/zrzyyg.2022375.
|
| [15] |
Li S J, Feng H H, Wang Z, et al. Spatial and temporal dynamic characteristics and influencing factors of ecological environment in Dongting Lake Basin in recent 10 years[J]. Remote sensing of natural resources:1-10.doi:10.6046/zrzyyg.2022375.
|
| [16] |
王丽春, 焦黎, 来风兵, 等. 基于遥感生态指数的新疆玛纳斯湖湿地生态变化评价[J]. 生态学报, 2019, 39(8):2963-2972.
|
| [16] |
Wang L C, Jiao L, Lai F B, et al. Evaluation of ecological changes based on a remote sensing ecological index in a Manas Lake wetland,Xinjiang[J]. Acta Ecologica Sinica, 2019, 39(8):2963-2972.
|
| [17] |
赵管乐, 彭培好. 基于RSEI的典例干热河谷区——四川省攀枝花市生态环境变化分析[J]. 山地学报, 2021, 39(6):842-854.
|
| [17] |
Zhao G Y, Peng P H. RSEI-based evaluation on ecological environment changes in typical dry hot valley:Panzhihua City,Sichuan,China[J]. Mountain Research, 2021, 39(6):842-854.
|
| [18] |
权文婷, 张树誉, 刘艳, 等. 基于遥感生态指数的陕西省东庄水库流域生态环境变化监测与评价[J]. 水土保持通报, 2022, 42(5):96-104,113.
|
| [18] |
Quan W T, Zhang S Y, Liu Y, et al. Monitoring and evaluation of ecological environment changes in Dongzhuang Reservoir basin in Shaanxi Province based on remote sensing ecological index[J]. Bulletin of Soil and Water Conservation, 2022, 42(5):96-104,113.
|
| [19] |
李元应, 郑琳琳. 基于黄河流域生态环境保护视域下郑州与焦作绿色城市建设问题探究[J]. 现代园艺, 2022, 45(8):158-160.
|
| [19] |
Li Y Y, Zheng L L. On the construction of green cities in Zhengzhou and Jiaozuo from the perspective of ecological environment protection in the Yellow River basin[J]. Contemporary Horticulture, 2022, 45(8):158-160.
|
| [20] |
尚明宇, 王富强, 马尚钰. 郑州市土地利用/覆被变化模拟预测及其水源涵养量计算评估[J]. 水利水电技术(中英文), 2023, 54(1):75-86.
|
| [20] |
Shang M Y, Wang F Q, Ma S Y. Prediction of land use/cover change and evaluation of water conservation function in Zhengzhou City[J]. Water Resources and Hydropower Engineering, 2023, 54(1):75-86.
|
| [21] |
王佃来, 刘文萍, 黄心渊. 基于Sen+Mann-Kendall的北京植被变化趋势分析[J]. 计算机工程与应用, 2013, 49(5):13-17.
|
| [21] |
Wang D L, Liu W P, Huang X Y. Trend analysis in vegetation cover in Beijing based on Sen+Mann-Kendall method[J]. Computer Engineering and Applications, 2013, 49(5):13-17.
|
| [22] |
李超, 李雪梅. 2000—2018年中国植被生态质量时空变化特征[J]. 长江流域资源与环境, 2021, 30(9):2154-2165.
|
| [22] |
Li C, Li X M. Characteristics of spatio-temporal variation of ecological quality for vegetation in China from 2000—2018[J]. Resources and Environment in the Yangtze Basin, 2021, 30(9):2154-2165.
|
| [23] |
王巨. 基于时序NDVI植被变化检测与驱动因素量化方法研究——以河西地区为例[D]. 兰州: 兰州大学, 2020.
|
| [23] |
Wang J. Methods for detecting vegetation changes and quantifying the driving factors using NDVI timeseries by taking Hexi as a case area[D]. Lanzhou: Lanzhou University, 2020.
|
| [24] |
康帅直, 穆琪, 赵永华, 等. 黄土高原神府资源开采区生态环境质量时空格局特征[J]. 生态学报, 2023, 43(7):2781-2792.
|
| [24] |
Kang S Z, Mu Q, Zhao Y H, et al. Temporal and spatial pattern characteristics of ecological environmental quality in Shenfu mining area of Loess Plateau[J]. Acta Ecologica Sinica, 2023, 43(7):2781-2792.
|
| [25] |
孔晶晶, 昝梅, 王雪梅, 等. 新疆玛纳斯河流域植被水分利用效率时空格局及影响因素研究[J]. 水资源与水工程学报, 2022, 33(6):196-203,212.
|
| [25] |
Kong J J, Zan M, Wang X M, et al. Spatiotemporal pattern of vegetation water use efficiency and its influencing factors in Manas River basin,Xinjiang[J]. Journal of Water Resources and Water Engineering, 2022, 33(6):196-203,212.
|
| [26] |
Wu S, Gao X, Lei J, et al. Ecological environment quality evaluation of the Sahel region in Africa based on remote sensing ecological index[J]. Journal of Arid Land, 2022, 14(1):14-33.
doi: 10.1007/s40333-022-0057-1
|
| [27] |
王劲峰, 徐成东. 地理探测器:原理与展望[J]. 地理学报, 2017, 72(1):116-134.
doi: 10.11821/dlxb201701010
|
| [27] |
Wang J F, Xu C D. Geodetector:Principle and prospective[J]. Acta Geographica Sinica, 2017, 72(1):116-134.
|
| [28] |
邢昱, 赵颖, 唐敏, 等. 河南省“十三五”期间生态环境质量变化趋势[J]. 中国环境监测, 2022, 38(6):40-49.
|
| [28] |
Xing Y, Zhao Y, Tang M, et al. Trends in eco-environmental quality in Henan Province during the 13th Five-Year Plan period[J]. Environmental Monitoring in China, 2022, 38(6):40-49.
|
| [29] |
田智慧, 尹传鑫, 王晓蕾. 鄱阳湖流域生态环境动态评估及驱动因子分析[J]. 环境科学, 2023, 44(2):816-827.
|
| [29] |
Tian Z H, Yin C X, Wang X L. Dynamic monitoring and driving factors analysis of ecological environment quality in Poyang Lake basin[J]. Environmental Science, 2023, 44(2):816-827.
|
| [30] |
王栋华, 田义超, 张亚丽, 等. 峰丛洼地流域植被覆盖度时空演变及其归因[J]. 中国环境科学, 2022, 42(9):4274-4284.
|
| [30] |
Wang D H, Tian Y C, Zhang Y L, et al. Spatiotemporal evolution and attribution of vegetation coverage in the peak-cluster depression basins[J]. China Environmental Science, 2022, 42(9):4274-4284.
|
| [31] |
Gao P, Kasimu A, Zhao Y, et al. Evaluation of the temporal and spatial changes of ecological quality in the Hami oasis based on RSEI[J]. Sustainability, 2020, 12(18):7716.
|
| [32] |
卢楠楠. 基于遥感的不透水面监测及其对生态环境质量的影响——以郑州开封地区为例[D]. 开封: 河南大学, 2022.
|
| [32] |
Lu N N. Monitoring of impervious surface based on remote sensing and its impact on ecological environment quality[D]. Kaifeng: Henan University, 2022.
|
| [33] |
Guo H, Zhang B, Bai Y, et al. Ecological environment assessment based on remote sensing in Zhengzhou[J]. IOP Conference Series:Earth and Environmental Science, 2017,94:012190.
|
|
Viewed |
|
|
|
Full text
|
|
|
|
|
Abstract
|
|
|
|
|
Cited |
|
|
|
|
| |
Shared |
|
|
|
|
| |
Discussed |
|
|
|
|
 2025,
Vol. 37
2025,
Vol. 37