Please wait a minute...
 
自然资源遥感  2024, Vol. 36 Issue (2): 39-49    DOI: 10.6046/zrzyyg.2022413
  技术方法 本期目录 | 过刊浏览 | 高级检索 |
基于特征优选和时空融合算法的黄河三角洲湿地类别制图方法研究
冯倩1(), 张佳华2,3(), 邓帆1, 吴贞江3, 赵恩灵1, 郑培鑫1, 韩杨1
1.长江大学地球科学学院,武汉 430100
2.中国科学院空天信息创新研究院中国科学院数字地球重点实验室,北京 100094
3.中国科学院大学地球与行星科学学院, 北京 100049
A mapping methodology for wetland categories of the Yellow River Delta based on optimal feature selection and spatio-temporal fusion algorithm
FENG Qian1(), ZHANG Jiahua2,3(), DENG Fan1, WU Zhenjiang3, ZHAO Enling1, ZHENG Peixin1, HAN Yang1
1. School of Geosciences, Yangtze University, Wuhan 430100, China
2. CAS Key Laboratory of Digital Earth Science, Aerospace Information Research Institute, Chinese Academy of Sciences, Beijing 100094, China
3. College of Earth and Planetary Sciences, University of Chinese Academy of Sciences, Beijing 100049, China
全文: PDF(9727 KB)   HTML  
输出: BibTeX | EndNote (RIS)      
摘要 

滨海湿地的遥感分类研究对于滨海湿地的保护和规划具有重要意义。为此,以黄河三角洲作为研究区,采用2019年3—10月获取的8景Landsat8 OIL作为数据源,使用GEE(Google Earth Engine)云平台,根据影像的不同特征构建了7种不同的分类方案; 然后,使用随机森林分类器对不同特征集合进行分类,并选择其中分类效果最好的用于绘制黄河三角洲地区的湿地类别图。其中8,9月份数据由于受到云的污染导致质量差,使用增强型自适应反射率时空融合模型(enhanced spatial and temporal adaptive reflectance fusion model,ESTARFM)算法对有云区域进行填补处理。结果表明: ①ESTARFM时空融合模型生成的预测影像与真实影像波段表现出较好的相关性,其 R 值均能达到 0.73 以上, 说明重构的影像可以用于本研究; ②使用随机森林算法对研究区地物类型进行分类,其中方案7通过特征优选,分类结果总体精度达92.28%,Kappa系数达0.91,分类结果与湿地实况相吻合,比常规方案分类精度更高。研究结果有助于了解和掌握该区域湿地不同类型的空间分布特征,可为区域生态环境的保护和规划提供科学依据。

服务
把本文推荐给朋友
加入引用管理器
E-mail Alert
RSS
作者相关文章
冯倩
张佳华
邓帆
吴贞江
赵恩灵
郑培鑫
韩杨
关键词 Landsat8多时相数据黄河三角洲湿地图像融合Google Earth Engine随机森林    
Abstract

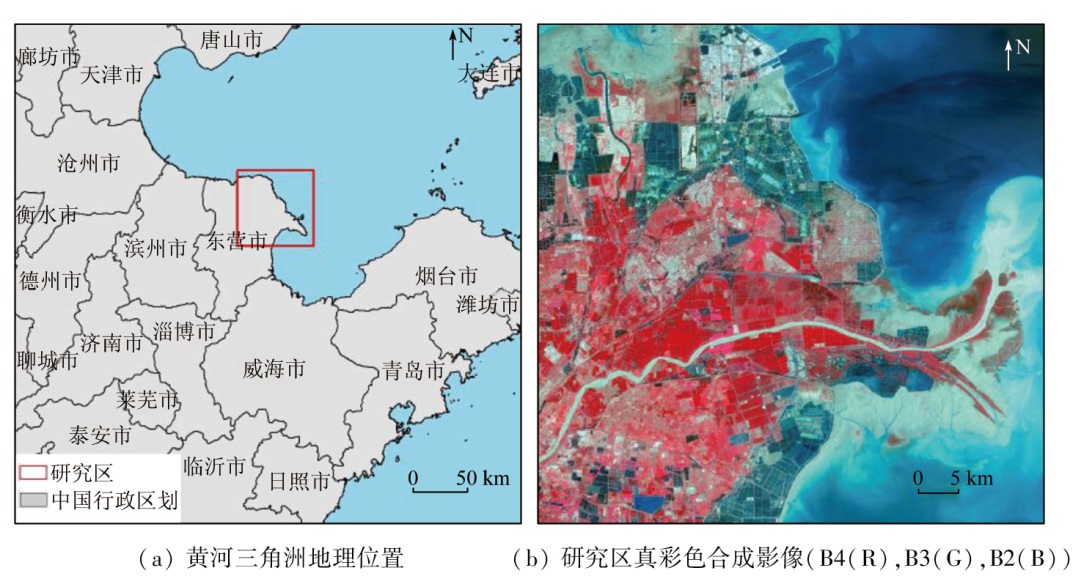
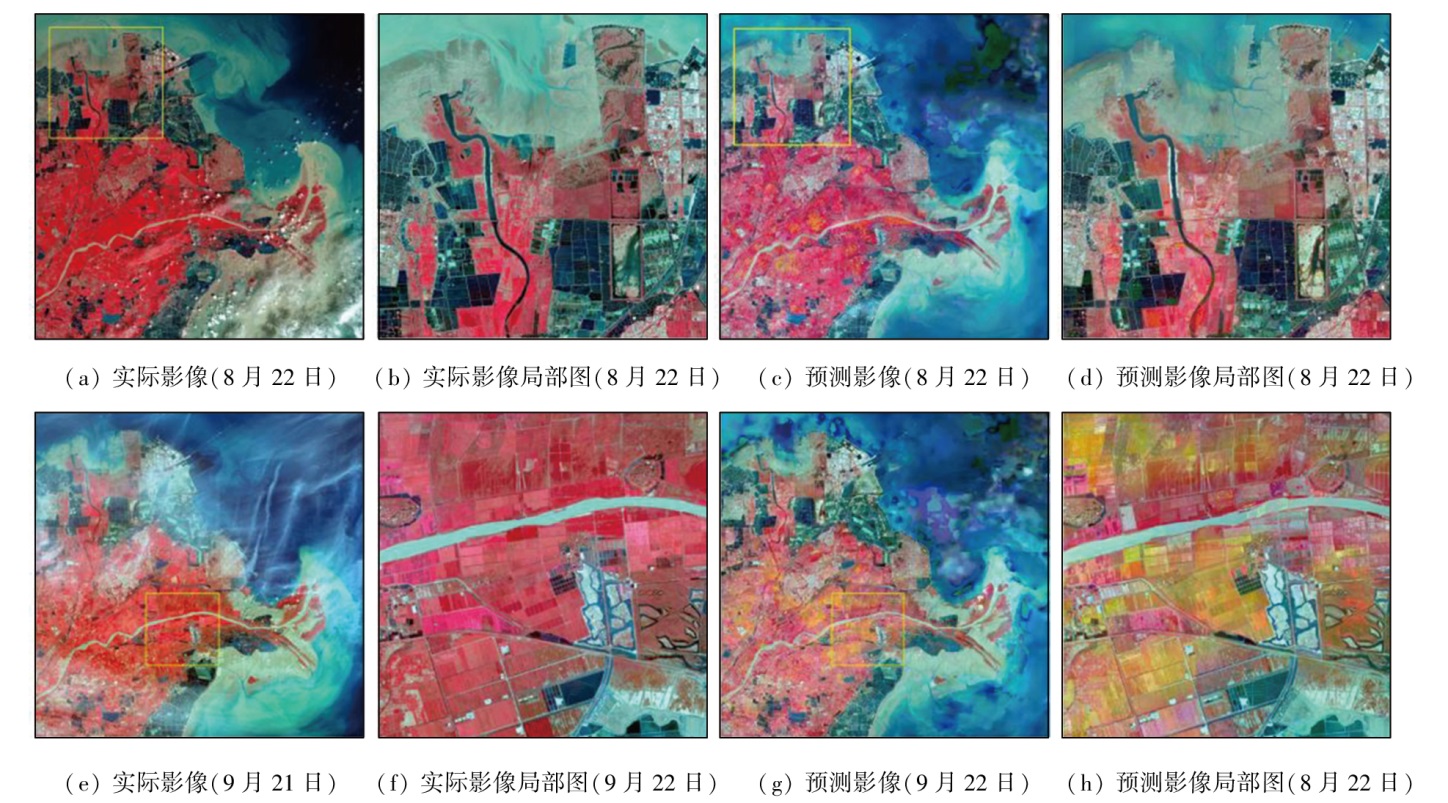
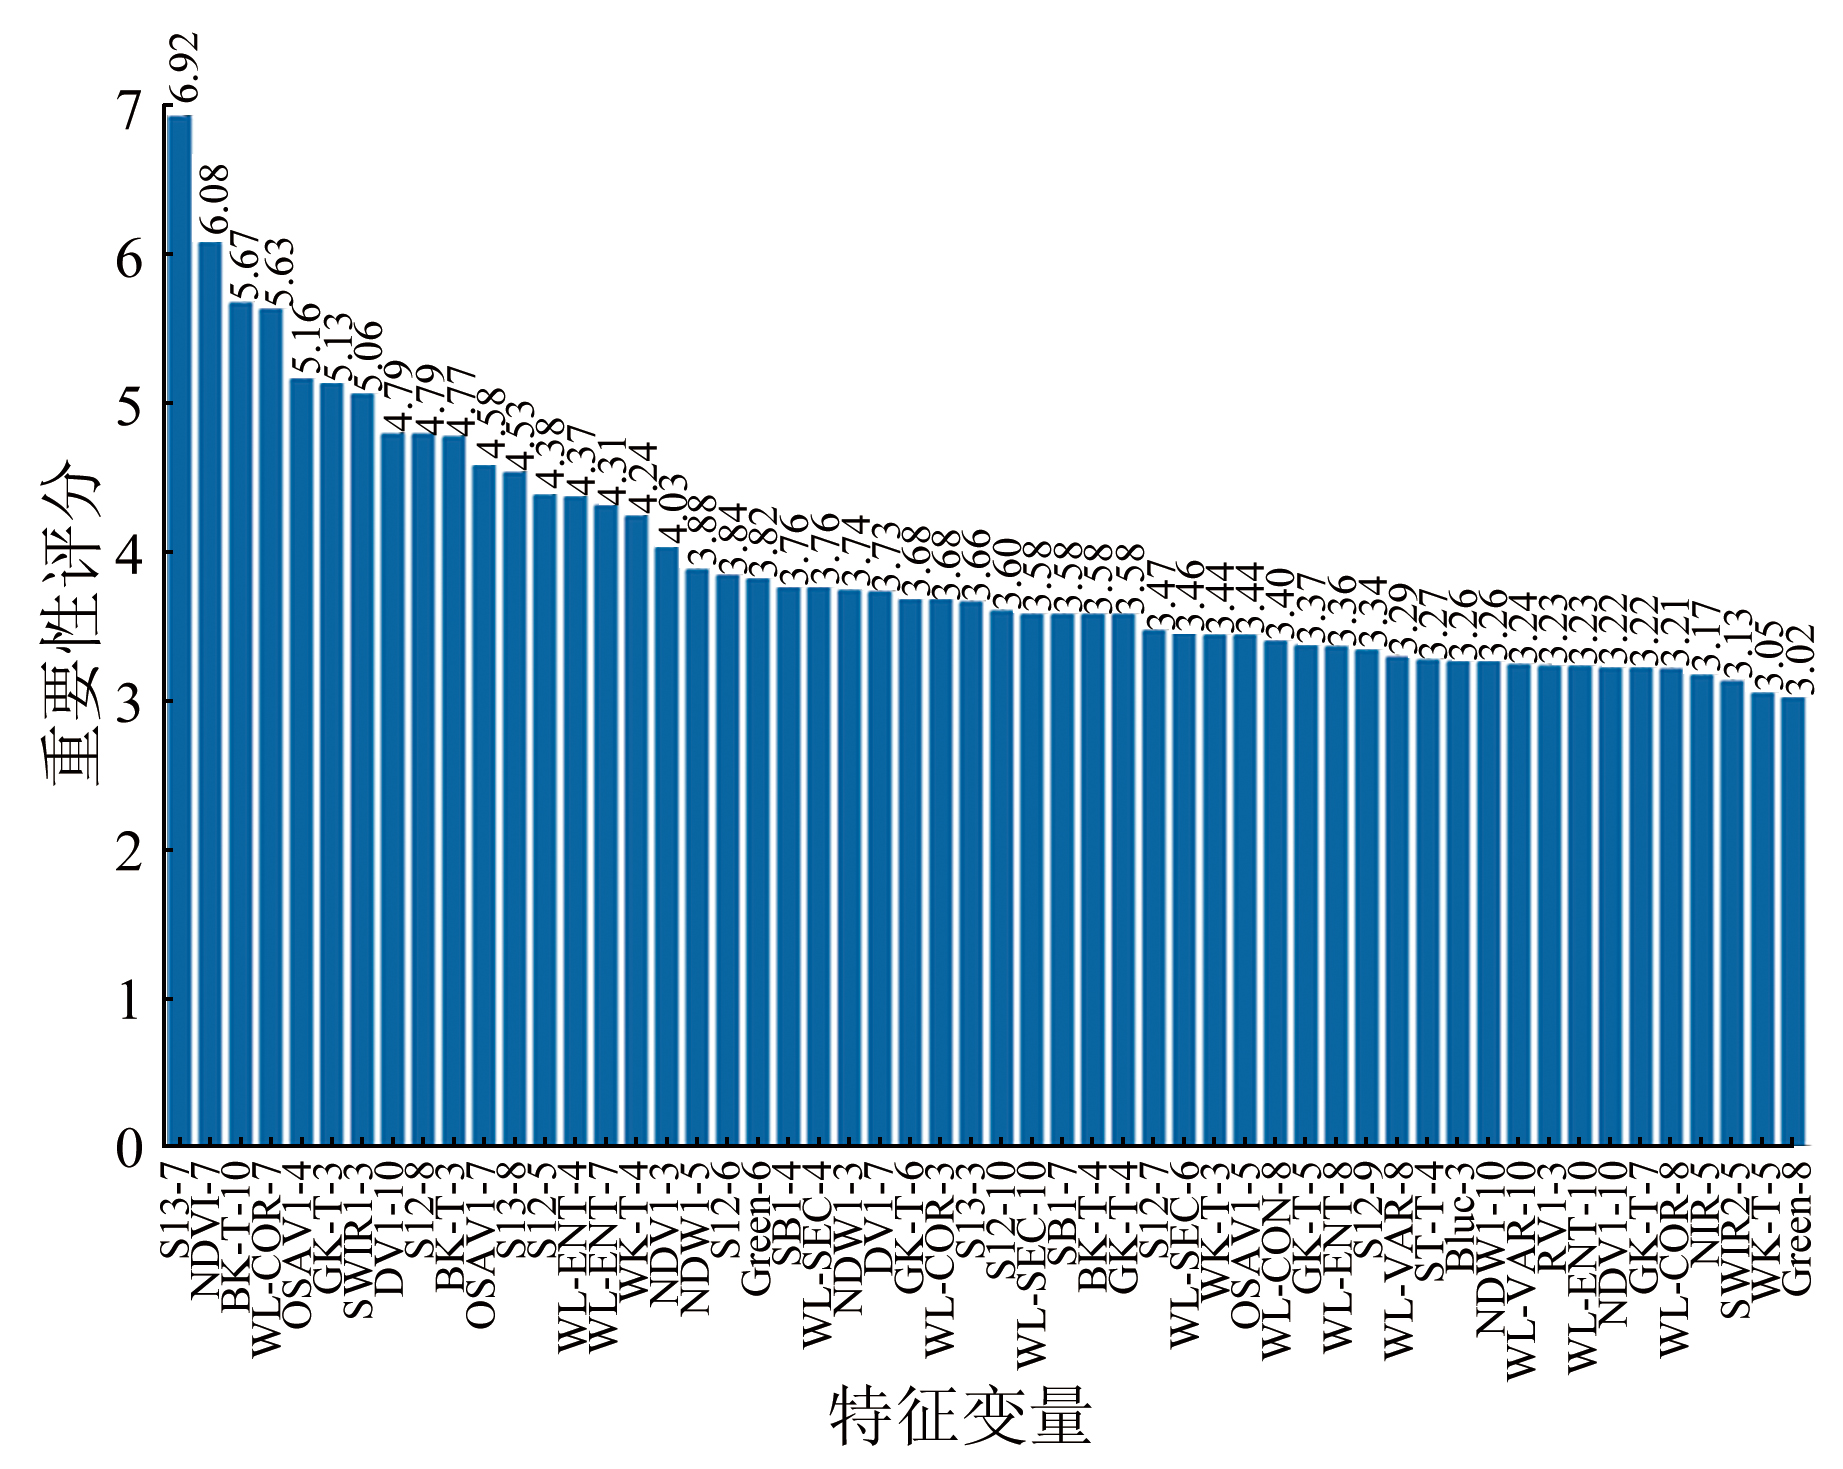
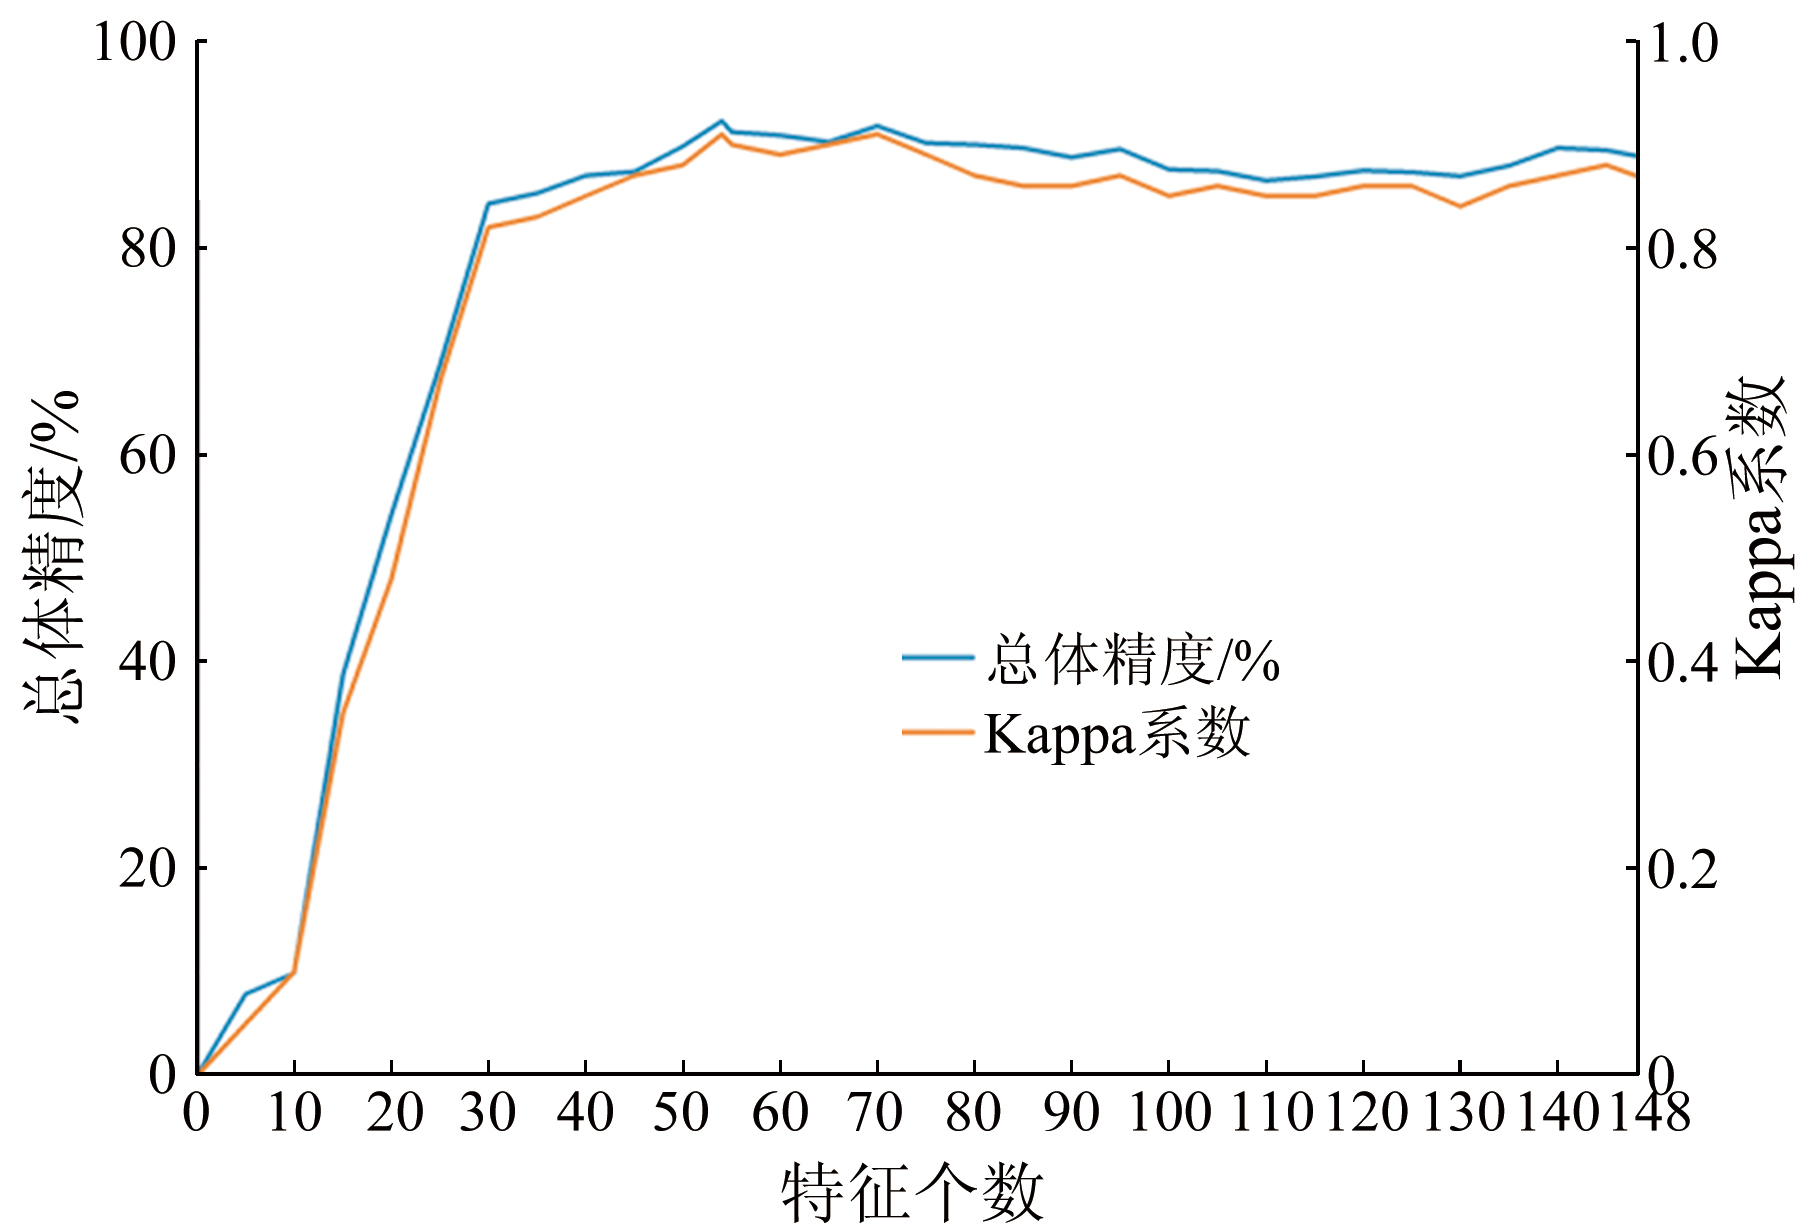
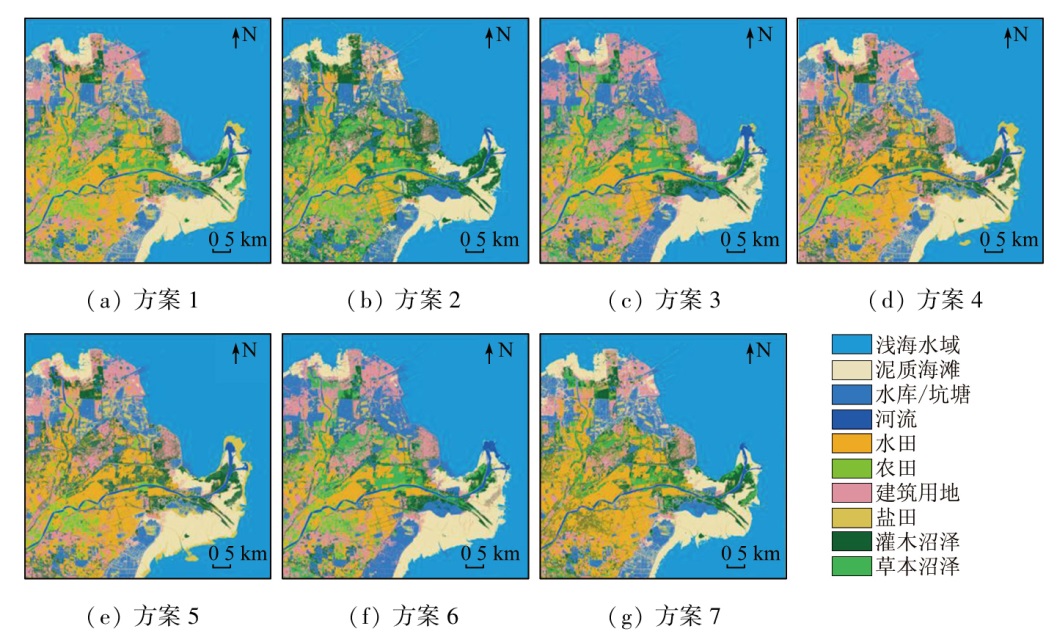
Exploring the remote sensing-based classification of coastal wetlands is significant for their conservation and planning. Hence, this study investigated the Yellow River Delta with the 8-view Landsat8 OIL images from March to October 2019 as the data source. It constructed seven classification schemes based on different features of the images on the Google Earth Engine (GEE) cloud platform. Then, it employed the random forest classifier to classify different feature sets, with the scheme exhibiting the best classification effects selected for mapping the wetland categories of the Yellow River Delta. Considering poor data quality in August and September due to cloud contamination, this study filled in the cloudy zones using the enhanced spatial and temporal adaptive reflectance fusion model (ESTARFM) algorithm. The results show that: ① The predicted images generated from the ESTARFM manifested a high correlation with the real image bands, with R values above 0.73, suggesting that the reconstructed images could be used in this study; ② The random forest algorithm was used to classify the surface feature types in the study area. Through optimal feature selection, the classification results of Scheme 7 demonstrated an overall accuracy of 92.28%, higher than those of conventional schemes, with a Kappa coefficient of 0.91, aligning with the actual wetland conditions. The results of this study can assist in deeply understanding the spatial distributions of different wetlands in the area, and provide a scientific basis for the conservation and planning of the regional ecological environment.

Key wordsLandsat8    multitemporal data    Yellow River Delta wetland    image fusion    Google Earth Engine    random forest
收稿日期: 2022-10-24      出版日期: 2024-06-14
ZTFLH:  TP753  
基金资助:山东省自然科学基金项目“遥感信息与模型系统模拟黄河三角洲滨海湿地动态及未来情景预测”(ZR2020QF067)
通讯作者: 张佳华(1966-),博士,教授,主要从事生态环境遥感等研究。 Email: zhangjh@radi.ac.cn
作者简介: 冯 倩(1996-),女,硕士,主要研究方向为湿地遥感。 Email: 202071360@yangtzeu.edu.cn
引用本文:   
冯倩, 张佳华, 邓帆, 吴贞江, 赵恩灵, 郑培鑫, 韩杨. 基于特征优选和时空融合算法的黄河三角洲湿地类别制图方法研究[J]. 自然资源遥感, 2024, 36(2): 39-49.
FENG Qian, ZHANG Jiahua, DENG Fan, WU Zhenjiang, ZHAO Enling, ZHENG Peixin, HAN Yang. A mapping methodology for wetland categories of the Yellow River Delta based on optimal feature selection and spatio-temporal fusion algorithm. Remote Sensing for Natural Resources, 2024, 36(2): 39-49.
链接本文:  
https://www.gtzyyg.com/CN/10.6046/zrzyyg.2022413      或      https://www.gtzyyg.com/CN/Y2024/V36/I2/39
Fig.1  黄河三角洲地理位置及卫星影像
影像编号 获取时间 云量/% 波段数 影像质量
1 2019-03-14 <1% 6 良好
2 2019-04-15 <1% 6 良好
3 2019-05-01 <1% 6 良好
4 2019-06-02 <1% 6 良好
5 2019-07-20 <1% 6 良好
6 2019-08-21 约90% 6
7 2019-09-22 约95% 6
8 2019-10-24 <1% 6 良好
Tab.1  Landsat8 OIL影像信息
Landsat波段 波段宽度/nm 空间分辨率/m MOD09A1波段 波段宽度/nm 空间分辨率/m
B2蓝 450~510 30 B3 459~479 500
B3绿 530~590 30 B4 545~565 500
B4红 640~670 30 B1 620~670 500
B5近红外 850~880 30 B2 841~876 500
B6 SWIR1 1 570~1 650 30 B6 1 628~1 652 500
B7 SWIR2 2 110~2 290 30 B7 2 105~2 155 500
Tab.2  Landsat与MODIS数据波段信息
地物类别 浅海水域 泥质海滩 河流 草本沼泽 灌木沼泽 水库/坑塘 水田 盐田 建筑物 养殖池 农田
分类样
本数量
33 927 1 086 2 275 471 595 3 652 2 974 249 1 822 844 793
验证样
本数量
8 238 285 570 128 133 929 762 67 484 222 193
Tab.3  地物样本点信息
一级分类 二级分类 说明
近海与海岸湿地 浅海水域 低潮时水深<6 m的浅海水域,包括海湾海峡
泥质海滩 由淤泥质组成的植被覆盖度<30%的淤泥质海滩
河流湿地 河流 常年有水或间歇性有水流动的河流,包括河床部分
沼泽湿地 草本沼泽 以草本植物为主的永久或季节性咸淡水沼泽,喜湿多年生草本和禾本科植物占优势,研究区典型植被如芦苇、香蒲、盐地碱蓬、互花米草等
灌木沼泽 以灌木为主的永久性或季节性沼泽,如柽柳等
人工湿地 水库 /坑塘 包括水库、坑塘、养殖池以及城市景观和娱乐水面等人工建造的静止水体
水田 用于种植水稻田、水生作物的耕地,如水稻田、藕池
盐田 为获取盐业资源而修建的晒盐场所或盐池
Tab.4  黄河三角洲湿地分类方案
Fig.2  实验流程图
特征类别 特征名称 特征描述/公式
光谱特征 波段(band) 蓝,绿,红,近红,中红1,中红2
植被/水体指数 归一化植被指数(normalized difference vegetation index,NDVI) R n i r - R r e d R n i r + R r e d
比值植被指数(ratio vegetation index,RVI) R n i r R r e d
差值植被指数(differential vegetation index,DVI) R n i r - R r e d
归一化水体指数(normalized difference water index,NDWI) R g r e e n - R n i r R g r e e n + R n i r
盐分/土壤指数 盐分指数 2(salinity index 2,SI2) R g r e e n 2 + R r e d 2 + R n i r 2  
盐分指数 3(salinity index 3,SI3) R g r e e n 2 + R r e d 2  
盐分指数(salinity index,SI-T) ( R r e d R n i r ) × 100
优化型土壤调节植被指数(soil adjusted vegetation index,SAVI) R n i r - R r e d R n i r + R r e d + 0.6
土壤亮度指数(soil brightness index,SBI) R r e d 2 + R n i r 2  
K-T变换 亮度(brightness) 0.3029 R b l u e + 0.2786 R g r e e n + 0.4733 R r e d + 0.5599 R n i r + 0.5080 R s w i r l + 0.1872 R s w i r 2
绿度(greenness) - 0.2941 R b l u e - 0.2430 R g r e e n + 0.5424 R r e d + 0.7276 R n i r - 0.7170 R s w i r l - 0.1680 R s w i r 2
湿度(wetness) 0.1511 R b l u e + 0.1973 R g r e e n + 0.3283 R r e d + 0.3407 R n i r - 0.7117 R s w i r l - 0.4559 R s w i r 2
纹理特征 方差 (GLGM_Variance) i j p ( i , j ) × ( i - M e a n ) 2
对比度(GLGM_Contrast) i j p ( i , j ) × ( i - j ) 2
熵(GLGM_Entropy) i j p ( i , j ) × l n p ( i , j )
相关性(GLGM_Correlation) i j ( i - M e a n ) × ( j - M e a n ) p ( i , j ) 2 V a r i a n c e
二阶矩(GLGM_Second Moment) i j p ( i , j ) 2
Tab.5  Landsat8特征集描述
方案 特征组合
方案1 多时相光谱特征
方案2 多时相光谱特征+多时相植被指数/水体指数
方案3 多时相光谱特征+多时相土壤指数/盐分指数
方案4 多时相光谱特征+多时相K-T变化特征
方案5 多时相光谱特征+多时相纹理特征
方案6 多时相光谱特征+多时相植被/水体指数+多时相盐分/土壤指数+多时相K-T变化特征+多时相纹理特征
方案7 特征优选组合
Tab.6  实验方案信息
Fig.3  Landsat8 原始影像与预测影像及局部图
指数 日期 绿 近红 SWIR1 SWRI2 NDVI NDWI SAVI SI2 SI3
相关系数R 8月21日 0.87 0.85 0.79 0.88 0.87 0.81 0.85 0.90 0.78 0.85 8.85
9月22日 0.77 0.79 0.73 0.81 0.79 0.73 0.78 0.80 0.84 0.79 0.79
Tab.7  原始 Landsat8 OLI 影像与 ESTARFM 融合后结果相关性分析
Fig.4  特征重要性分布
Fig.5  特征变量个数与分类精度和Kappa系数
月份 优选特征 特征数量
3月 Blue-3,SWIR1-3,NDVI-3,NDWI-3,RVI-3,GK-T-3,BK-T-3,WK-T-3,SI3-3,WL-COR-3 10
4月 WK-T-4,BK-T-4,GK-T-4,OSAVI-4,SBI-4,ST-T-4,WL-ENT-4,WL-SEC-4 8
5月 NIR-5,SWIR2-5,NDWI-5,SI2-5,OSAVI-5,GK-T-5,WK-T-5 7
6月 Green-6,GK-T-6,WL-SEC-6 3
7月 NDVI-7,DVI-7,SI3-7,OSAVI-7,SBI-7,SI2-7,GK-T-7,WL-COR-7,WL-ENT-7 9
8月 Green-8,SI2-8,SI3-8,WL-CON-8,WL-ENT-8,WL-VAR-8,WL-COR-8 7
9月 SI2-9 1
10月 DVI-10,NDWI-10,NDVI-10,SI2-10,BK-T-10,WL-SEC-10,WL-VAR-10,WL-ENT-10 8
Tab.8  优选特征分布表
Fig.6  不同方案分类结果
类别 方案1 方案2 方案3 方案4 方案5 方案6 方案7
PA/% UA/% PA/% UA/% PA/% UA/% PA/% UA/% PA/% UA/% PA/% UA/% PA/% UA/%
浅海水域 95.94 97.35 99.15 96.41 98.31 94.13 99.54 98.35 99.36 97.13 97.50 96.86 99.12 94.88
泥质海滩 81.07 84.69 88.02 86.08 85.79 86.31 95.48 88.61 93.44 87.20 94.69 85.55 98.60 96.98
水库坑塘 80.85 70.03 75.16 81.01 79.07 80.73 83.16 88.91 75.16 85.68 77.06 90.21 83.67 90.33
河流 86.37 89.07 86.92 96.18 87.46 93.93 93.80 96.70 91.26 89.52 88.52 96.41 89.36 99.86
水田 91.89 89.52 93.30 89.51 94.28 85.79 94.84 90.83 90.03 94.42 90.87 92.17 96.86 90.02
农田 93.79 75.57 89.40 97.91 82.72 99.72 90.14 95.31 91.76 95.78 93.91 81.30 84.90 96.12
建筑用地 62.53 79.68 70.69 74.55 70.45 69.63 81.10 81.30 85.70 66.65 76.24 69.00 86.37 86.30
盐田 76.51 84.65 89.06 82.07 87.43 88.62 90.95 90.76 82.22 85.51 93.53 85.92 96.00 97.77
草本沼泽 54.71 73.11 84.28 57.51 74.05 59.39 74.83 77.93 66.87 70.95 83.54 72.93 87.74 86.33
灌木沼泽 64.30 81.72 70.51 82.77 63.36 86.17 70.76 89.77 74.43 84.23 53.84 83.50 71.49 70.85
总精度/% 85.11 89.05 87.39 91.90 90.01 88.89 92.28
Kappa系数 0.83 0.86 0.85 0.91 0.88 0.87 0.91
Tab.9  分类精度统计
[1] 张晓龙, 李培英, 李萍, 等. 中国滨海湿地研究现状与展望[J]. 海洋科学进展, 2005, 23(1):87-95.
Zhang X L, Li P Y, Li P, et al. Present conditions and prospects of Study on coastal wetlands in China[J]. Advances in Marine Science, 2005, 23(1):87-95.
[2] 刘润红, 梁士楚, 赵红艳, 等. 中国滨海湿地遥感研究进展[J]. 遥感技术与应用, 2017, 32(6):998-1011.
Liu R H, Liang S C, Zhao H Y, et al. Progress of Chinese coastal wetland based on remote sensing[J]. Remote Sensing Technology and Application, 2017, 32(6):998-1011.
[3] 朱纹君, 韩美, 魏丹妮, 等. 黄河三角洲人地关系协调度时空演变及其驱动机制[J]. 水土保持研究, 2023, 30(1):388-396.
Zhu W J, Han M, Wei D N, et al. Spatiotemporal evolution and driving mechanism of human-environment coordination in the Yellow River Delta[J]. Research of Soil and Water Conservation, 2023, 30(1):388-396.
[4] 刘海红, 刘胤序, 张春华, 等. 1991—2016年黄河三角洲湿地变化的遥感监测[J]. 地球与环境, 2018, 46(6):590-598.
Liu H H, Liu Y X, Zhang C H, et al. Remote sensing monitoring of wetland changes in the Yellow River Delta during 1991-2016[J]. Earth and Environment, 2018, 46(6):590-598.
[5] 钟燕飞, 吴浩, 刘寅贺. 湿地遥感制图研究现状与展望[J]. 中国科学基金, 2022, 36(3):420-431.
Zhong Y F, Wu H, Liu Y H. Research status and prospects of remote sensing for wetland mapping[J]. Bulletin of National Natural Science Foundation of China, 2022, 36(3):420-431.
[6] 祁欣. 基于机器学习的遥感数据处理方法综述[J]. 品牌与标准化, 2022(s1):148-150.
Qi Y. Survey of Remote sensing data processing methods based on machine learning[J]. Brand & Standardization, 2022(s1):148-150.
[7] 刘春亭, 冯权泷, 金鼎坚, 等. 随机森林协同Sentinel-1/2的东营市不透水层信息提取[J]. 自然资源遥感, 2021, 33(3):253-261.doi:10.6046/zrzyyg.2020310.
Liu C T, Feng Q L, Jin D J, et al. Application of random forest and Sentinel-1/2 in the information extraction of impervious layers in Dongying City[J]. Remote Sensing for Natural Resources, 2021, 33(3):253-261.doi:10.6046/zrzyyg.2020310.
[8] 黄佩, 普军伟, 赵巧巧, 等. 植被遥感信息提取方法研究进展及发展趋势[J]. 自然资源遥感, 2022, 34(2):10-19.doi:10.6046/zrzyyg.2021137.
Huang P, Pu J W, Zhao Q Q, et al. Research progress and development trend of remote sensing information extraction methods of vegetation[J]. Remote Sensing for Natural Resources, 2022, 34(2):10-19.doi:10.6046/zrzyyg.2021137.
[9] Wu Z J, Zhang J H, Deng F, et al. Fusion of GF and MODIS data for regional-scale grassland community classification with EVI2 time-series and phenological features[J]. Remote Sensing, 2021, 13(5):835.
[10] 史飞飞, 高小红, 肖建设, 等. 基于集成学习和多时相遥感影像的枸杞种植区分类[J]. 自然资源遥感, 2022, 34(1):115-126.doi:10.6046/zrzyyg.2021064.
Shi F F, Gao X H, Xiao J S, et al. Classification of wolfberry planting areas based on ensemble learning and multi-temporal remote sensing images[J]. Remote Sensing for Natural Resources, 2022, 34(1):115-126.doi:10.6046/zrzyyg.2021064.
[11] 程筱茜, 洪友堂, 陈劲松, 等. 基于ESTARFM的内陆湖泊遥感动态变化监测[J]. 国土资源遥感, 2020, 32(3):183-190.doi:10.6064/zrzyyg.2020.03.24.
Cheng X Q, Hong Y T, Chen J S, et al. A study of the long-term remote sensing dynamic monitoring of inland based on ESTARFM[J]. Remote Sensing for Land and Resources, 2020, 32(3):183-190.doi:10.6064/zrzyyg.2020.03.24.
[12] Gao F, Masek J, Schwaller M, et al. On the blending of the Landsat and MODIS surface reflectance: Predicting daily Landsat surface reflectance[J]. IEEE Transactions on Geoscience and Remote sensing, 2006, 44(8):2207-2218.
[13] Zhu X L, Chen J, Gao F, et al. An enhanced spatial and temporal adaptive reflectance fusion model for complex heterogeneous regions[J]. Remote Sensing of Environment, 2010, 114(11):2610-2623.
[14] 高瑞, 王志勇, 周晓东, 等. 利用多时相遥感监测与分析黄河三角洲湿地变化动态[J]. 测绘通报, 2021(4):22-27.
doi: 10.13474/j.cnki.11-2246.2021.0105
Gao R, Wang Z Y, Zhou X D, et al. Monitoring and analysis of wetland change dynamics in the Yellow River Delta using multi-temporal remote sensing[J]. Bulletin of Surveying and Mapping, 2021(4):22-27.
doi: 10.13474/j.cnki.11-2246.2021.0105
[15] 程丽娜, 钟才荣, 李晓燕, 等. Sentinel-2密集时间序列数据和Google Earth Engine的潮间带湿地快速自动分类[J]. 遥感学报, 2022, 26(2):348-357.
Cheng L N, Zhong C R, Li Xiao Yan, et al. Rapid and automatic classification of intertidal wetlands based on intensive time series Sentinel-2 images and Google Earth Engine[J]. National Remote Sensing Bulletin, 2022, 26(2):348-357.
[16] 张磊, 宫兆宁, 王启为, 等. Sentinel-2影像多特征优选的黄河三角洲湿地信息提取[J]. 遥感学报, 2019, 23(2):313-326.
Zhang L, Gong Z N, Wang Q W, et al. Wetland mapping of Yellow River Delta wetlands based on multi-feature optimization of Sentinel-2 images[J]. National Remote Sensing Bulletin, 2019, 23(2):313-326.
[17] 杨迎港, 刘培, 张合兵, 等. 基于特征优选随机森林算法的GF-2影像分类[J]. 航天返回与遥感, 2022, 43(2):115-126.
Yang Y G, Liu P, Zhang H B, et al. Research on GF-2 image classification based on feature optimization random forest algorithm[J]. Spacecraft Recovery & Remote Sensing, 2022, 43(2):115-126.
[18] 朱琦, 郭华东, 张露. 基于多时相Landsat8 影像的海南岛热带天然林类型遥感分类[J]. 自然资源遥感, 2022, 34(2):215-223.doi:10.6046/zrzyyg.2021156.
Zhu Q, Guo H D, Zhang L, et al. Classification of tropical natural forests in Hainan Island based on multi-temporal Landsat8 remote sensing images[J]. Remote Sensing for Natural Resources, 2022, 34(2):215-223.doi:10.6046/zrzyyg.2021156.
[19] Gorelick N, Hancher M, Dixon M, et al. Google Earth Engine: Planetary -scale geospatial analysis for everyone[J]. Remote Sensing of Environment, 2017, 202:18-27.
[20] 王渊, 赵宇豪, 吴健生. 基于Google Earth Engine云计算的城市群生态质量长时序动态监测——以粤港澳大湾区为例[J]. 生态学报, 2020, 40(23):8461-8473.
Wang Y, Zhao Y H, Wu J S. Dynamic monitoring of long time series of ecological quality in urban agglomerations using Google Earth Engine cloud computing:A case study of the Guang dong-Hong Kong-Macao Greater Bay Area,China[J]. Acta Ecologica Sinica, 2020, 40(23):8461-8473.
[21] 徐振田, 张莎, 白雲, 等. 基于 Landsat 数据的黄河三角洲湿地提取及近 30 年动态研究[J]. 海洋湖沼通报, 2020(3):70-79.
Xu Z T, Ail S, Zhang S, et al. Mapping the wetland in Yellow River Delta and its dynamics in recent 30 years based on Landsat data[J]. Transactions of Oceanology and Limnology, 2020(3):70-79.
[22] 牟晓杰, 刘兴土, 阎百兴, 等. 中国滨海湿地分类系统[J]. 湿地科学, 2015, 13(1):19-26.
Mou X J, Liu X T, Yan B X, et al. Classification system of coastal wetlands in China[J]. Wetland Science, 2015, 13(1):19-26.
[23] Bradley A, Jackway P, Lovell B. Classification in scale-space:Applications to texture analysis[C]// Int.Conf.on Information Processing in Medical Imaging, 1995:375-376.
[24] Breiman L. Random forests[J]. Machine Learning, 2001, 45(1):5-32.
[1] 刘永新, 张思源, 边鹏, 王丕军, 袁帅. 1989—2020年黄河流域巴彦淖尔段地表覆盖类型时空演变研究[J]. 自然资源遥感, 2024, 36(2): 207-217.
[2] 魏鑫, 任雨, 陈曦东, 胡青峰, 刘辉, 周婧, 宋冬伟, 张培佩, 黄志全. 基于时序Sentinel-2数据水体动态变化监测——以河南省为例[J]. 自然资源遥感, 2024, 36(2): 268-278.
[3] 薛志泳, 田震, 朱建华, 赵阳. 基于Google Earth Engine的八门湾红树林年际变化监测[J]. 自然资源遥感, 2024, 36(2): 279-286.
[4] 赵鹤婷, 李小军, 徐欣钰, 盖钧飞. 基于ICM的高光谱图像自适应全色锐化算法[J]. 自然资源遥感, 2024, 36(2): 97-104.
[5] 张昊杰, 杨立娟, 施婷婷, 王帅. GF-6 WFV传感器数据的缨帽变换系数推导[J]. 自然资源遥感, 2024, 36(2): 105-115.
[6] 宋英旭, 邹昱嘉, 叶润青, 贺志霞, 王宁涛. 利用GEE云平台实现三峡库区滑坡危险性动态分析[J]. 自然资源遥感, 2024, 36(1): 154-161.
[7] 刘美艳, 聂胜, 王成, 习晓环, 程峰, 冯宝坤. 基于ICESat-2和Sentinel-2A数据的森林蓄积量反演[J]. 自然资源遥感, 2024, 36(1): 210-216.
[8] 卢献健, 张焕铃, 晏红波, 黎振宝, 郭子扬. 协同Sentinel-1/2多特征优选的甘蔗提取方法[J]. 自然资源遥感, 2024, 36(1): 86-94.
[9] 杜晓川, 娄德波, 徐林刚, 范莹琳, 张琳, 李婉悦. 基于GF-2影像和随机森林算法的花岗伟晶岩提取[J]. 自然资源遥感, 2023, 35(4): 53-60.
[10] 余绍淮, 徐乔, 余飞. 联合光学和SAR遥感影像的山区公路滑坡易发性评价方法[J]. 自然资源遥感, 2023, 35(4): 81-89.
[11] 钟骁勇, 李洪义, 郭冬艳, 谢模典, 赵婉如, 胡碧峰. 基于多源环境变量和随机森林模型的江西省耕地土壤pH值空间预测[J]. 自然资源遥感, 2023, 35(4): 178-185.
[12] 何苏玲, 贺增红, 潘继亚, 王金亮. 基于多模型的县域土地利用/土地覆盖模拟[J]. 自然资源遥感, 2023, 35(4): 201-213.
[13] 李光哲, 王浩, 曹银璇, 张晓宇, 宁晓刚. 长株潭城市群生态环境质量时空演变及影响因素分析[J]. 自然资源遥感, 2023, 35(4): 244-254.
[14] 陈健, 李虎, 刘玉锋, 常竹, 韩伟杰, 刘赛赛. 基于Sentinel-2数据多特征优选的农作物遥感识别研究[J]. 自然资源遥感, 2023, 35(4): 292-300.
[15] 伍炜超, 叶发旺. 面向多背景环境的Sentinel-2云检测[J]. 自然资源遥感, 2023, 35(3): 124-133.
Viewed
Full text


Abstract

Cited

  Shared   
  Discussed   
京ICP备05055290号-2
版权所有 © 2015 《自然资源遥感》编辑部
地址:北京学院路31号中国国土资源航空物探遥感中心 邮编:100083
电话:010-62060291/62060292 E-mail:zrzyyg@163.com
本系统由北京玛格泰克科技发展有限公司设计开发