|
|
|
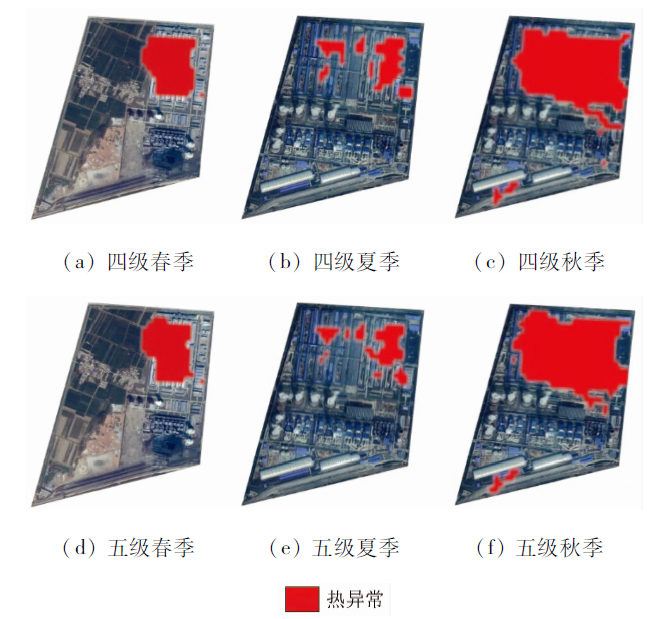
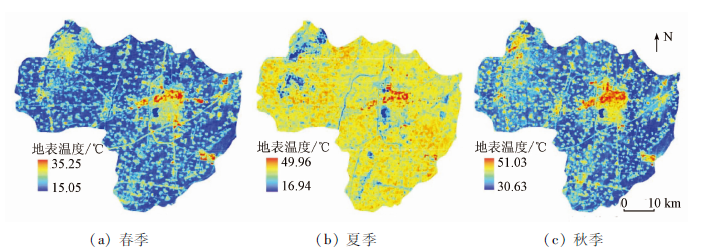
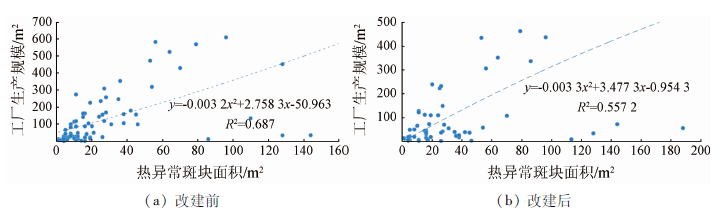
Abstract As one of the important mechanisms affecting urban thermal environment, industry accurately detects factories that cause thermal anomalies, and analyzes the impact of industrial thermal anomalies on local thermal environment, which is of great significance for scientific planning of industrial construction and improvement of urban thermal environment. Based on the Landsat8 data of different seasons, this paper uses the radiation transmission method to invert the surface temperature, compares the thermal anomaly detection method based on the thermal field variation index, and performs the local thermal environment effect analysis based on the higher precision detection results. The results are as follows: ① The four-stage method is more suitable for industrial thermal anomaly detection research. ②The scale of the factory production is directly proportional to the area of the corresponding thermal anomaly plaque. For every 5.8 square kilometers of factory production scale, the average thermal plaque area increases by 0.18 square kilometers. ③Industrial thermal anomalies have thermal environmental effects on local building and nonbuilding, the effect of warming on building is smaller with distance, and the effect of temperature increase on nonbuilding in the 1 km range is obvious. The research results can provide reference for industrial thermal anomaly detection and analysis of the effects of industrial thermal anomalies on the local environment.
|
| Keywords
industrial thermal anomaly
thermal environment effect
thermal field variation index
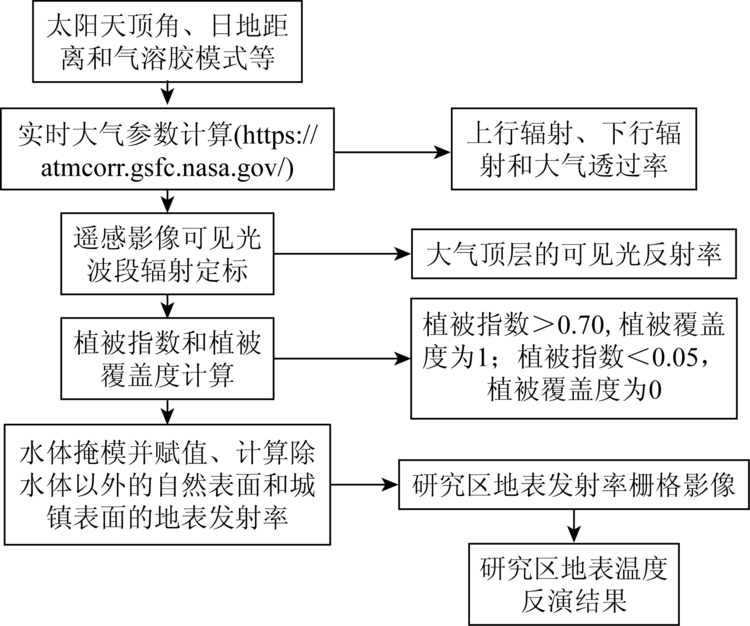
radiative transfer equation
remote sensing
|
|
|
|
Corresponding Authors:
MENG Qingyan
E-mail: 1023654239@qq.com;mengqy@radi.ac.cn
|
|
Issue Date: 23 December 2020
|
|
|
| [1] |
Xu B, Lin B. How industrialization and urbanization process impacts on CO2 emissions in China:Evidence from nonparametric additive regression models[J]. Energy Economics, 2015,48:188-202.
doi: 10.1016/j.eneco.2015.01.005
url: https://linkinghub.elsevier.com/retrieve/pii/S0140988315000195
|
| [2] |
Yan H, Wu F, Dong L. Influence of a large urban park on the local urban thermal environment[J]. Science of the Total Environment, 2018,622-623:882-891.
doi: 10.1016/j.scitotenv.2017.11.327
url: https://linkinghub.elsevier.com/retrieve/pii/S0048969717333867
|
| [3] |
Mohan M, Kandya A. Impact of urbanization and land-use/land-cover change on diurnal temperature range:A case study of tropical urban airshed of India using remote sensing data[J]. Science of the Total Environment, 2015,506-507:453-465.
|
| [4] |
Robaa S M. Some aspects of the urban climates of Greater Cairo Region,Egypt[J]. International Journal of Climatology, 2013,33(15):3206-3216.
|
| [5] |
Rao Y H, Xu Y, Zhang J J, et al. Does subclassified industrial land have a characteristic impact on land surface temperatures? Evidence for and implications of coal and steel processing industries in a Chinese mining city[J]. Ecological Indicators, 2018,89:22-34.
|
| [6] |
张敦虎, 王晓鹏, 康高峰, 等. 基于ASTER数据的煤田火区温度异常信息提取方法研究——以新疆轮台县阳霞火区为例[J]. 中国煤炭地质, 2009,21(9):35-37.
|
| [6] |
Zhang D H, Wang X P, Kang G F, et al. Study on coal fire area land surface temperature anomaly information extraction from ASTER satellite images:A case study of Yangxia coal fire area in Luntai County,Xinjiang[J]. Coal Geology of China, 2009,21(9):35-37.
|
| [7] |
吴学伟, 徐亚明, 龚文峰. 城市热岛空间格局及其变化的图形信息特征分析[J]. 武汉大学学报(信息科学版), 2017,42(12):1711-1718.
|
| [7] |
Wu X W, Xu Y M, Gong W F. Graphical information characteristics of urban heat island spatial pattern and its change[J]. Geomatics and Information Science of Wuhan University, 2017,42(12):1711-1718.
|
| [8] |
陈松林, 王天星. 等间距法和均值标准差法界定城市热岛的对比研究[J]. 地球信息科学学报, 2009,11(2):145-150.
|
| [8] |
Chen S L, Wang T X. Comparison analyses of equal interval method and mean-standard deviation method used to delimitate urban heat island[J]. Journal of Geo-Information Science, 2009,11(2):145-150.
|
| [9] |
潘竟虎, 董磊磊, 王娜云, 等. 兰西城市群热环境格局多尺度研究[J]. 国土资源遥感, 2018,30(2):138-146.doi: 10.6046/gtzyyg.2018.02.19.
|
| [9] |
Pan J H, Dong L L, Wang N Y, et al. A multi-scale study of thermal environment pattern in Lanzhou Xining agglomeration[J]. Remote Sensing for Land and Resources, 2018,30(2):138-146.doi: 10.6046/gtzyyg.2018.02.19.
|
| [10] |
武文昊, 王新杰, 黄瑞芬. 基于遥感数据的常州市热岛效应分析[J]. 南京林业大学学报(自然科学版), 2017,41(5):185-190.
|
| [10] |
Wu W H, Wang X J, Huang R F. Study on urban heat islands Changzhou City based on remote sensing data[J]. Journal of Nanjing Forestry University(Natural Science Edition), 2017,41(5):185-190.
|
| [11] |
陶于祥, 许凯丰, 易宗旺, 等. 基于半变异函数的城市热岛空间异质性分析[J]. 西南大学学报(自然科学版), 2018,40(10):145-152.
|
| [11] |
Tao Y X, Xu K F, Yi Z W, et al. A semi-variogram-based analysis of spatial heterogeneity of urban heat islands[J]. Journal of Southwest University(Natural Science), 2018,40(10):145-152.
|
| [12] |
孙飒梅, 卢昌义. 遥感监测城市热岛强度及其作为生态监测指标的探讨[J]. 厦门大学学报(自然科学版), 2002,41(1):66-70.
|
| [12] |
Sun S M, Lu C Y. Remote sensing monitoring of urban heat island intensity and its application as ecological monitoring index[J]. Journal of Xiamen University(Natural Science), 2002,41(1):66-70.
|
| [13] |
罗小波, 陈丹, 刘明皓, 等. 基于HJ-1B/IRS的重庆市热岛效应监测应用[J]. 地球信息科学学报, 2011,13(6):833-839.
|
| [13] |
Luo X B, Chen D, Liu M H, et al. Application research on monitor of heat island effect in Chongqing based on HJ-1B/IRS[J]. Journal of Geo-Information Science, 2011,13(6):833-839.
|
| [14] |
张宇, 赵伟, 龙凤, 等. 基于Landsat TM/TIRS的重庆市主城区热岛效应研究[J]. 水土保持研究, 2015,22(5):191-196,203.
|
| [14] |
Zhang Y, Zhao W, Long F, et al. Study of urban heat island based on Landsat TM/TIRS in the central area of Chongqing City[J]. Research of Soil and Water Conservation, 2015,22(5):191-196,203.
|
| [15] |
王宏博, 李丽光, 赵梓淇, 等. 基于TM/ETM+数据的沈阳市各区城市热岛特征[J]. 生态学杂志, 2015,34(1):219-226.
|
| [15] |
Wang H B, Li L G, Zhao Z Q, et al. Urban heat island variation of each district in Shenyang based on TM / ETM+ data[J]. Chinese Journal of Ecology, 2015,34(1):219-226.
|
| [16] |
Matthew M, Aaron G, Allen L, et al. Stray light artifacts in imagery from the Landsat8 thermal infrared sensor[J]. Remote Sensing, 2014,6(11):10435-10456.
|
| [17] |
Soux A, Voogt J A, Oke T R. A model to calculate what a remote sensor ‘Sees’ of an urban surface[J]. Boundary-Layer Meteoro-logy, 2004,112(2):401-424.
|
| [18] |
Yu X, Guo X, Wu Z. Land surface temperature retrieval from Landsat8 TIRS:Comparison between radiative transfer equation-based method,split window algorithm and single channel method[J]. Remote Sensing, 2014,6(10):9829-9852.
|
| [19] |
Kamran K V, Pirnazar M, Bansouleh V F. Land surface temperature retrieval from Landsat8 TIRS:Comparison between split window algorithm and SEBAL method[C]// Proceedings of SPIE-the International Society for Optical Engineering, 2015,9535.
|
| [20] |
Van D G A A, Owe M. On the relationship between thermal emissivity and the normalized difference vegetation index for natural surfaces[J]. International Journal of Remote Sensing, 1993,14(6):1119-1131.
|
| [21] |
Chen J, Yang K, Zhu Y, et al. Analysis of the relationship between land surface temperature and land cover types:A case study of Dianchi Basin[C]// International Conference on Geoinformatics. IEEE, 2016.
|
| [22] |
覃志豪, 李文娟, 徐斌, 等. 陆地卫星TM6波段范围内地表比辐射率的估计[J]. 国土资源遥感, 2004,16(3):28-32.doi: 10.6046/gtzyyg.2004.03.07.
doi: 10.6046/gtzyyg.2004.03.07
url: http://www.gtzyyg.com/CN/abstract/abstract1371.shtml
|
| [22] |
Qin Z H, Li W J, Xu B, et al. The estimation of land surface emissivity for Landsat TM6[J]. Remote Sensing for Land and Resources, 2004,16(3):28-32.doi: 10.6046/gtzyyg.2004.03.07.
|
| [23] |
Sobrino J A, Jimenez-Muoz J C, Soria G, et al. Land surface emissivity retrieval from different VNIR and TIR sensors[J]. IEEE Transactions on Geoscience and Remote Sensing, 2008,46(2):316-327.
doi: 10.1109/TGRS.36
url: https://ieeexplore.ieee.org/xpl/RecentIssue.jsp?punumber=36
|
| [24] |
Zhang L L, Meng Q, Sun Z H, et al. Spatial and temporal analysis of the mitigating effects of industrial relocation on the surface urban heat island over China[J]. ISPRS International Journal of Geo-Information, 2017,6(4):121.
|
| [25] |
马蔼乃. 地理科学与地理信息科学论[M]. 武汉: 武汉出版社, 2000.
|
| [25] |
Ma A N. Geographical science and geographic information science[M]. Wuhan: Wuhan Publishing House, 2000.
|
| [26] |
张勇, 余涛, 顾行发, 等. CBERS-02 IRMSS热红外数据地表温度反演及其在城市热岛效应定量化分析中的应用[J]. 遥感学报, 2006,10(5):789-797.
|
| [26] |
Zhang Y, Yu T, Gu X F, et al. Land surface temperature retrieval from CBERS-02 IRMSS thermal infrared data and its applications in quantitative analysis of urban heat island effect[J]. Journal of Remote Sensing, 2006,10(5):789-797.
doi: 10.11834/jrs.200605117
url: http://www.jors.cn/jrs/ch/reader/view_abstract.aspx?file_no=200605117&flag=1
|
| [27] |
薛晓娟, 孟庆岩, 王春梅, 等. 北京市热岛效应时空变化的HJ-1B监测分析[J]. 地球信息科学学报, 2012,14(4):474-480.
doi: 10.3724/SP.J.1047.2012.00474
url: http://www.dqxxkx.cn/CN/abstract/abstract10031.shtml
|
| [27] |
Xue X J, Meng Q Y, Wang C M, et al. Monitoring spatio-temporal changes of heat island effect in Beijing based on HJ-1B[J]. Journal of Geo-Information Science, 2012,14(4):474-480.
|
| [28] |
Zhang L L, Meng Q Y, Sun Z H, et al. Spatial and temporal analysis of the mitigating effects of industrial relocation on the surface urban heat island over China[J]. ISPRS International Journal of Geo-Information, 2017,6(4):121.
|
| [29] |
代颖懿, 刘辉, 黎启燃, 等. 基于中等空间分辨率遥感影像的建筑用地信息提取[J]. 亚热带资源与环境学报, 2013,8(4):68-74.
|
| [29] |
Dai Y Y, Liu H, Li Q R, et al. Extraction of built-up land information from medium spatial resolution satellite image[J]. Journal of Subtropical Resources and Environment, 2013,8(4):68-74.
|
| [30] |
孙佳琪, 刘永学, 董雁伫, 等. 基于Suomi-NPP VIIRS夜间热异常产品的城市工业热源分类——以京津冀地区为例[J]. 地理与地理信息科学, 2018,34(3):13-19.
|
| [30] |
Sun J Q, Liu Y X, Dong Y Z, et al. Classification of urban industrial heat sources based on Suomi-NPP VIIRS nighttime thermal anomaly products:A case study of the Beijing-Tianjin-Hebei Region[J]. Geography and Geo-Information Science, 2018,34(3):13-19.
|
| [31] |
Peng S S, Piao S L, Ciais P, et al. Surface urban heat island across 419 global big cities[J]. Environmental Science and Technology, 2011,46(2):696-703.
pmid: 22142232
url: https://www.ncbi.nlm.nih.gov/pubmed/22142232
|
| [32] |
Yu Z W, Xu S B, Zhang Y H, et al. Strong contributions of local background climate to the cooling effect of urban green vegetation[J]. Scientific Reports, 2018,8(1):6798.
pmid: 29717184
url: https://www.ncbi.nlm.nih.gov/pubmed/29717184
|
|
Viewed |
|
|
|
Full text
|
|
|
|
|
Abstract
|
|
|
|
|
Cited |
|
|
|
|
| |
Shared |
|
|
|
|
| |
Discussed |
|
|
|
|
 2020,
Vol. 32
2020,
Vol. 32
 ), MENG Qingyan2(